
Abstract
The proposed work aims to generate electricity by utilising the air flowing around the vehicle through the micro wind turbines (MWTs). In this case, the electricity produced can be used to charge up the battery or power up additional vehicle accessories, which increases the efficiency or/and range of the vehicle. Three driving cycles have been conducted to examine the model’s performance in moderate, highly dynamic and highway driving scenarios. The analytical works resulted in an 8.38%, 4.6% and 1.01% efficiency increase for the case of the Highway driving cycle (FTP), the new European driving cycle (NEDC) and the standardisation random test aggressive driving cycle (RTS), respectively when adding the micro wind turbines model. In terms of range analysis, 16, 11 and 2 km of the range were added to the full battery charge range of the vehicle when the vehicle was simulated for the case FTP, NEDC and RTS driving cycles scenarios, respectively. The results conclude that the value of micro wind turbines is shimming with highway driving scenarios where the effect of regenerative braking is absent and the drag force acting on the vehicle is at its highest rate.
Introduction
The transportation industry is one of the most energy-intensive, accounting for 28% of global energy consumption and over 37% of CO2 emissions. 1 Forty-one percent% of this emission source comes from passenger automobiles. 2 .As the global population continues to rise, the number of these automobiles on the road increases annually, contributing to the pollution problem. This is primarily due to the fact that many of these automobiles are powered by internal combustion engines (ICEs) that run on gasoline, diesel and natural gas, among others (dual fuel type). These engines’ emissions contain a variety of pollutants that are detrimental to air quality and human health. 3 To add insult to injury, this industry is also facing an economic crisis, with rising costs of fuel and maintenance. 4
All these economic and environmental concerns motivate the development of a clean and sustainable vehicle that would reduce pollution and save money. Thus, addressing the importance of increasing efficiency and lowering the vehicles’ energy losses is crucial. Car manufacturers are starting to implement a more sustainable approach when developing vehicles focusing on electrification or hybrid solutions to reduce or eliminate the use of fossil fuels. 5
Electrification holds much promise for further decarbonising transport. More efficient electric motors can be up to 90% efficient compared with ICEs which are typically only around 30%–40% efficient. 6 Not only that but battery electric vehicles (BEVs) emit no local air pollutants while they are running so they offer a significant solution for air quality improvements in cities around the world. Electric vehicles come in a variety of forms: fully electric vehicles (EVs), hybrid electric vehicles (HEVs) and plug-in hybrids (PHEVs) all fall under the umbrella of BEV technology. 7
Despite significant advancements in vehicle technology, Barnard 8 mention that the air resistance that a vehicle creates significantly contributes to the energy consumption of the vehicles. It is interesting to note that forced wind flow occurs along the body of moving vehicles, producing a drag force and wind profile. According to Nabil et al., 9 an EV’s air resistance at highway speeds could account for up to 48% of the total driving resistance. No matter how efficient a vehicle is, it will still encounter a substantial amount of air resistance. This decreases an EV’s range, which can cause range anxiety – the fear that EVs will not be able to cover long distances without recharging. 10
Thus, this paper aims to utilise this loss to extend the range of the vehicle by mounting micro wind turbines (MWTs) on it as a range extender technology (RET). RET is a revolutionary way to make electric vehicles more efficient and extend their range. 11 This RET can offer numerous benefits:
1. It can increase the range of EVs by providing supplementary power, which allows the vehicle to travel further on a single charge. This is especially beneficial for vehicles that are used for long-distance travel or in areas with limited charging infrastructure.
2. It can help reduce emissions from EVs by supplementing their batteries with clean energy from the wind. This also helps to lower the cost of electricity used to charge EVs and reduces reliance on traditional fossil fuel sources for transportation energy needs.
All these clean and sustainable benefits could solve the environmental and economic problems facing the transportation industry.
MWTs mounted on the car are not a particularly recent invention. Marano 12 described the idea as a device to electrically power a motor vehicle utilising wind turbine technology. He found that windmills charge and power generators may be applied to charge the car’s electric battery by utilising the electric vehicle’s air resistance.
Mathew, 13 Lee 14 and Awal et al., 15 they all reported that the use of appropriate wind turbines could help generate the energy to corroborate electricity demands in vehicles. Additional devices cause the additional of air drag and fuel consumption but the appropriate location of MWT still augmenting vehicle performance.
Kazraji et al. 16 present a RET design for an EV with a roof-mounted wind turbine, which consists of a fixed-pitch wind turbine, a permanent-magnet (PM) generator, a rectifier, a direct current (DC) converter, a battery module and a DC load. Moreover, Figure 1 shows a simple wind-powered electric generator by Marano, 12 in which an MWT was installed behind the grill of the engine partition to generate electricity in real-time, reducing the need for charging time using a plugged-in charging system. The following sections describe the previous work done on the mathematical modelling of EV components and MWTs.
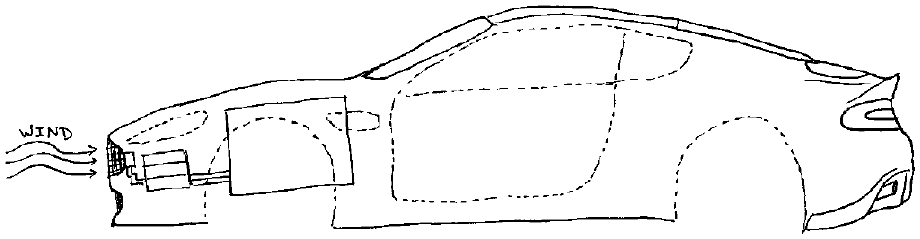
The concept of a wind-powered vehicle turbine developed by Marano. 12
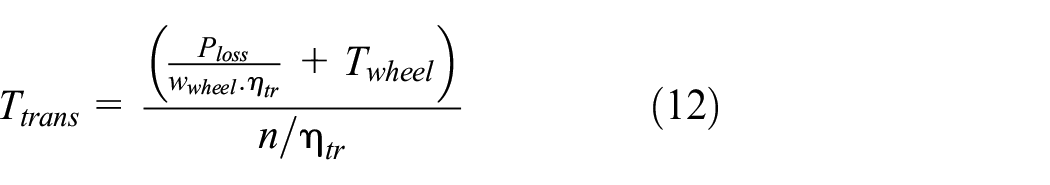
In the mathematical modelling of electric vehicles, Guzzella and Amstutz 17 introduced a general vehicle’s fundamental dynamics that were originally found by Lekshmi and Lal Priya and Lal 18 and called the Quasi-Static Simulation Toolbox (QSS-TB), which is a MATLAB toolbox developed at ETH Zürich. Elgowainy 19 used physics fundamental principles in modelling the dynamic behaviour of vehicles. This provides designers with various models to simulate various aspects of EVs. 20 According to Irani, 21 the QSS-TB can be used to model various aspects of vehicle performance, identify trade-offs between different aspects and explore the impacts of different decisions on vehicle cost, performance, energy efficiency and emissions. On the other hand, it also has the capability of modelling for regenerative braking and traction control, simulating battery life, estimating battery charging requirements, modelling electrical networks, estimating battery heating, modelling power losses in digital circuits and estimating regenerative braking power generation demands. The vehicle can be modelled in detail as a kinematic model, using Newton’s second law as the main criteria. There are many modelling methods, as follows. The four-wheel-drive planar dynamic model considers longitudinal and lateral dynamics, as Suh et al. 22 reported. The six degrees of freedom (DOF) to each of the vehicle rigid-body components, as Lekshmi and Lal Priya and Lal 18 have considered. The intermediate multi-body model uses the Newton–Euler formulation to study the vehicle’s 14 DOF model, as Jaiswal et al. 23 reported. Also, one of the most critical sections to be modelled mathematically is the transmission, which is presented in terms of transmitted torque Tw, the power source torque output Tp, drive-line efficiency.
After the wheel tyres are modelled, the most decisive criteria is the piecewise linear tyre model, which uses few coefficients. 24 According to Lekshmi and Lal Priya and Lal, 18 the regenerative braking system used in EVs contributes positively to the vehicle’s energy efficiency.
A novel regenerative braking control strategy for optimal braking torque distribution between electrical and frictional braking has been discussed for its safety and energy recovery efficiency, as reported by Xu et al. 25 A proper battery model’s behaviour is significant in the simulation study and analysis or design of EVs’ control strategies. One of the easiest-to-use battery models used for dynamic simulation software is presented in Ye et al. 26 This simple model requires only the battery state-of-charge (SOC) variable, thus simplifying the algebraic solution. Lekshmi and Lal Priya and Lal 18 reported that an electric motor and generator could be simplified to a model using the characteristic equation with their inputs consisting of the demanded torque values at the rotational speed. The output is the required electric power. The characteristics of electric motors may be directly inserted into the model since they do not contain any singularities as found in Guzzella and Amstutz’s 17 work. To complete the scenario, drive cycles are used in vehicle simulations to model the drive system and predict the drive system’s performance. A driving cycle can include frequent speed changes or extended periods at a constant speed.
The battery is a key component of the EV, determining its range, charging time and energy efficiency. Understanding the battery performance is important for designing a successful EV, as mentioned by Rezvanizaniani et al. 27
The drive cycle is the most important component of the model when using QSS model, according to Zhao et al. 28 The standard drive cycle comprises a set of speed, acceleration, time and elevation profiles. The amount of power required by the vehicle is calculated using these acceleration and velocity values. It can help electrical vehicle designers explore different driving cycle profiles for the battery pack and parametric settings for the battery cell chemistry. As Tomar et al. 20 reported, the QSS toolbox can simulate the electric vehicle’s battery consumption in different driving cycles.
As stated by Zhagn et al., 29 the reduction in drag, in general, has become a significant issue for automakers in the last two decades because of environmental protection agency regulations aimed at reducing greenhouse gas emissions, as well as customer demand for fuel-efficient vehicles. According to Barnard 8 and Hucho and Sovran 30 research on the significant effect of aerodynamic forces (drag force), about 30%–50% of fuel energy is lost as a result of aerodynamic forces. Hassan et al. 31 carried out several studies and found that the battery pack’s vehicle weight and size significantly impact the range.
Furthermore, according to Barnard, 8 the driving style also has a significant impact on the range. When traffic is available, it is preferable to coast rather than use recuperation braking. He also looked at situations where the speed is rarely over 50 km/h, and the aerodynamic drag coefficient has little effect on the range. Choi et al. 32 proposed a number of drag-reduction techniques, including changing the underbody shape and redirecting exhaust gas to the vehicle’s rear. As a result, exhaust gas redirection reduced drag by up to 9%, and underbody modification techniques reduced drag by up to 22%. Additionally, they discovered that when travelling at 105 km/h, the aerodynamic load accounts for at least 21% of the fuel consumption of the trailer. According to Jadhav and Chorage and Rashmi, 33 the drag is not much of a factor when travelling at low speeds because it has no effect on the fuel or energy buffer. However, when travelling at high speeds, atmospheric air applies pressure to the body of the vehicle.
On the other hand, the vehicle tries to shear the air above the body. According to Elger et al., 34 there are two primary types of drag forces: friction drag connected to the viscous shear-stress distribution and form drag, which depends on geometry and pressure difference. For an EV, Chellaswamy et al. 35 developed a recharging mechanism based on renewable energy sources (both solar and wind). They have simulated the model using MATLAB-Simulink to verify the performance of the solar PV model and the wind turbine. They have stated that the aerodynamics aspect will be one of their focusing points in future, but they have not considered it in their works.
The lost drag utilisation on the car is rarely or never been searched for, as most of the published work concentrates on reducing the drag coefficient or simulating the problem without considering the aerodynamics of the vehicle. It can be concluded from the previous work in the open literature how the area of the micro wind turbines is being confined and not well discussed. However, there are many mathematical models of wind turbines and electric vehicles, but no combined mathematical model has been built and simulated for both systems, the micro wind turbine and electric vehicles. Therefore, this work aims to build a combined mathematical model for both electric vehicles and micro wind turbine and describe the amount of drag lost energy that can be utilised in many driving cycles scenarios.
Methodology
The main purpose of the conducted work is to study the effectiveness of installing MWTs RET on a sample vehicle, which is the Kia Soul Electric 2018 in our case. The vehicle employs an electrical induction motor and is entirely powered by electricity. To provide the most accurate results, the Simulink model considers numerous factors. The given parameters of the vehicle have been implemented in the model to make sure that the driving range and efficiency are similar to what have been issued by the official manufacturer website. The drag utilisation model has been added to the main model to compare the performance of the vehicle in both cases before and after adding the MWTs model. The first step is to build a detailed Simulink model using the QSS toolbox. The model takes into consideration most of the influencing factors for the electric vehicle. Starting with the driving cycle as the input and ending with the vehicle range and energy consumption, the transmission, drag, gravitational, electrical motor and battery losses have been calculated to make the results as accurate as possible.
The vehicle’s frontal area must be quite significant to consider that the MWTs may have the front bumper as the best place to be installed. After comparing the model results with the official vehicle performance values, the model have been verified, and the drag energy utilisation model has been added.
The calculated drag force is the pressure drag only, without considering the surface resistance drag. That is assumed due to the dominance of the pressure drag at low speeds and the high complexity of the surface resistance calculation. The expected percentage of the drag energy that can be utilised has been approximated as follows: the utilisation factor equals the area of the wind turbine that can be utilised over the total frontal area of the vehicle times the Betz Limit of the wind turbine. The generative braking has been calculated and treated as the wind turbine energy with four scenarios: first, the vehicle’s efficiency without any range extender; second, the vehicle’s efficiency after adding the MWTs energy; third, the vehicle’s efficiency after adding the generative braking energy; and fourth, the vehicle’s efficiency after adding both systems energies. Figure 2 sums up the methodology and the steps of the presented work.

Flow chart of the work methodology.
The selection of MWTs has been done based on the numerical shape optimisation that has been done to figure out the most suitable blade design using the given driving cycle parameters. Following an intensive study on five different airfoil sections and the number of blades, the highest-performance wind turbine shape was modelled using CAD tools and placed on the frontal bumper of the car, as shown in Figure 3, in accordance with the recommendations of Jadhav and Chorage, 33 where they mentioned the effect of placing the wind turbine in various places and showed how the frontal bumper is the best in terms of aerodynamics performance, as shown in Table 1.

The real 2018 Kia Soul EV 44 versus the concept 2018 Kia Soul EV with MWTs on its front bumper.
Drag coefficient of car model with different wind turbine position. 33

However, the method of installing the MWTs has not been discussed in this work, and it can be investigated in the future using CFD numerical modelling or experimental work.
Based on the estimations of the numerical analysis performed by the numerical blade element momentum solver Qblade, the best wind turbine, in this case, is the horizontal axis 7-blade configuration with a twisted large tip that uses SG6043 airfoils. SG6043 profile gives the maximum lift-to-drag ratio value for an angle of attack 5°–9°. The experiment conducted by Chaudhary and Prakash 36 demonstrated the accuracy of the Qblade estimation. Under small wind tunnel settings, this experiment determined that a 7-blade configuration with SG6043 airfoils provides the optimal power coefficient of 0.455. The selection of SG6043 was also recommended by Shin and Kim’s 37 findings. Chen and Hung38,39 also proposed the concept of a MWT suitable for a moving vehicle while experimenting with a 300 mm 6-blade wind turbine.
Each wind turbine’s average power at the operating speed of the driving cycle is 126.32 W, which adds up to almost 20% of the total drag energy lost during the driving cycles if we assume that three wind turbines will be mounted. This percentage is referred to as the utilisation factor, and it equals the area of the wind turbine that can be utilised relative to the total frontal area of the vehicle multiplied by the Betz Limit of the wind turbine.40–42 The area of three MWT is 0.145 m2 and the frontal area of the EV is about 2.5 m2. Using 0.4 as the Betz limit of the MWT, the utilisation factor is 0.022, which can be rounded to 0.02 (20%). This percentage has been implemented in the Simulink model to simplify the whole energy extraction process, as discussed in the Numerical analysis section.
This MWTs RET system can be equipped with a permanent magnet generator (PMG), as reported by Refs.15,16 The generator characteristics are shown in Table 2. The use of PMG, with a high-power density, high efficiency 85% and less maintenance compared to other types, allows the turbine to effectively convert wind energy into electrical energy to charge the EV battery and extend its range. 43
Generator characteristics.

The electric vehicle’s performance in a variety of driving cycles and conditions has been simulated using these parameters and specifications as input to a Real Time Simulation Model, as shown in Table 3.

Figure 4 illustrates the proposed design for the KIA Soul Electric with MWTs RET mounted to the front bumper. The design comprises EV power inputs from a charging point, regenerative braking and MWTs RET. The EV model clarifies the power flow of the power inputs. The MWT design consists of a generator and controller connected to the battery of the EV power system. The MWT + EV model’s 2D diagram clearly illustrates the power flow, making it simpler to comprehend the overall design.

Battery charging power flow diagram.
Numerical analysis
Driving cycle
Different driving cycles are used in the model to simulate different types of real-world driving conditions. These include the New European Driving Cycle (NEDC), the Standardised Random Test Aggressive Driving Style (RTS 95) and the Federal Test Procedure (FTP_Highway). The NEDC is used to measure fuel consumption, emissions and performance of vehicles under normal urban and suburban driving conditions. RTS 95 assesses a vehicle’s performance under aggressive driving style conditions such as sudden acceleration or braking. Finally, FTP_Highway measures a vehicle’s performance while travelling on highways at high speeds. 46 Each of these cycles has its own unique features, such as varying speeds, acceleration rates and stop-and-go patterns. The data for these cycles were taken from Dieselnet. 47
The velocity profiles for these cycles are shown in Figure 5. The NEDC velocity profile is low and steady, with some regular acceleration stops due to the nature of traffic-heavy cities. Its top speed is approximately 70 km/h, but most peaks reach 50 km/h. Similar to NEDC, RTS 95 has a low and steady speed at the peaks, reaching 58 km/h, but is a more aggressive driving cycle that includes sharp accelerations and higher speeds than the NEDC. Lastly, FTP_Highway has the highest average speed among these three cycles and features longer stretches of accelerating and decelerating. The velocity profile for FTP_Highway begins with a period of low speed, followed by a series of accelerations to higher speeds, reaching 85.4 km/h, and then a period of semi-steady state cruising speed.
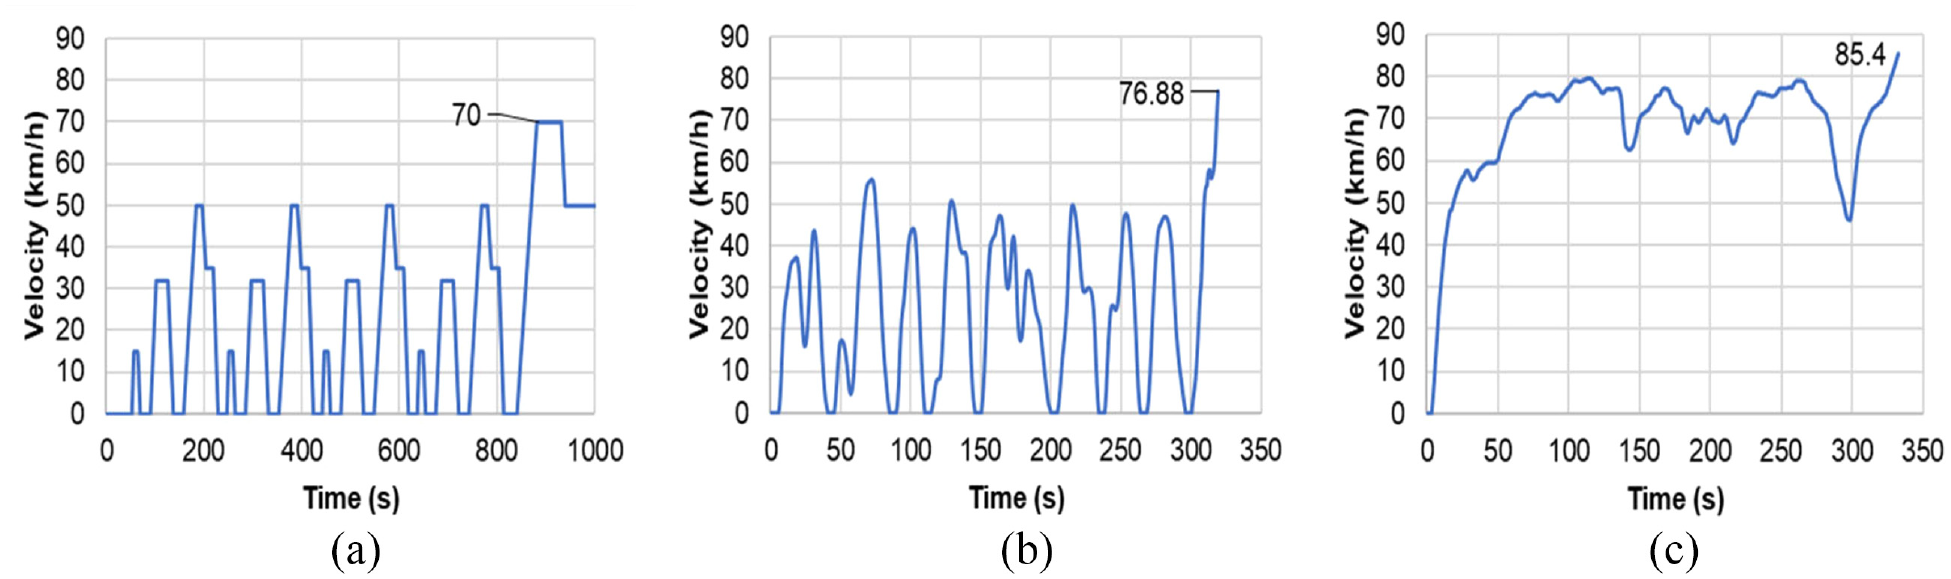
Driving cycle velocity profile: (a) NEDC, (b) RTS 95 and (c) FTP_Highway.
Regarding the FTP_Highway driving cycle, the majority of drivers are aware that their vehicles consume less energy on the Highway than in the city, and this is partially true. However, long Highway driving with minimal braking can be detrimental to EVs, as EVs benefit from the regenerative braking feature, which increases their range. However, this feature is lost with minimal braking. Also, given that this cycle requires a long drive distance and high speed, which is another risk for EVs (consuming a significant amount of power). It is necessary to study the impact of the drag force, which is proportional to the vehicle’s speed squared. This force can be utilised to extend the range of the vehicle using suitable RET, which is MWTs.
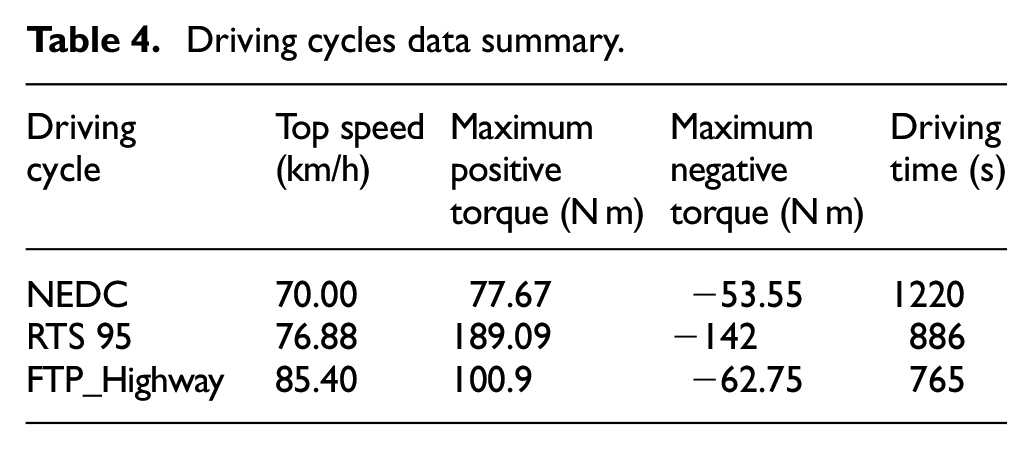
The driving cycle information is summarised in Table 4. The full range of these data on driving cycles will serve as the input for the vehicle model.
Driving cycles data summary.
A fundamental kinematic and kinetic model
The kinematic model which is a simplified model that is easier to use and provides an approximation of the vehicle’s motion have been, while the kinetic model is a more accurate model that takes into account the forces that cause the motion. The inputs to the kinematic and kinetic models are presented in Table 5. The system of the car experiences a number of forces acting on it, and as a result, Newton’s second law is put into use.
Kinematic and kinetic model inputs.

The car has a variety of acting forces when it is modelled, as shown in Figure 6. The forward tractive effort

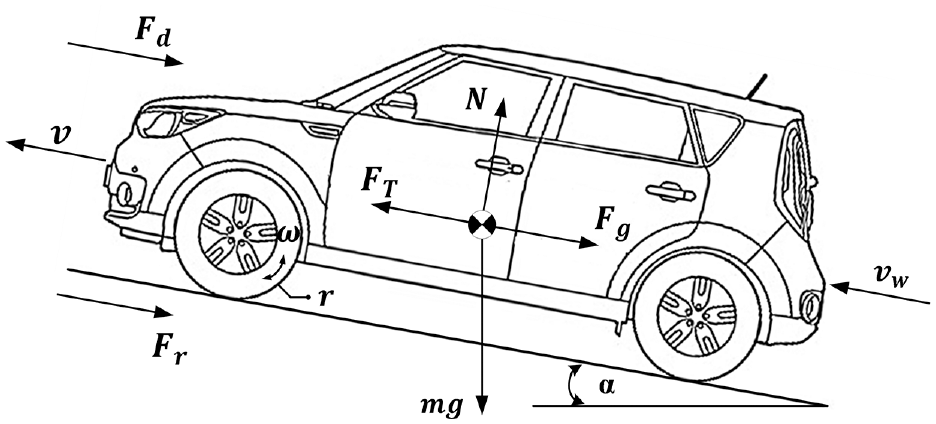
2018 Kia Soul Electric free body diagram.
Rolling resistance
The force


Where m denotes the mass of the object and g denotes the gravitational acceleration (9.81 m/s). The result of a sloping road is denoted by the Greek letter cos (
The switch controller had been used to select if the car is either stand still or not, where the average velocity of the car is the threshold used in the criteria. In our case, we assume that the vehicle is at a standstill instantaneously.
Grading force
The angle of the road has an impact on the gravitational force. The force is positive when moving up a grade and negative when moving down one.

Where
Aerodynamic drag force

Where A is the equivalent frontal area of the vehicle,
Traction force
To overcome the load of the road, the electric motor in an EV generates traction force between the tyres and the pavement (parallel to the road). Husain 48 provides the equation of motion in the tangential direction.

Husain 48 states that the characteristic values of km range from 1.08 to 1.1 and that it has no dimensions.
Simple wheel model
The following mathematical models used depend on the car’s wheel’s diameter to convert the car’s travel velocity into the wheels’ rotational velocity in order to know the driving axils speed.


Where v is the vehicle velocity, and
Simple transmission model
Since an intricate gearbox is not required, it is clear from the mathematical model that this is one of the key characteristics of electric cars. It is still a gearbox with a single gear ratio, but it is lighter, cheaper and more clearly represented. The gearbox is represented as shown by using some kinematics formulae.

Conversion efficiency and gearbox loss are roughly taken into account to improve the mathematical model’s accuracy and approximate the outcomes of reality. Considered are two possibilities:
a. Engine energy exceeds wheel energy (the engine drives the car).
The mathematical formula in this instance is provided by. 48

b. Wheel energy is higher than engine energy (the car is coasting)
In this case, the mathematical formula is:
Energy converter (electric motor)
The emphasis must be on the electric motor’s mechanical performance because it was selected to meet the project’s requirements. As a result, the model’s input is the actual motor power because the motor’s equations are applied from a mechanical perspective.


Where
To maintain the reality of the results, it is necessary to take the electrical motor’s maximum speed and torque and stop the system if these values are exceeded by the driving cycle. Therefore, the following logical operation must be used:
If [Tmax − Tem < 0], then stop the system.
If [Wem_max − Wem < 0], then stop the system.
Energy converter (regenerative braking)
By using the braking energy to charge the battery, regenerative braking helps a vehicle’s range. Regenerative braking uses the motor as a generator, returning energy to the battery as a result of the vehicle’s inertia and power electronic converters. Joseph Godfrey and Sankaranarayanan 49 studies have shown that regenerative braking can extend a vehicle’s range by 8%–25%. According to Pan et al., 50 there are numerous velocity decrement regions throughout the driving cycle, which necessitate coasting or braking the vehicle. The negative acceleration that occurs during the driving cycle produces negative torque, allowing the vehicle to use its electric generator as a range extender.


The generation efficiency, which depends on the torque and angular velocity, is represented by
Battery
Because it is necessary to take into account the battery loss that varies with charge percentage, the battery may be the most challenging component of the mathematical model. The mathematical model for the battery aims to produce three outputs as a final output: These are (a) power consumption, (b) battery voltage and (c) battery charge state.
Energy consumption
Equations from (20) to (27) are based on the work done by Husain 48 :


Battery voltage


Battery state of charge

Where
Overall efficiency
According to equation (32), the overall efficiency of the vehicle is equal to the output power divided by the input power. The energy consumed by the wheel divided by the energy consumed by the electric motor during the driving cycle provides another form that is compatible with the previous mathematical model. Based on the following formulae, the mathematical model can be simulated.

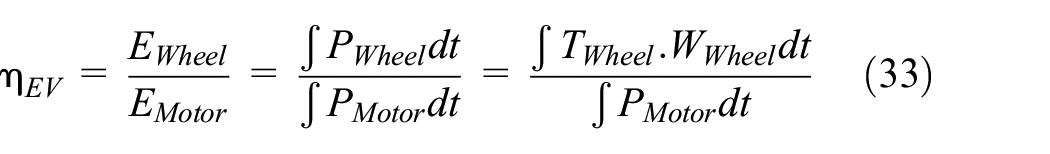
Where
It can be seen from Figure 7 that the efficiency was calculated after adding the regenerative breaking produced energy, and compared the total energy consumption with and without considering the regenerative braking effects.


Vehicle efficiency.
Where
Figure 7 represents the vehicle efficiency Simulink subsystem. The input is the torque of the gearbox. Dividing the resulting value by the energy consumed by the electric motor will give the vehicle overall efficiency as an output. This efficiency can be considered as the overall efficiency of the vehicle.
Figure 8 shows the Simulink subsystem that isolates the energy generated during the cycle from the regenerative braking and determines its effect on the vehicle’s overall efficiency. As shown in the figure, the amount of energy generated from the vehicle coasting scenario, which has been calculated separately in other subsystems shown in Figure 9 using the negative torque values, has been added to the total energy consumed by the vehicle the divided by the energy consumed by the electric motor. This leads to an increase in the overall vehicle efficiency, and that amount of increase is related to regenerative braking. Adding such a subsystem is beneficial in investigating the main secondary energy contributor in each driving scenario and comparing the value of the wind energy produced to its regenerative braking.

Effect of regenerative braking model.

Energy consumption with regenerative breaking model.
The additional energy savings offered by the regenerative braking system have an impact on the total energy consumption in (kWh/100 km), which is modelled as shown in Figure 9:

By differentiating the power of the generator P_EG that is assumed to be working with negative acceleration periods. The amount of energy produced during the cycle can be obtained by dividing the resulting value by the total distance. Subtracting this value from the energy consumed by the battery ensures that the new variable is called energy.Cons.with.Reg represents the amount of energy consumed after adding the contribution of the regenerative braking.
Vehicle model verification
Based on the previous models provided by the QSS toolbox, 17 the final vehicle is modelled, as depicted in Figure 10. The parameters can be estimated and optimised to calculate the vehicle’s energy consumption.

Vehicle model.
The vehicle model illustrates how each subsystem is interconnected, starting with the driving cycle as an input before moving on to the vehicle model to calculate drag, gravitational and friction forces. Next, the wheel model converts the vehicle’s linear velocity, acceleration and forces into angular or rotational velocity, acceleration and torque. The transmission model, which takes into account the gear ratio and transmission losses, uses the wheel model’s outputs as an input. Using the efficiency map carried out in the EM Assignment model, the amount of energy lost on the electric induction motor has been calculated using those values, which represent the electric motor’s output. The battery model gets to the final subsystem, which represents the actual final amount of energy that the customer must pay for. To ensure the values are as accurate as possible, the drop voltage and the state of charge factor have been taken into account.
Real-time simulation results
A comparison study between real vehicle specifications as shown in Table 6 and modelling has been done, and the results are presented in Table 7. Two driving scenarios have been implemented to compare car performance in both cases and validate the real-time model compared to official vehicle performance. The city’s energy consumption is 15 kWh/100 km as declared by the company, whereby it is 15.25 in the MATLAB model, which indicates a 1.66% relative error. The error is higher in highway driving, where 20.1 kWh/100 km is the predicted value from the official company, and it is 19.84 from the MATLAB model. That means 5.04% relative error. The values predicted by the model indicate a small error, which validates the model and makes it reliable on the following calculation stages.

MATLAB model results with various driving cycles.

The vehicle uses the least amount of regenerative braking energy during highway driving cycles, where the efficiency increase is the smallest compared to other scenarios, as is evident from Table 3. To determine the cycle in which drag analysis can be most effectively used, the drag analysis must be applied to all three cycles.
Drag utilisation analysis
As mentioned in the literature, the drag force significantly influences fuel consumption at high speed, reaching about 22% of the total fuel consumption. As known and mentioned before in electric vehicles, the main interest is about the vehicle’s range or the total distance that the vehicle can cruise with one charge, so any limitation losses must be considered and tried to reduce to improve the ranging performance of the vehicle. One of this research’s main objectives is to study the micro wind turbine technology’s ability and effectiveness as a range extender in the electric vehicle.
The following formula is used to determine the total energy used during the driving cycle due to aerodynamic resistance based on the previous mathematical Simulink model.

There is no way to use all of the drag energy. However, the previous model, which used some estimated parameters based on the Kia website, illustrates that. With a drag coefficient of 0.35, the electric car uses a total of 3656 kJ of battery power during a driving cycle, with 1236 kJ of that energy coming from drag resistance, or about 33.8% of the total energy used by the car under Highway driving conditions, as shown in Figure 11.
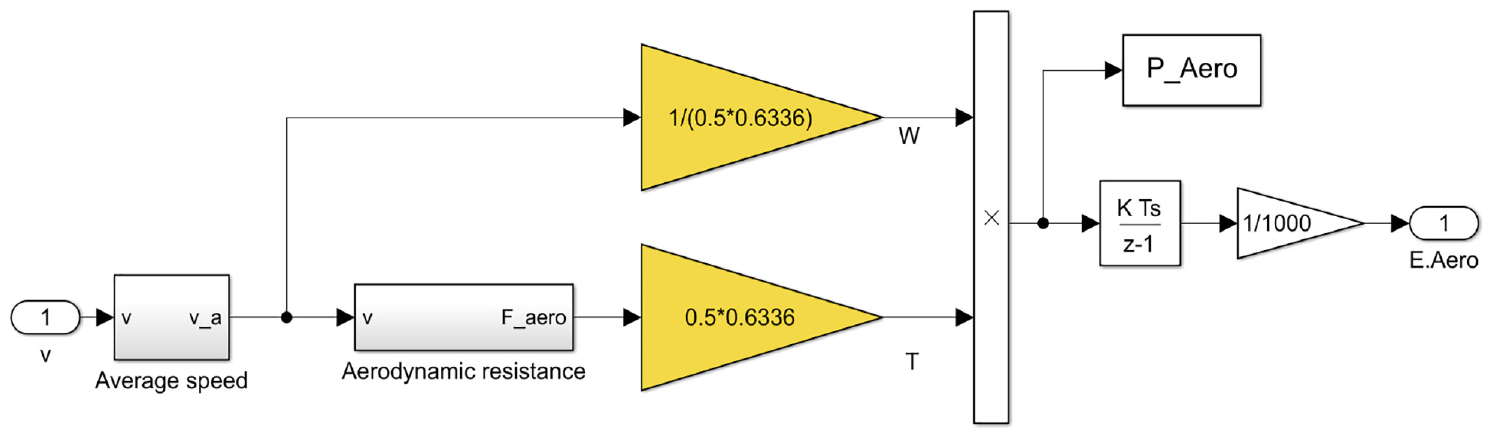
Drag energy model (under the model mask).
The average velocity of the vehicle is used as an input for the Aerodynamic resistance submodel where the drag force is calculated, multiplying the force with the wheel radius, the force value can be converted into torque value which is multiplied by the angular velocity of the wheel to produce the amount of power at each interval of the cycle. By integrating these power values, the total energy consumed to overcome the Aerodynamic resistance can be estimated, as shown in Figure 11.
The previous model is named Drag Energy Analysis. Its final output is the energy consumed due to the aerodynamics resistance and the energy consumed due to the rolling or friction resistance, as shown in Figure 12.

Drag energy model (over the model mask).
Drag energy consumption and overall efficiency analysis
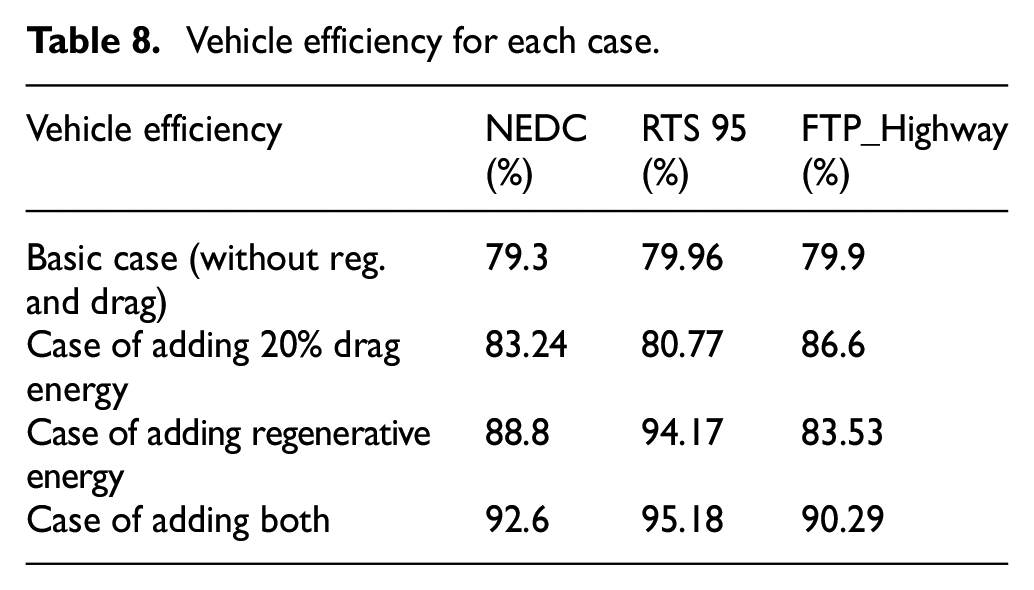
The car’s overall effectiveness is calculated to be 79.9% by using the parameters from the official Kia website and implementing them in the Simulink model with the Highway driving cycle and running the efficiencies model, as shown in Figure 13 and Figure 14. The efficiency is 83.53% when the energy generated by regenerative braking is added. Only 20% of the available drag energy results in an increase in efficiency to 86.6%. This figure illustrates how adding both regenerative and drag energy resulted in a vehicle efficiency of 90.29%, which is 10.31% higher than the base one.

Efficiencies model.

Vehicle efficiency for each case.
The Simulink subsystem details of the overall effectiveness of each case are shown in Figure 15. The aerodynamic resistance power at each interval has been multiplied by 0.2, which represents the system’s estimated overall efficiency. After adding the contribution of the used aerodynamic resistance energy, the energy result is subtracted from the battery energy to get the new consumption value. The same process has been applied to other cases involving both aerodynamics and regenerative braking as well as the regenerative braking case.

Range extender analysis under the model mask.
Range analysis
The drag power used can be calculated by multiplying the Betz factor (0.59) by the maximum projection area that can be used (0.80 m2). Multiplying both results in a factor of 0.2, which indicates that 20% of the drag energy can be utilised in the best-case scenario if discretely integrated and converted to kWh/100 km, as shown in Figure 15. Figure 16 depicts the drag and regeneratively generated energy by subtracting this value from the total vehicle consumption and then repeating the procedure for regenerative braking.
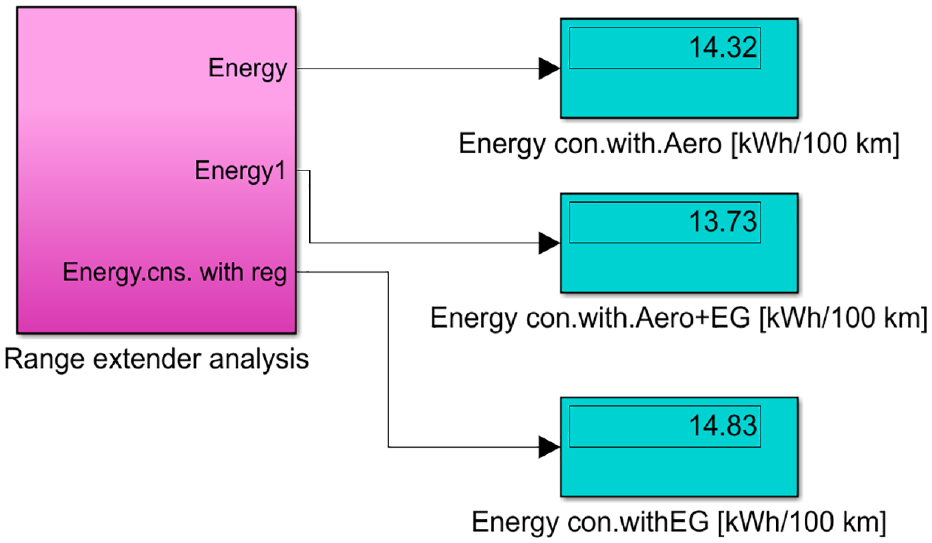
Range extender analysis.
According to Table 7, the overall energy consumption rate is 15.42 kWh/100 km. With drag utilisation, the energy consumption rate is 14.32 kWh/100 km, and with regenerative braking, it is 14.83 kWh/100 km. Figure 16 illustrates how the energy consumption rate is decreased to 13.73 kWh/100 km by combining the two.
Analytical results
Table 8 summarises the energy consumption rate and efficiency of the vehicle for each driving cycle simulated in each scenario, based on the analytical results. The results shows that the Highway driving cycle has the highest efficiency growth. Before and after using the drag energy, the efficiency rises by 6.7%, taking into account that this efficiency can be achieved after one complete driving cycle (765 s for the FTP_Highway case). Considering the regenerative energy contributing the least in this situation, taking into. However, generative braking makes a significant contribution at the NEDC and RTS95 cycles, where it boosts efficiency by 9.5% and 14.21%, respectively.
Vehicle efficiency for each case.
NEDC simulation results
The efficiency for the NEDC driving cycle increases from 79.3% in the base case to 83.24% when a 20% fraction of the lost drag energy is added. Compared to MWTs, regenerative braking increases efficiency by a factor greater than twofold. Based on the frequency of negative acceleration regions, or driving conditions where the vehicle coasts.
RTS95 simulation results
In the case of the RTS 95 driving cycle, which is considered an aggressive driving situation cycle, the effect of MWTs is very small and can be neglected at all compared to the amount of regenerative braking energy produced during the cycle. That is expected due to the amount of negative acceleration that occupies more than 50% of the overall acceleration region.
FTP-highway simulation results
The amount of drag energy that can be utilised in the FTP-Highway driving cycle is way more than the regenerative braking energy produced during the cycle. The vehicle efficiency increased from 79.9% to 86.6% in the case of adding 20% of the drag lost energy while only a 3.6% efficiency increment occurred when the regenerative braking energy is added.
Efficiency analysis results and range extender analysis
Table 9 shows how wind energy utilisation on highways can improve a vehicle’s overall efficiency across all driving conditions. At the Highway driving cycle, the contribution of the drag energy utilisation assumption is higher than regenerative braking.
Efficiency range extender analysis results.
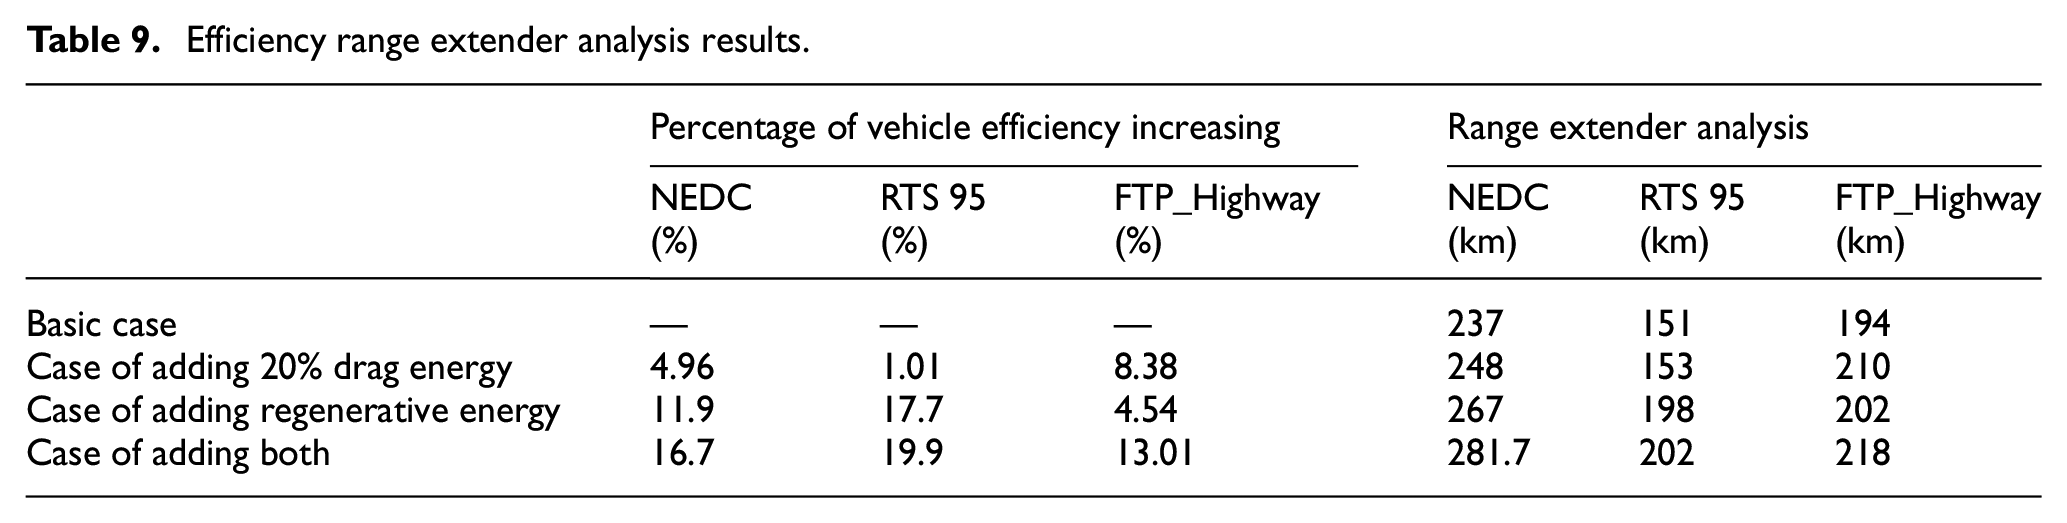
Table 9 demonstrates the best ways to use drag energy during the Highway driving cycle, where vehicle velocity is always high and generative braking energy is at its lowest level. As a result, it is possible to generate energy in all circumstances and reap the benefits of all driving scenarios.
Range is important for electric vehicles as it determines the distance that the vehicle can travel on a single charge. In this case, the range increases by 16, 11 and 2 km when adding 20% drag energy to the FTP_Highway, NEDC and RTS 95 driving cycles respectively. Regarding this case of using 20% drag energy:
FTP_Highway driving cycle is the best among the three as it represents the highest increase in range (16 km). This is likely due to the higher speed and less frequent stop-and-go conditions of highway driving compared to the other two cycles, which allows for more efficient use of drag energy.
NEDC driving cycle is also beneficial, although it is lower than the FTP_Highway driving cycle. This could be due to the more urban nature of NEDC driving cycle, which includes more stop-and-go conditions and lower average speeds, leading to less efficient use of drag energy.
RTS 95 driving cycle is relatively low compared to the other two cycles, and could be due to the more aggressive driving conditions of RTS 95, which may not be as conducive to the efficient use of drag energy.
Table 10 shows the efficiency and range extender values after taking into account the efficiency of the electrical generator connected to the MWTs. It can be noticed how the percentage of increasing in the efficiency is less in that case and so for the range extended. According to the listed data, the vehicle’s range has increased as a result of ‘adding 20% drag energy’ as follows: 9.7 km at NEDC case, 1.9 km for the RTS 95 case and 13.2 km for the FTP_Highway driving cycle case.
Efficiency range extender analysis results taking into account the electrical generator efficiency (85%).

Figure 17 represents the values from Table 9 to make the comparison easier. It can be seen that the range values change primarily in FTP_Highway from the first to the second case, with almost no changes in other cycles. That ensures the positive effect of the MWTs system in highway driving scenarios. The regenerative braking effect is dominant in the harsh driving scenarios, as shown in the RTS 95 cycle, where the range increases sharply between the second and third cases where the generative braking is added. That is expected due to the deceleration regions where the torque values are negative and the vehicle motor works as a generator most of the time.

Vehicle range simulation results.
The findings are within the range of the work conducted by Puma-Benavides et al. 10 . The MWT added to a vehicle with a system power of 2.64 kW has been tested to give an extra range of up to 10% and increase the efficiency of the vehicle while driving in a normal city driving scenario. According to Fathabad, 54 using a 1.1 kW micro wind turbine system can increase the range of the vehicle by 7.27 km from the original range of the tested vehicle, which is 110 km for the full charge, which means that the range is extended by 6.6%. The proposed model shows that the sample vehicle can achieve an 6.8% range extension (from 194 to 207.2 km) if the MWTs RET with a generator efficiency of 85% is used, which is suitable for a Highway driving cycle scenario. This seems reasonable and testable in comparison to the previous experimental work.
The results show that MWTs can be used to charge EVs, but their cut-off speed, rated speed and vehicle speed make this process complicated. A wind turbine charger controller is the key to managing these variables successfully, as shown in Figure 4. This device works by regulating the voltage output of the turbine and adjusting it for optimal charging. It monitors the current and adjusts it to get the maximum amount of power from the wind. Additionally, it ensures that the voltage output from the turbine never exceeds a certain level so that it does not damage any components in the EV. Finally, it helps maintain a steady output even when wind speeds fluctuate, so that the EV stays charged without any interruptions.
Conclusion
This study investigated the potential of horizontal micro wind turbines (MWTs) to function as range extender technology (RET) for electric vehicles using real-time analytical simulation with multiple driving cycles, namely FTP_Highway, NEDC and RTS, under four main scenarios (cases): the basic case, the case of adding 20% drag energy, the case of adding regenerative energy and the case of adding both. A detailed mathematical model was developed in order to perform the simulation on a fully electric vehicle (Kia Soul Electric 2018) while considering all the aspects of the vehicle, including its kinematic-kinetic model, wheel model, transmission model, energy converter (motor and regenerative braking) model and battery model. This model was used to extract results after applying the scenarios to different driving cycles. The main outcomes of these actions are outlined below:
a. FTP_Highway driving cycle has the most significant drag energy and lowest regenerative braking production due to the high operation velocities.
b. The proposed model demonstrates that, for a Highway driving cycle scenario, the sample vehicle can achieve a 6.8% range extension (from 194 to 207.2 km) by employing the MWTs RET with a generator efficiency of 85% as a result of ‘20% energy harvesting from wind drag force drag energy’.
These outcomes demonstrate the effectiveness of MWTs in extending the range of EVs by supplementing their power sources. Vehicles on the highways will benefit the most from this RET. Adding clean energy from the wind generated by MWTs to the batteries of EVs can help reduce emissions. Also, this decreases the need for electricity generated from fossil fuels, which helps to bring down the cost of charging electric vehicles. Thus, the environmental and economic issues plaguing the transportation sector could be resolved by MWTs, thanks to all the benefits they provide in terms of being clean and sustainable.
Footnotes
Appendix
Overall input data.

| 2018 Kia Soul Electric parameters and specifications | ||
| Power source type | Fully electric vehicle | |
| Vehicle mass (kg) | 1587.57 | |
| Vehicle cross-section (m2) | 2.88 | |
| Vehicle projection area (m2) | 2.44 | |
| Drag coefficient | 0.35 | |
| Rolling resistance coefficient | 0.01 | |
| Wheel diameter (m) | 0.6336 | |
| Gear ratio | 8.206 | |
| Electric motor power (kW) | 81.4 | |
| Battery capacity (kWh) | 30 | |
| Battery capacity (Ah) | 45 | |
| Number of cells | 200 | |
| MWT generator characteristics | ||
| Generator type | Permanent magnet generator | |
| Output voltage | 180 VDC | |
| Current output | 7.5 A | |
| Rated speed | 5000 rpm | |
| Maximum output | 1 hp | |
| Efficiency | 85% | |
| Driving cycles data | ||
| NEDC | Driving time (s) | 1220 |
| RTS 95 | 886 | |
| FTP_Highway | 765 | |
Handling Editor: Chenhui Liang
Declaration of conflicting interests
The author(s) declared no potential conflicts of interest with respect to the research, authorship, and/or publication of this article.
Funding
The author(s) received no financial support for the research, authorship, and/or publication of this article.