
Abstract
To reduce drivers’ cognitive load during the driving process, The present study concentrates on the cognitive evaluation and analysis of the Head-Up Display (HUD) interface layout, aiming to enhance human cognitive efficiency. Initially, a combination of eye-tracking technology and cognitive load theory is used to investigate users’ attention allocation and changes in eye movement indicators, followed by the conversion of these indicators. A comprehensive HUD interface layout evaluation system is established, considering structural layout esthetics, task efficiency, and cognitive load. To achieve this, an intelligent cognitive evaluation method for the automotive HUD interface layout is proposed, based on the Bayesian BWM and Gray-TOPSIS. Bayesian BWM is employed to determine the weights of evaluation indicators, followed by Gray-TOPSIS to assess and rank the layout candidate solutions. Experimental results indicate that in the optimal layout design, users exhibit fewer eye movements, shorter gaze durations, esthetically pleasing interface structures, and lower cognitive loads. Furthermore, comparative experiments validate the effectiveness and stability of the Bayesian BWM and Gray-TOPSIS methods. These findings offer guidance and reference for further optimizing the layout of intelligent automotive HUD interfaces.
Keywords
Introduction
The automobile, as a prominent focus in Internet of Things research and development, is positioned to play a pivotal role in future digital advancements. 1 The increasing number of in-car information displays has, to different extents, consumed the driver’s limited cognitive resources, posing challenges in effective attention allocation between tasks.2,3 Head-Up Display (HUD), serving as a visual aid technology for in-car screens has gained considerable attention in recent years. 4 It is expected to be almost a third of cars equipped with HUD systems by 2024. 5 The design of the HUD affects the allocation of visual and cognitive resources for the driver and thus influences the efficiency with which the driver receives visual information. 6 Nevertheless, the technology-supported HUD display system lacks some studies on the layout of the human-machine interface. As research on HUD interface layout design and evaluation has grown in importance, the requirements for in-vehicle HUDs have expanded to encompass low cognitive load, usability, user-friendliness, and esthetics. Therefore, we need to establish a scientific support mechanism to assess and study HUD interface layouts. The influencing factors of interface layout can be categorized into external factors associated with the driving environment and internal factors related to HUD layout and structure. Choosing HUD layout schemes from diverse samples and ranking them based on these interconnected factors formulates a multi-criteria decision-making (MCDM) problem. Several scholars have already utilized diverse MCDM methods to tackle these issues. Their research focuses on computing metric weights and ranking scheme outcomes. For example, the AHP has been used to calculate metric weights, and a comprehensive evaluation model based on Gray theory has been developed. This model eliminates the arbitrary and subjective aspects associated with the integration of quantitative and qualitative analysis. 7 We propose a comprehensive evaluation method that combines the Spherical SF-AHP and SF-AD methods. The method is used to evaluate HMI alternatives. Potential risks associated with subjectivity are avoided. 8 For ranking solution outcomes, the preferred approach involves MCDM methods based on decision preferences, such as TOPSIS and VIKOR. 9 TOPSIS, widely recognized as a prominent MCDM tool, has gained extensive application owing to its logical transparency, minimal mathematical operations, objective result reflection, and ease of implementation. Simultaneously, the Gray method, introducing Gray relational degree among metrics as a distance measure, better reflects internal variations in each scheme, addressing the limitations of TOPSIS. 10
While AHP is widely used to establish standard weights via standard pairwise comparisons and is integrated with various MCDM methods. The primary issue lies in the lack of consistency in pairwise comparisons. Furthermore, the computation of metric weights relies on an extensive number of standard comparisons, leading to significant disruption of transitivity relationships and increased computational complexity. AHP fails to address the inconsistency issue in group decision-making, resulting in a notable likelihood of information loss during group decision processes. In contrast, the best-worst method (BWM) proposed by Rezaei 11 offers significant advantages. This method comprehensively measures metric weights by conducting pairwise comparisons among indicators. It significantly reduces the necessary comparison data while concurrently improving consistency among the data. Although the BWM has numerous advantages, it faces limitations in consolidating preferences from multiple experts, primarily reflecting individual decision-making. 11 To overcome this, the Bayesian BWM theory has been introduced to calculate standard weights, with the goal of minimizing information loss and effectively capturing group decisions. By incorporating Bayesian principles, the theory calculates weight coefficients for indicators in scenarios involving multiple evaluators. It determines optimal weights for each evaluator and establishes the best comprehensive weight, reflecting the collective preferences of all evaluators. This significantly improves the consistency index of evaluations. By adopting a probabilistic perspective and considering group decision-making, the Bayesian BWM theory enables a thorough evaluation of the entire decision team, leading to more accurate and effective outcomes. 12 Since its inception, the Bayesian BWM has been widely applied across various domains. For example, it has been used to calculate weights for key criteria and rank both public and private universities 13 ; Moreover, Bayesian BWM has been applied to calculate standard weights and rankings for evaluating the performance of mobile business services. 14 Although Bayesian BWM is an effective method for standard weight computation, its application in assessing in-vehicle HUD interfaces has been relatively underexplored. Seamlessly integrating the Gray-TOPSIS methods with Bayesian BWM introduces a novel and innovative approach to assessing intelligent automotive HUD interfaces.
The motivation for this study is as follows:
(1) Considering the many factors that affect the cognitive structure of smart automotive HUD interfaces, this research introduces a new assessment model to guide the evaluation of cognitive structure in smart automotive HUDs.
(2) Unlike traditional TOPSIS, Gray-TOPSIS considers both the positional relationships between data curves and the trend changes in sequences. This allows decision-makers to balance the relationships between different criteria and identify the most optimal and feasible solution. In Gray-TOPSIS, standard weights play a crucial role, determining how alternative solutions are assessment by the performance of every criterion. Typically, these standard values are arrived at using methods such as AHP, BWM, and Bayesian BWM.
(3) As contrasted with AHP, Bayesian BWM proves to be an effective MCDM approach for evaluating standard weights. It requires fewer comparisons between evaluation criteria, simplifying the calculation process and yielding more consistent results. Unlike BWM, Bayesian BWM gives enhanced consideration to decision experts’ preferences regarding criteria analysis. In addition, it can be integrated easily with other MCDM tools and is easy to compute and understand. These advantages position Bayesian BWM as a great way easily combinable with other MCDM approaches. Despite these findings, Bayesian BWM is rarely applied in the context of user interface evaluation, particularly in the realm of cognitive assessment of interface layouts. Therefore, we apply the framework of Bayesian BWM and Gray-TOPSIS to address a real case in the cognitive assessment of intelligent automotive HUD layouts.
In summary, we propose a novel systematic approach to evaluate intelligent automotive HUD layouts, addressing the subjective impact and aiming for comprehensive and accurate cognitive assessments. This method, based on Bayesian BWM and Gray-TOPSIS, is introduced for the first time in this field. Initially, we define new evaluation criteria grounded in the cognitive load and drivers’ requirements while using HUD. Subsequently, Bayesian BWM assigns weights to each criterion, and Gray-TOPSIS ranks alternative HUD interface layout schemes. This approach, anchored in Bayesian BWM and Gray-TOPSIS, yields more precise and objective data for assessing intelligent automotive HUD interface layouts. The presented methodology aids manufacturers and designers in choosing product design solutions that enhance user satisfaction, providing a measurable reference.
Based on the discussions above, the novelty of this paper is delineated as follows:
(1) By precisely integrating visual tracking technology, we captured eye-tracking data from drivers using HUD. Incorporating the cognitive load of in-car drivers and the esthetic structure of HUD interfaces, we established novel evaluation criteria. This framework offers decision-makers a convenient foundation for making standardized judgments.
(2) The introduction of the Bayesian BWM and Gray-TOPSIS MCDM evaluation methodology led to the computation of standard weights and the ranking of alternative solutions. This marks the method’s initial application in the cognitive assessment of HUD layouts within the context of intelligent automotive driving environments.
(3) A competitive evaluation with similar existing methods was conducted to assess validity and refinement of the method proposed in this article.
Through simulation experiments, we validated the discriminative capability of the proposed method in evaluating solutions. Additionally, by integrating case studies, we offered further insights into the applicability of this method.
The practical contributions of the present study are as listed below:
(1) Integrating eye-tracking technology capable of capturing users’ real-time preferences and habits in utilizing Heads-Up Display (HUD) while driving, this study explores the layout cognition characteristics of smart vehicle HUD in depth. A novel evaluation framework, which combines eye tracking with interface layout cognition at the application level, is introduced. This framework demonstrates high accuracy and efficiency, thereby improving the assessment of smart car HUD interface design.
(2) We propose an MCDM evaluation method that integrates the Bayesian BWM and Gray-TOPSIS, applied for the first time in the context of interface layout assessment. With Bayesian BWM, expert opinions are amalgamated without loss of information. From a point of view of probability, the weights of standards and secondary criteria are determined by fewer pairwise comparisons, offering a more precise interpretation of the hierarchical structure among each criterion. Simultaneously introducing Gray-TOPSIS theory, weighted gray correlation serves as a distance measure, overcoming the limitations of Euclidean distance and compensating for the drawbacks of the TOPSIS method. This technique not only takes into account the geometrical similarity between data sequences, but also differentiates the degree of numerical closeness. It better reflects the internal variation patterns among assessment schemes, providing a more reasonable cognitive evaluation of target samples.
(3) Through comparative analysis, this work explores the relationship between the proposed method and other methods, and proves that method presented in the research paper has excellent accuracy and stability. To further support its applicability, the study integrated case studies to provide additional insights.
Related work
Intelligent automotive HUD interface layout
Head-up Display (HUD), a novel form of human-vehicle interaction, feed visual information to the front of the driver, positively impacting driving safety. 15 Currently, research on interface layout evaluation primarily takes two directions: first, evaluating interface layout through subjective assessments; second, employing objective methods like algorithms or principles for interface layout evaluation. Subjective evaluation studies, for example, involve subjective assessments of diverse interface layouts and color designs on the automotive display control interface. This evaluation yields insights into the impact of various layout schemes on the driver’s efficiency in recognizing and reading information 16 ; Another instance involves using eye-tracking devices to record eye movements and response times for two HUD arrow guidance icons. Analysis reveals that, while the shape of the icon has no impact, the position of the arrow does influence the driver’s response 17 ; Moreover, subjective research using eye-tracking experiments on the visual interface of HUD information layout analyzes the impact of different layouts on driving safety, illustrating that a clear layout contributes to good cognitive efficiency. 18 The mentioned studies effectively highlight the importance of interface layout usability. However, the analysis process predominantly starts from the user’s cognitive perspective, and the research outcomes are significantly impacted by the subjective intentions of the participants. Objective evaluation studies, for example, involve establishing a UI layout model based on importance and frequency of use. An enhanced Bacterial Foraging Optimization algorithm has been proposed to evaluate and optimize placements 19 ; To enhance interface layout, eye-tracking data and mouse-tracking data collected during human-interface interaction are employed. A novel design evaluation theory is proposed to derive the optimal layout for the interface. 20 However, the drawbacks of objective evaluation lie in the insufficient consideration for users’ subjective comfort and the somewhat one-sided selection of evaluation indicators. This approach lacks thorough consideration, affecting the authenticity and effectiveness of evaluation results. Given the visual confusion resulting from suboptimal HUD interface layouts 21 and the increased cognitive load due to unreasonable spatial allocation, a comprehensive evaluation of interface layouts is necessary, considering both subjective and objective perspectives.
Evaluating the intelligent automotive HUD interface necessitates taking into account the cognitive load on the driver. Cognitive load has a significant impact on the efficiency and safety of HMI, providing a measure of the driver’s psychological pressure and cognitive state during task execution. 22 It offers valuable guidance for improving driving safety and reducing accident risks. Simultaneously, considering the esthetic structure of the intelligent automotive HUD interface layout is essential. Scholars have conducted research in the realm of interface esthetic evaluation. For example, to objectively and quantitatively assess the esthetics of interface layout, a proposed non-linear esthetic comprehensive evaluation model serves as the foundation for interface layout evaluation 23 ; By extracting esthetic indicators, an interface esthetic evaluation system is developed. Subsequently, relevant esthetic computation formulas are applied to calculate the esthetic values of interface elements, ultimately concluding the esthetic evaluation of interface layout. 24 The mentioned studies on the evaluation of cognitive load and interface structural esthetics are relatively independent, lacking a combined quantitative assessment of these two aspects. Therefore, integrating research on interface layout esthetics and cognitive load into HUD layout considerations holds significant value.
Eye-tracking and cognitive load research in interface layouts
The driver’s search for information on the car display screen involves eye movements that act as objective indicators for interpreting attention distribution and information processing. 25 Evaluating interface layout through eye-tracking contributes to visualizing users’ information processing and decision-making. 26 For example, using eye-tracking technology to record the frequency and duration of fixations enables the assessment of user satisfaction with the interface. 27 Studying participants’ gaze time and average gaze time helps discern the impact of interface element layout on human eye recognition efficiency, providing novel human-machine interface design schemes that enhance operational efficiency. 28 From this, it can be observed that using eye-tracking technology to capture user information when using the HUD interface provides accuracy and efficiency. Typically, eye movement metrics such as total fixation count, average fixation duration, and fixation count are utilized, and these data can reflect the driver’s cognitive load state. Among various eye-tracking metrics, powerful indicators for measuring cognitive load include changes in pupil diameter,29,30 blink duration, 31 and blink frequency. 32 For instance, pupil diameter values increase with an increase in cognitive load. 33
A cognitive load model for the HUD interface was established based on the Cognitive Resource Limitation Theory. According to varying cognitive load demands, the cognitive load can be combined into several components in a certain manner. The cognitive load model for HUD interface layout is illustrated in Figure 1.

Cognitive load model for HUD interface layout.
In the proposed model, cognitive load is composed of three components: internal cognitive load, external cognitive load and closely related cognitive load. The cognitive load is indirectly related to the manager’s performance and task efficiency in performing HUD tasks. 34 The outlined model identifies the types of cognitive load that affect drivers during HUD tasks. In the current paper, the main attention is focused on the impact of extraneous cognitive load, which aims to alleviate the cognitive burden on the operator by reducing the complexity of the user interface design. The NASA-TLX method is the most commonly applied method for subjective assessment of cognitive load and has the advantage of being highly sensitive to changes in cognitive load. This tool has been successfully employed to measure cognitive load in various interface design domains, including assessing cognitive workload in driver-vehicle interactions 35 and investigating the impact of interface interaction types on operator mental workload. 36 In summary, the quantifiable parameters primarily studied for cognitive load in this paper are pupil diameter, blink rate, and NASA-TLX.
Materials and methods
Construction of HUD interface layout evaluation system
Numerous factors influence interface layout, requiring comprehensive consideration of human cognitive load, interface structural esthetics, and more. 37 Through online surveys and expert consultations, usability issues in current HUD interface layouts were gathered, balancing the independence and comprehensiveness of evaluation metrics. Simultaneously, considering drivers’ subjective experiences during the driving process and adhering to rules regarding the arrangement and layout of interface elements, an intelligent automotive HUD interface layout evaluation system based on structural layout esthetics, task efficiency, and cognitive load is proposed. The hierarchical structure of evaluation metrics is illustrated in Figure 2.

Hierarchical structure of HUD interface evaluation metrics.
Conversion of eye-tracking indicators
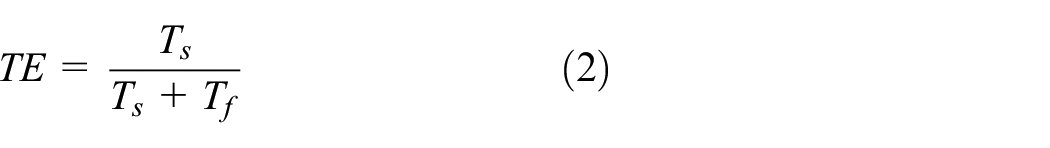
The evaluation of the intelligent automotive HUD interface layout requires measuring the driver’s cognitive load through eye-tracking, including parameters such as interface search time, number of fixations, repetition fixation ratio, saccade time ratio, etc. Additionally, esthetic calculations for interface structure are considered. Combining these two aspects helps to mitigate the impact of individual factors, ensuring a more comprehensive and rational assessment of the interface layout. Based on the structural partitioning of the layout scheme, the layout interest areas are delineated. Eye-tracking experiments are conducted to capture the driver’s eye movement metrics, including eye search time, number of fixations, average fixation time, first fixation time, etc. Subsequently, the calculation and transformation of evaluation metrics are carried out. The formula for calculating the Repetition Fixation Ratio is as follows:

where
The formula for calculating the saccade time ratio is as follows:
In this context,
Research on esthetic metrics for HUD interface structure
A well-designed spatial structure for interface layout strategically places information, guiding users and directing their focus toward the tasks at hand. It also contributes to the overall readability of the interface, enhancing the user experience. Building upon existing literature, 38 this study introduces four esthetic metrics for interface layout beauty.
Balance
Balance is measured by calculating the total mass difference of interface elements in the left, right, top, and bottom directions. This helps determine whether the overall interface achieves a state of visual balance. The formula for calculation is as follows:

Where
Coherence
Overall coherence signifies the density of the element layout. A higher overall coherence suggests lower morphological complexity, enabling users to better comprehend the form. Simultaneously, a higher overall coherence contributes to a more coordinated appearance. The calculation formula is as follows:
where
Uniformity
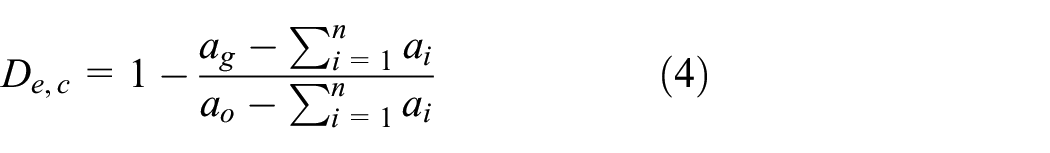
This metric analyzes the coverage range of morphological elements. It quantifies the uniformity of the interface layout by calculating the difference between the actual coverage of morphological elements and the optimal coverage. The formula is as follows:

Where
Sequence
A morphological design that aligns with human visual perception and attention changes can effectively guide the user’s gaze sequence. The calculation formula for the sequence metric is as follows:

Where
Evaluation model incorporating Bayesian BWM and Gray-TOPSIS
Weight determination of evaluation criteria using Bayesian BWM method

where w denotes the probability distribution, the occurrence probability of a given event j is in direct proportional to the total number of occurrences of that event. In this context,

Similarly, for the worst criterion

The calculations based on equations (8) and (9) yield the following results.

Similarly, for the optimal criterion

Thus, the method of determining the weights has been changed to estimating probability distributions, and a Bayesian hierarchical model has been necessary to solve the problem. Assuming there are K evaluators (k = 1,2,3,…,k), the k-th evaluator, based on the assessment criteria (
A similar process yields the comparison matrix for the worst favorable criterion:
The set of optimal and least favorable comparison matrices determined by the K evaluators is denoted as

According to equation (12), the likelihood of each variable is computed by the following probability rule, where x and y represent arbitrary random variables.

Before establishing the Bayesian model, it is necessary to determine the correlation and conditional independence among variables. The values of

Due to the separation between the variables, the application of Bayesian rule to the joint probability formula (12) results in:

The final equation is derived from the principle of the probability chain and the qualified dependence of the various variables. In addition, each evaluator gives his or her preferences autonomously. As the determination of the data in equation (15) depends on the determination of other data, there is a chain relationship among the different data.
Specify the probability distribution for each element in equation (15). Since the fundamental idea of BWM is retained,


In which “multinomial” is the multinomial distribution.
For a given

In which

Where

Therefore, the Markov chain Monte Carlo (MCMC) technology
41
can applied to calculate the posterior distribution. JAGS is one of Monte Carlo methods which is utilized to address the model. Its distribution of
The solutions are ranked utilizing the Gray-TOPSIS methodology for scheme prioritization
TOPSIS ranks the alternatives in the decision problem according to the closeness of each assessment target to the desired goal, aiming to identify the best alternative. However, employing distance scale to represent the proximity of evaluation objects merely reflects position relationships among the inputs, and fails to capture changes in the trend of data sequences. 42 It becomes challenging to judge the superiority or inferiority of solutions when the distance between the index values and the positive and negative ideal solutions is equal. Gray’s relational analysis (GRA) is a method used to assign significance to individual parts. 43 However, its drawback lies in considering only the geometric similarity between data sequences, while overlooking numerical proximity. To overcome the shortcomings of TOPSIS, Gray-TOPSIS theory is introduced. This aims to better reflect the internal variation patterns between evaluation schemes, thereby addressing the limitations of Euclidean distance and compensating for the deficiencies of the TOPSIS method.
For the normalization calculation of cost-type indicators, the procedure is as follows:

For the normalization calculation of performance-type indicators, the procedure is as follows:
Where j = 1,2,…, m; i = 1,2,…, n.

Where is the weighted standardized decision-making of the matrix,

Where

Where

Where

Where
The greater the respective values of


The results for
Case study
Experiment on cognitive evaluation of HUD interface layout
By studying the HUDs of 27 car manufacturers, we identified 27 types of information, which we divided into five types: the vehicle’s status, security, communication/entertainment, navigation, and the outdoor environment. We collected 200 instances of HUD interface designs. After summarizing, categorizing, and analyzing the data, we selected six representative samples based on morphological features from three fundamental layouts: H-type, left I-type, and right I-type, as shown in Table 1. To reduce the effect of the colors and shapes of the evaluation interface elements on the layout, we have treated the interface in a uniform way. Sample interface images were partitioned into functional regions and abstracted into the smallest rectangles capable of containing internal elements, as demonstrated in Table 2. Use software (Figma) to obtain data such as width and height of each element of the interface. The origin of the coordinates is the center of the interface, measured in centimeters, and the HUD interface layout coordinate system is illustrated in Figure 3.
Six selected HUD schemes for case study.

Processed layouts of the six selected HUD.


Coordinate system for HUD interface layout.
Experimental equipment
SMI iView-X RED120 Eye Tracker, stimuli presented using E-prime programing.
Twenty interaction interface designers, consisting of 15 males and 5 females, were chosen for the study. The average age of the participants was 25 years. All participants had normal binocular vision with no visual impairments. They were instructed to maintain a fixed posture, with their eye-to-screen distance set at approximately 60 cm in front of the display.
Experimental methods
(1) Before the experiment, subjects received a comprehensive briefing on the tasks, content, and requirements of the study.
(2) Before the experiment, all 20 participants received a briefing on the requirements and content of the study. Cognitive load was manipulated using a lagged digit recall n-back task, specifically using a two-back task. Participants were instructed to verbally repeat the digit presented two positions back in the sequence dictated by the staff. This process required participants to memorize a sequence of digits in a short period. Each numbered sequence was randomly generated for each individual stage of the session. All the guidance and replies were given orally. During the experiment, participants watched the HUD interface and there was not any limit on the time they could scan the display. Thus, participants were expected to complete the scan in a cognitively stable state. If a participant felt fatigued, they could request the termination of the test, take a break, and then resume to eliminate errors caused by fatigue effects.
(3) After the experiment concluded, participants were tasked with completing the NASA-TLB questionnaire. Following this, the staff saved the data and performed a cleanup of the testing site.
Computation based on Bayesian BWM and Gray-TOPSIS models
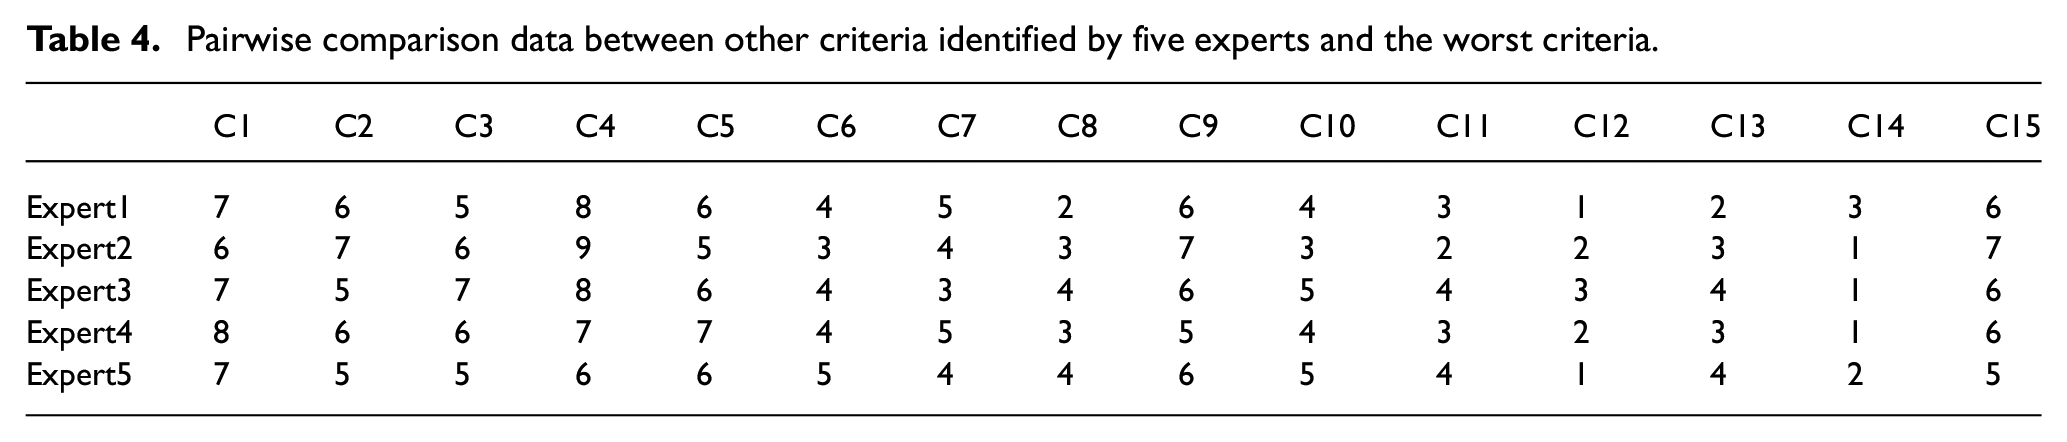
N1-N6 represent interface layout schemes. Average fixation time, first fixation time, task completion time, error rate, interface search time, number of fixations, repetition fixation ratio, saccade time ratio, balance, coherence, uniformity, sequence, average pupil diameter, blink rate, and NASA-TLB are designated as interface evaluation criteria, denoted as C1-C15.
To derive metric weights using the Bayesian BWM, experts were initially invited to fill out a form, providing essential information for Bayesian BWM. The five experts independently identified C4, C4, C4, C1, and C1 as the best criteria, and C12, C14, C14, C14, and C12 as the worst criteria. Following this, these five experts supplied pairwise comparison data between the best criteria and the other listed criteria, as depicted in Table 3. Pairwise comparison data between the listed criteria and the worst criteria are outlined in Table 4.
Pairwise comparison data between the best criteria identified by five experts and other criteria.

Pairwise comparison data between other criteria identified by five experts and the worst criteria.
By applying formulas (7)–(20), the weights of the evaluation criteria were calculated. The weight information for the evaluation criteria is depicted in Figure 4. It is evident that the error rate (C4) is the most critical criterion, while the blink rate (C14) is the least important. Moreover, Figure 4 clearly illustrates the weight relationships between various indicators. For instance, the weight of average fixation time (C1) is greater than that of NASA-TLB (C15) and interface search time (C5).

Weights of each evaluation criterion.
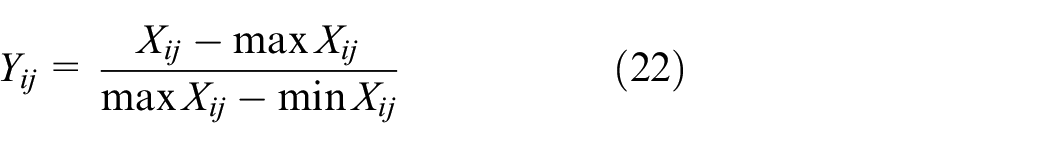
Following formulas (1)–(6), the raw values for each scenario were computed. By applying equations (21) and (22), the interface evaluation matrix underwent a normalization process, leading to the standardized decision matrix depicted in Figure 5. Subsequently, utilizing formula (23), the weighted decision matrix for the evaluation criteria was derived, as shown in Figure 6.

Standardized decision matrix.

The weighted decision matrix.
Applying formula (24), the optimal positive ideal solutions and negative ideal solutions were obtained, as shown below in Table 5.
Positive ideal solutions and negative ideal solutions.

Applying formula (25), the Euclidean distance between each solution and the positive ideal solutions and negative ideal solutions are computed, as shown in Table 6.
Euclidean distance between positive ideal solutions and negative ideal solutions.

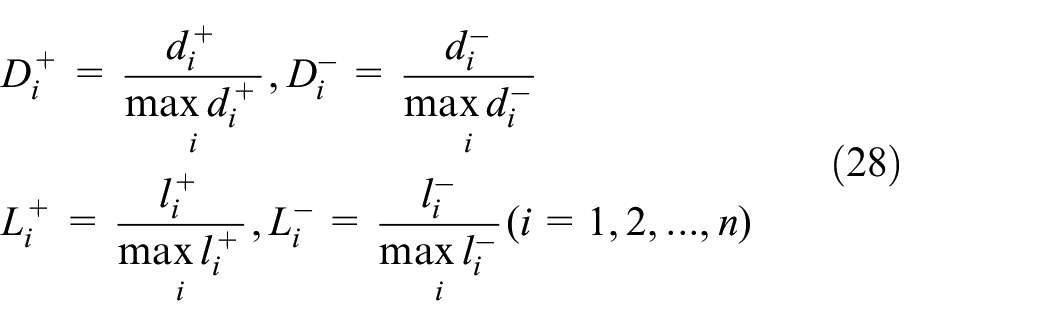
Applying equations (26)–(30), the weighted gray relational degree and relative closeness between each layout scenario and the positive ideal solutions and negative ideal solutions are established, as detailed in Table 7.
Relative closeness of layout schemes.

By performing calculations using the Gray-TOPSIS method, the separation distances between the N1 scenarios and the positive ideals are significantly greater than the separation distances to the NIS. In contrast, the distance from N6 to the PIS is significantly less than the distance to the negative ideal solution. Based on the relative closeness values, the final ranking of layout scenarios is determined as N1 > N3 > N4 > N2 > N5 > N6. This classification corresponds to the actual cognitive perception of the HUD layouts, thus confirming the usefulness and validity of the algorithm suggested in this study.
Analysis and discussion
Comparative analysis
To ensure the effectiveness of the algorithm suggested in the present work, we carried out a comparative analysis among the proposed algorithm and commonly used algorithms.
Algorithm 1 represents the HUD layout evaluation algorithm that combines the AHP and Gray-TOPSIS approaches. It is primarily used to illustrate the impact of decision experts’ subjectivity and the correlation between evaluation criteria on the assessment results. The calculations of the relative proximity are presented in Table 8.
Relative closeness values calculated by Algorithm 1.

Algorithm 2 represents the HUD layout evaluation algorithm based on traditional BWM and Gray-TOPSIS. This is mainly used to show the superiority of the algorithm proposed in this work using probability distribution calculations. The results of relative closeness calculations are presented in Table 9.
Relative closeness values calculated by Algorithm 2.

Algorithm 3 represents the HUD interface evaluation algorithm based on CRITIC and Gray-TOPSIS. It is primarily used to emphasize the superiority of using the best-worst weighting method. The results of relative closeness calculations are presented in Table 10.
Relative closeness values calculated by Algorithm 3.

A comparison of the four algorithms is presented by Table 11 and illustrated by Figure 7. It can be observed that the method proposed in this paper, along with Algorithm 1, Algorithm 2, and Algorithm 3, shows a similar developmental trend in interface layout ranking. In addition, the estimation findings are broadly compatible, demonstrating the effectiveness of the proposed method in HUD layout estimations.
Comparative analysis of four algorithms.


Comparative analysis of relative closeness among four Algorithms.
A comparison between the method proposed in this paper and Algorithm 2 and Algorithm 3 shows that the Bayesian BWM introduced in this study for calculating indicator weights and the application of Gray-TOPSIS to address the correlation issue among indicators result in more optimal computation results and better discriminative capability among solutions. This is attributed to considering the inherent relationships among selected indicators in the proposed method, allowing for the calculation of indicator weights from an objective and logical perspective.
The comparison between the method proposed in this paper and Algorithm 1 reveals significant disparities in their evaluation outcomes. This discrepancy arises from the substantial impact of subjective factors on the AHP theory. Decision-making experts involved in AHP comparisons must assess a larger volume of data, contributing to notable differences in the obtained results. Consequently, the assessment outcomes also bear a certain degree of subjectivity and inaccuracy.
To better showcase the discriminative capability of the four algorithms in evaluating the target solutions, we arrange the relative closeness obtained from each algorithm in ascending order. Subsequently, we calculate the differences between adjacent pairs, resulting in the sequence of relative closeness differences. The outcomes are presented in Table 12 and Figure 8.
Comparison of relative closeness of the four algorithms.


Differences in sequential relative closeness among the four algorithms.
The results in Table 12 and Figure 8 show that the algorithm suggested in this study shows the smallest difference in the standard deviation of the sequential relative proximity when calculating the relative proximity. The differences in minimum and maximum sequential closeness values are also at a suboptimal level. This characteristic enhances the algorithm’s ability to distinguish among sample solutions during the evaluation process, resulting in increased credibility and more reasonable assessment outcomes.
Explanatory numerical examples
The assessment of the industrial workbench interfaces includes six commonly used esthetic indicators: balance, symmetry, orderliness, simplicity, density, and regularity. Esthetic assessment of the interface for machine is conducted using the Bayesian BWM and Gray-TOPSIS proposed in this work. This approach is based on the machine tool esthetic evaluation discussed by Li et al. 44 Experts choose the optimal and least optimal indicators, and each criterion in the evaluation is compared with these indicators, resulting in corresponding comparison matrices. Bayesian BWM is used to compute the weights of each of these criteria, and finally, Gray-TOPSIS is applied to rank the solutions. Table 13 presents the weights of each criterion and Table 14 provides a comparison of solution rankings.
Weights of evaluation criteria.

Layout scheme ranking comparison.

The results in Table 14 indicate that Scheme 8 represents the optimal layout, and Scheme 1 is the second-best design. This aligns with the findings of Li et al, demonstrating the universality of the method proposed in this paper. However, there is inconsistency in the rankings of Schemes 2 and 7, which may be attributed to the omission of subjective information from decision-makers and the excessive pairwise comparisons among evaluation criteria, leading to discordant results. In contrast, Liu et al.’s method involves a substantial number of criteria for comparison, resulting in computational complexity and an increased likelihood of subjectivity and distortion in assessment outcomes. In comparison, the approach proposed in this work takes into account comprehensively contributions from all decision makers, ensuring consistency in the evaluation environment while reducing the volume of data for comparison, resulting in more objective and reasonable evaluation outcomes.
The above comparative experiments and case validation results suggest that the MCDM model proposed in the study is effective and reliable, rendering it suitable for evaluating interface layouts. Bayesian BWM was employed to assess the significance of dimensions and criteria. The usability is superior to the AHP and the native BWM. Using Bayesian BWM, the opinions of the experts were combined without loss of information, and the weights of the criteria and sub-criteria were determined using less pairwise comparison from a probabilistic perspective. Additionally, Gray-TOPSIS is more adept at preventing errors in evaluation results, yielding outcomes that are more reasonable and accurate.
Conclusion
The aim of this study is to improve human cognitive performance by developing a rating system based on three dimensions: esthetic appeal of the structural layout, task effectiveness, and cognitive load. The study uses Bayesian BWM to establish the weights of the assessment criteria and applies the Gray-TOPSIS to assess and rank the alternative scenarios. Experimental results indicate that the optimal interface layout for intelligent automobile HUD is a centrally symmetric “H” layout. This layout is characterized by its simplicity, clarity, and esthetic appeal, resulting in shorter gaze times. It significantly reduces driver cognitive load, thereby enhancing cognitive efficiency and user experience with the interface. The experimental results, aligned with users’ usage requirements, indicate that drivers are more inclined to choose a layout that possesses high cognitive efficiency and information transmission capabilities. The preference for the layout with enhanced cognitive efficiency and information conveyance is evident, effectively meeting the drivers’ needs. Furthermore, through comparative experiments with three other methods, the rationality and effectiveness of this approach were validated. Case studies also confirmed the universality of the proposed method. Additionally, the values and weights of indicators in the evaluation system provide valuable references for the improvement of subsequent designs, enhancing the efficiency of optimization. The study not only provides scientific and robust data support but also quantitatively analyzes the application of Bayesian BWM and Gray-TOPSIS in interface layout, bearing significant and meaningful value.
Regarding limitations, the method proposed in this study primarily integrates the overall weights assigned by the group of evaluators, but it lacks consideration for the expertise of the evaluators. Future research should aim to select evaluators with strong expertise for weight calculation and analysis. Additionally, in future studies, further exploration can be conducted to investigate the cognitive effects of different HUD interface layouts, considering individual differences among participants and the impact of driving scenarios. Finally, in the validation section, this study used an abstracted rectangular framework of the interface layout as the research sample, without considering actual HUD interfaces. The real interface layout may still be influenced by visual factors. Subsequent efforts will focus on addressing and overcoming the mentioned limitations and shortcomings in the research.
Footnotes
Acknowledgements
We would like to thank all reviewers.
Handling Editor: Chenhui Liang
Author contributions
Xuzhuang Zhang contributed to the conceptualization and experimental design, conducted the experiments, analyzed the data, wrote code, designed software, and performed computational work. They also prepared the figures and tables and drafted the manuscript, making critical revisions to important content. Weixing Wang contributed to the conceptualization and experimental design, making critical revisions to important content. LianDan Ma analyzed the data, wrote code, designed software, and performed computational work. They also prepared the figures and tables. ZiAo Wang executed the experiments, analyzed the data, wrote code, designed software, and performed computational work. They also prepared the figures and tables. Ningfeng Hu analyzed the data, wrote code, designed software, and performed computational work.
Declaration of conflicting interests
The author(s) declared no potential conflicts of interest with respect to the research, authorship, and/or publication of this article.
Funding
The author(s) disclosed receipt of the following financial support for the research, authorship, and/or publication of this article: This work was supported by Guizhou Provincial Science and Technology Projects (ZK[2023] Key 015).