
Abstract
This work investigates using pupil size to track changes in physical fatigue during manufacturing tasks. Participants completed an automotive manufacturing task over three trials. Impulse and peak force were recorded as ground-truth metrics of physical fatigue. Pupil size and blink rate were also recorded by means of a head-mounted eye-tracker. Impulse and peak force decreased between trial 1 and trial 3 suggesting an increase in fatigue. Interestingly, this was accompanied by a significant reduction in pupil size. No difference in blink rate was found. Our study adds to the literature on fatigue assessment suggesting pupil size as a future possible alternative metric for fatigue assessment in manufacturing Ergonomics.
Introduction
Physical fatigue increases the risk of injury at work. It is estimated that 69% of the workforces in safety-critical jobs feel tired at work (NSC, 2018). In manufacturing, recent estimates suggest fatigue to increase the amount of task errors by 3 to 10 times (Yung et al., 2020).
Measuring muscle activation or force exertion during the completion of a physical task represent the golden standards for fatigue assessment. As the resources required to complete a sustained activity decrease over time, this typically results in a decline in muscle activity (Enoka & Duchateau, 2008; Ferguson et al., 2013; Tetteh et al., 2020) and a reduction in the force generated (Morin et al., 2011; Potvin, 2012; Vøllestad, 1997).
There is a limited literature that has used alternative metrics for fatigue assessment. For example, the work by Geacintov & Peavler (1974) used pupil size – which measures changes in the pupillary surface of the eye– to track telephone operators’ fatigue during an 8-hour shift. Significant changes were observed with pupil size decreasing as workers became more tired. Fadda and colleagues (2015) utilized a similar approach with heavy machinery workers. Workers were instructed to use a high-fidelity quay crane simulator in a task requiring sorting shipping containers. The operators’ physiological activation – recorded as average heart rate – declined over time, with pupil size also decreasing from the first to the second hour of the study. Xiao-Yan and colleagues conducted a fatigue study on excavator operators (Xiao-Yan et al., 2020). Participants were instructed to operate a real excavator for 2 hours. Oculomotor metrics and self-reported ratings of fatigue were recorded. Consistently with the findings by Geacintov and Peavler (1974), a significant reduction in pupil size was recorded at the end of the job.
The above evidence suggest that pupil size might be sensitive to changes in fatigue during workplace tasks. However, most Human Factors research has adopted this metrics to track changes in human operators’ cognitive workload. Recent work has showed greater pupil size following conditions of higher cognitive task demand in fields like driving, aviation and human-computer interaction (Biondi et al., 2021; Chen & Epps, 2014b; Matton et al., 2020; Pillai et al., 2020; Ramakrishnan et al., 2021). In a recent study, we employed this metric to track changes in workers’ cognitive workload during the completion of automotive assembling operations (Biondi et al., 2023). As cognitive task demand increased, this resulted in greater pupil size.
Our objective with this study is to further investigate using pupil size to track changes in physical fatigue but during the completion of automotive manufacturing tasks. The work by Geacintov & Peavler (1974), Fadda et al. (2015) and Xiao-Yan et al. (2020) had participants complete workplace activities requiring workers maintain a stationary position for the entire task duration. We aim to test the effectiveness of using pupil size to track physical fatigue by having participants complete repeated, full-body operations requiring a wider range of upper-body and lower-body motions. In our study, participants are instructed to complete traditional manufacturing operations wherein their level of fatigue is tracked using force exertion. Pupil size is also measured alongside blink rate using a head-mounted eye-tracker throughout the duration of the manufacturing task.
Methods
Participants
Twenty-four University of Windsor students (13 men, 11 women) were recruited and received a $10 Amazon gift card in exchange for their participation. Their age ranged between 19 and 31 years old (M= 22, SD=2.84) and had no history of severe musculoskeletal injuries (Cort et al., 2013). The research complied with American Psychological Association Code of Ethics and was approved by the University of Windsor Research Ethics Board (#19–065) and Research Safety Committee.
Design
We adopted a factorial design with manufacturing task trial being the only independent factor. Manufacturing task trial (3 levels: trials 1, 2, and 3) was manipulated by having participants complete the manufacturing task a total of three times. Dependent measures were: normalized pupil size (total area in millimeters); peak force (in %MVE); force impulse (in N-sec); blink rate (number of blinks per minute).
Equipment and Procedure
Force and maximum voluntary exertions (MVE)
Upon entering the laboratory, participants were instructed to complete the Standardized Nordic Questionnaire (López-Aragón et al., 2017) to screen for musculoskeletal injuries and provide their demographics information. Participants then began familiarizing with the physical task which consistent in pushing and pulling on a handle positioned at a height of 122cm and attached to a resistance cylinder (see figure 1). This task was chosen as it resembles common automotive manufacturing tasks (Cimino et al., 2009; Zare et al., 2020). During the experiment, participants completed this task ten times (ten pushes + ten pulls) per trial over a three trials.
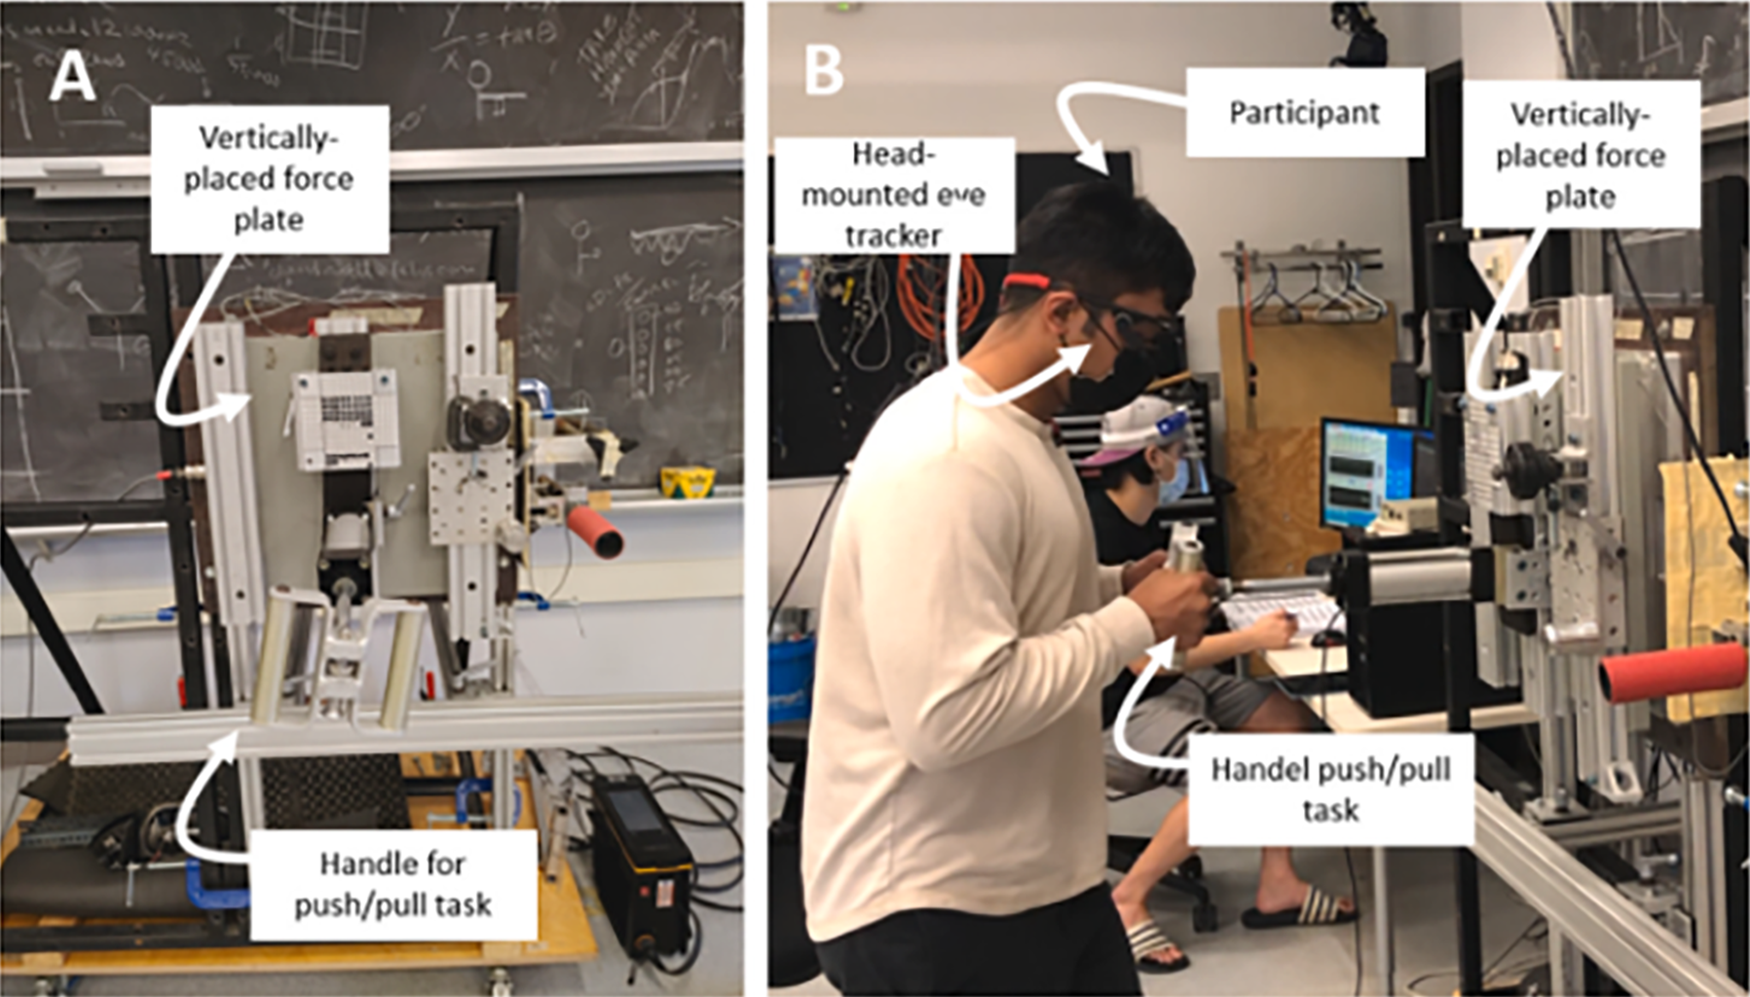
Experimental setup. A shows the handle for the push/pull task and the vertically-placed force plate. B shows the participant completing the push/pull task.
A force plate (AMTI-OR6-OP, Advanced Medical Technologies, Inc, Watertown MA, USA) oriented vertically and attached to the back of the resistance cylinder was used to measure the force exerted in each trial. Prior to performing any of the experimental conditions, each participant provided maximum voluntary exertions (MVE) that were recorded for handle push and pull efforts.
Eye-tracker and baseline recording
Participants were also instructed on how to use the Pupil Labs wearable eye-tracker (Pupil Labs GmbH, Berlin, Germany). The eye-tracker uses three cameras: two eye cameras (one for each eye with a 120Hz sampling rate), and one world camera recording from the participant’s perspective. The headset was connected to a desktop computer via a USB cable. A 9-point calibration was conducted by having participants look at a 27-inch Lenovo monitor located approximately 80 centimeters away from the participant. Pupil Capture (v. 3.1.16) was used for the data recording, and Pupil Player (v 3.1.16) was used for data extraction.
Experimental phase
During the experimental phase, participants completed the physical task over three trials. Each trial consisted in participants completing ten pushes and ten pulls on the handle using their maximal force – a practice commonly used in the ergonomics literature (Bailey et al., 2013; Tomezzoli et al., 2022). No rest was provided between trials. Each trial took approximately 42 seconds to complete.
Data processing and analysis
Force. Force signals were analog-to-digital (A/D) converted at a sampling rate of 1000 Hz (USB-6216, National Instruments, Austin, TX), and all digitally converted data were smoothed using a sixth-order Butterworth low-pass filter with a cut-off frequency of 10 Hz in custom LabVIEW software (National Instruments, Austin, TX). While 3 axes of force were collected, we chose to analyze only the force in the “intended direction”, i.e., along the z-axis (push/pull). Peak force was calculated as the percentage of force exerted during each trial relative to the maximum voluntary exertion recorded in the pre-experimental phase (in % MVE). Impulse (N s) was calculated as the force integral with respect to time for each effort, where each effort was determined as the period at which force recorded was greater than zero. RStudio (Racine, 2012) was used for data processing and statistical testing. Missing data were imputed using the Multiple Imputation by Chained Equations (MICE) R library. Unlike traditional means of data imputations, this approach imputes the missing data through an iterative series of predictive models.
Pupil size
Pupil Play (Pupil Labs, Berlin, Germany) was used for the processing of pupil size and blink rate. The detection algorithm uses a 3D model to estimate the size of the pupil. Pupil size was calculated as the diameter of the pupil in millimeters. Values smaller than 2 mm and greater than 8 mm were considered artifacts and removed from the analysis (Binda et al., 2013; Mathôt et al., 2018). The mean pupil size recorded in the baseline condition was used to normalize the values in each trial as follows: (x-μ)/σ, where x is the observed value, μ is the mean in the baseline condition, and σ is the standard deviation in the baseline condition. Mean normalized pupil size for each trial was then calculated.
Blink rate
For blink detection, we adopted a filter length of 0.2 seconds and a confidence threshold onset/offset between 0.5 and 0.3. The onset and offset thresholds are, respectively, the thresholds that the filter response must rise above or fall below to classify the onset and end of a blink (PupilLabs, n.d.). The filter length represents the time interval wherein the blink detector attempts to find confidence drops and gains. These parameters were agreed upon empirically after consulting with the manufacturer. Data also underwent a visual inspection by the research assistant to ensure that no visible anomalies were present. Blink rate was calculated for each trial as the number of blinks per minute. The research assistant also manually coded blink rate to ensure the validity of the PupilPlay output. Many participants showed unusually low blink rates during the baseline recording. With this in mind, and given that analyzing uncorrected blink frequency is common practice in literature (Chen & Epps, 2014a; Faure et al., 2016), we decided not to baseline-correct blink rate.
Statistics
Linear models were adopted. Repeated-measure analysis of variance (ANOVA) were run. Mauchly’s tests of sphericity were conducted to check if the assumption of sphericity was met on the data, in which case Greenhouse-Geisser were applied to ANOVA analyses. Bonferroni-corrected post hoc tests were run to explore differences between pairwise groups.
Results
Force impulse
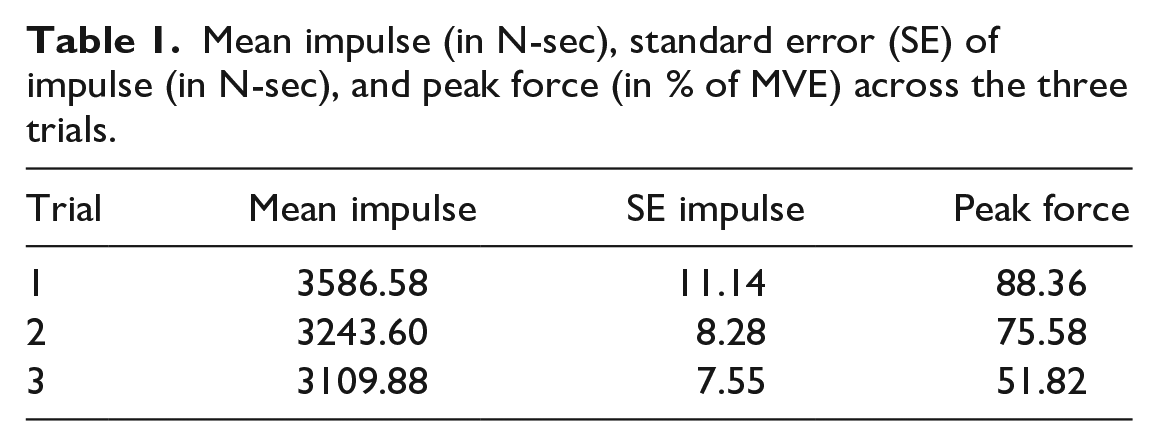
A repeated-measure ANOVA was conducted on impulse (N-sec). The analysis revealed a significant effect of trial, F(1.28, 30.74)=20.52, p<.05. Post hoc tests revealed significant differences between trials 1 and 2, and 1 and 3, with average impulse decreasing over time (table 1).
Mean impulse (in N-sec), standard error (SE) of impulse (in N-sec), and peak force (in % of MVE) across the three trials.
Peak force
A repeated-measure ANOVA was conducted on impulse (N-sec). The analysis revealed a significant effect of trial, F(2,48) = 26.82, p<.05. Post hoc tests revealed significant differences between trials 1 and 3 (table 1).
Pupil size
Mean normalized pupil size across conditions is presented in figure 2.
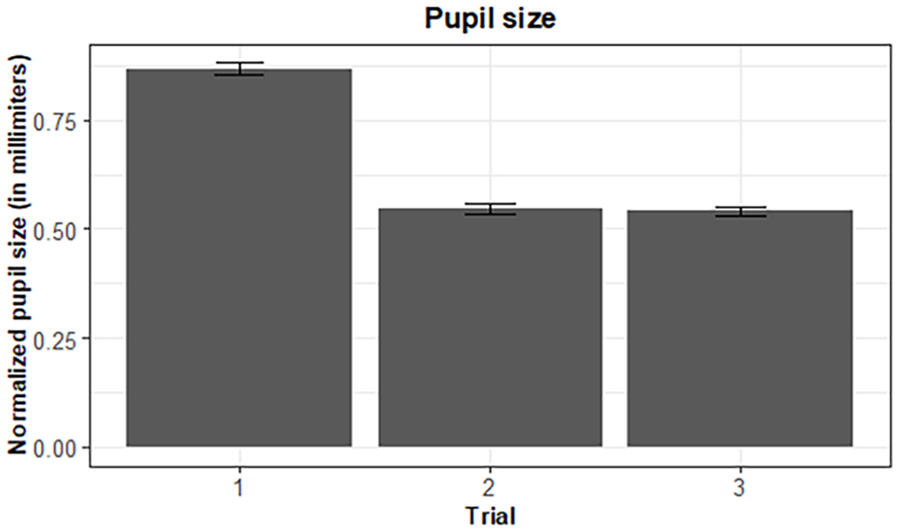
Average normalized pupil size in trials 1 through 3. Error bars represent standard errors.
A repeated-measure ANOVA was conducted on normalized pupil size data. A significant effect of trial was found F(1.44, 30.35) = 3.42, p<.05. Holm-Bonferroni-corrected post-hoc tests revealed significant differences between trial 1 and trial 2, p<.05, and trial 1 and trial 3, p<.05.
Blink rate
Blink rate across the three trials is presented in figure 3. The repeated-measure ANOVA conducted on blink rate did not reveal a significant effect of trial, F(2, 48) = 1.44, p>.05.
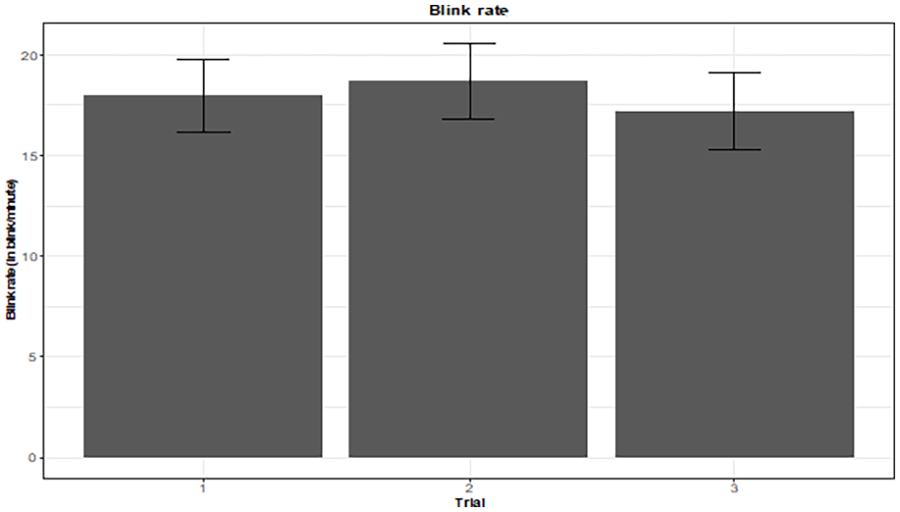
Average blink rate in trials 1 through 3. Error bars represent standard errors.
Discussion
A reduction in exerted force was observed over time. In particular, impulse declined from 3586.58 N-sec in trial 1 to 3109.88 N-sec in trial 3. Consistently with this pattern, peak force recorded as % MVE also decreased from 88.36% in trial 1 to 51.82% in trial 3.
With respect to our main goal, the observed reduction in exerted force was also accompanied by a significant decline in normalized pupil size. Pupil size decreased by approximately 0.3 millimeters, a pattern that is consistent with what found in similar studies (Khairat et al., 2020). This findings is key in that it adds to the limited literature showing smaller pupil size under conditions of physical fatigue. The work by Fadda et al. (2015) and by Xiao-Yan et al. (2020) observed this pattern with workers largely maintaining a sitting posture during the completion of workplace tasks. Our volunteers, instead, were engaged in manufacturing operations requiring the use of upper and lower body, and core muscles to stabilize the body while producing the push and pull efforts. This datum is interesting in that it proves that our eye-tracking equipment was able to pick up even relatively subtle differences in the workers’ pupillary response during the execution of such physically taxing task.
Blink rate analyses showed no difference in blink frequency over time. Blink rate is commonly used to measure tiredness, especially during prolonged driving or piloting tasks (FAA, 1998; Navastara et al., 2020). It is possible that the relatively short duration of our manufacturing task (42 seconds per trial on average) might have been insufficient to elicit significant changes in blink behavior. We posit that longer task durations may be necessary for blink frequency to serve as a reliable metric of fatigue.
Our study advances the use of pupil size as a potential future alternative for fatigue assessment. While our findings shed some light on the sensitivity of oculomotor metrics in tracking physical fatigue, there are outstanding questions that are left to be tackled. Our participants performed manufacturing tasks only for short periods of time. Future research should consider adopting a similar methodology with workers completing assembling tasks in more ecological, realistic settings. Future research should also further investigate the neurophysiological link between fatigue and the selective changes in pupil dilation.
These lingering questions aside, our exploratory findings add knowledge to the field of fatigue assessment in manufacturing. While our findings are by no means definitive and necessitate further investigation, we envision a future where, similarly to state monitoring systems in transportation (Ryan et al., 2021; SmartEye, 2020), the available machine vision and camera technology support more seamless, contact-less eye-tracking-based approaches for fatigue assessment.
Footnotes
Acknowledgements
We acknowledge the generous contribution from Atlas Copco Inc. and Mitacs. We also thank SSHRC, NSERC, and WE-SPARK Health Institute for their valuable support.