
Abstract
An outdoor experimental study investigated the cooling of photovoltaic (PV) panels using nano-fluids containing metallic (calcium carbonate, CaCO3) and non-metallic (ferro-magnetite, Fe3O4) particles. The study compared the solar power output and efficiency of PV panels cooled by various nano-fluids, as well as uncooled and water-cooled systems, under laminar and turbulent flow conditions with flow rates ranging from 1000 to 7000 mL/min. Aluminum heat exchangers (460 mm in length, 10 mm in outer diameter, and 10 mm in thickness) were attached to the rear surface of each PV cell, enabling the analysis of cell temperature, thermal performance, and electrical performance. The use of CaCO3 and Fe3O4 nano-fluids notably reduced the average cell surface temperature compared to uncooled and water-cooled systems. Fe3O4 nano-fluid, in particular, excelled due to its high thermal conductivity, which resulted in an improved heat transfer coefficient and Nusselt number when compared to air and water cooling. The electrical performance, power output, and efficiency of the PV cells all improved when cooling systems were employed in contrast to the uncooled condition. Among the available cooling methods, Fe3O4 nano-fluid stood out for its superior results, thanks to its exceptional thermal conductivity.
Introduction
Solar photovoltaics (PV) are at the forefront of the drive to decarbonize global energy production in response to global heating and climate change. However, as the temperature of a solar cell increases, its efficiency falls by around 0.45% per °C. 1 This is a particular issue in countries with high solar irradiation, where solar PV technology has the highest potential for large-scale energy generation. Finding effective methods for cooling solar cells could therefore lead to improved performance and higher rates of energy production.
In Jordan, solar energy has enormous potential since it is located in the world solar belt with sunshine more than 300 days annually. The average solar radiation is 4–8 kWh/m2, resulting in 1400–2300 GWh annually.2,3 According to the annual report of the Ministry of Energy and Mineral Resources, 4 Jordan imported around 94% of its fossil fuels to fulfill its energy demands, representing about 10% of its gross domestic product (GDP). The government’s strategy is to generate 10% of its energy requirements from renewable sources (solar, wind, and biomass resources). 5 The government master plan for energy saving includes a number of recommendations related to energy conservation and efficiency. 6 One rational option to address the energy gap in countries such as Jordan is to increase the photovoltaic cell (PV) power generation efficiency per unit area.
One of the major limitations for solar photovoltaic efficiency modules is the overheating of PV panels. The higher the PV cell surface temperature, the worse the efficiency of the PV power output, 7 with a decrease of around 0.5% in efficiency per °C of heating. Solar PV panels perform well at low temperatures. 8 Singh et al. 9 and Mattei et al. 10 reported that only 13%–15% of solar radiation is converted to output electricity. Therefore, PV cooling is necessary to enhance the efficiency of a PV module and minimize the loss of energy as heat. Fraisse et al., 11 Moharram et al., 12 and Bashir et al. 13 found that the efficiency of a module is up to 13% higher than the standard module due to the cooling influence provided by water circulation as a cooling method. Moreover, researchers such as Hassani et al. 14 and Rahbar et al. 15 developed a novel technique to remove the excess heat from PV panels using nanotechnology, and it was reported that the electrical efficiency was increased by Sathe and Dhoble. 16 Employing nano-fluids as a coolant is a promising approach for improving the performance of solar PV cells through active cooling. In a closed-loop cooling system, the thermophysical properties of the coolant fluid play a key role. The thermal conductivity of a fluid can be significantly improved through the introduction of relatively low volume fractions (typically <5 vol%) of nanoparticles with high thermal conductivities.17,18 These hybrid, or composite fluids, are termed nano-fluids by researchers. Choi and Eastman 19 have been studied over the past three decades as a method of improving cooling or heat transfer in various automotive, civil, and industrial engineering applications. To date, nano-fluids have primarily been applied to photovoltaic thermal (PV-T) systems that convert solar radiation into electricity through the photovoltaic effect while utilizing the thermal energy generated by the incident radiation.15–20 They are also of interest for active cooling of conventional PV cells.
According to Murtadha et al. 21 and Ghalandari et al., 22 using nano-fluids for cooling photovoltaic (PV) panels is a promising approach for several reasons: enhanced thermal conductivity, where circulating nano-fluids over the surface of PV panels can transport heat more efficiently away from the panels to a heat exchanger or cooling system. This helps in maintaining lower operating temperatures for the PV panels, thus increasing their efficiency and lifespan. Moreover, nano-fluids help distribute heat across the panel’s surface, reducing hot spot formation. Additionally, using nano-fluid cooling systems can potentially increase the electricity output of the panels while consuming less energy for cooling compared to traditional methods.
The novelty of nano-fluid cooling for PV panels compared to conventional coolants, such as air or water, lies in its ability to address thermal management challenges in a more efficient, environmentally friendly, and cost-effective manner compared to traditional cooling methods. Moreover, nano-fluids are contributing to the advancement of solar energy technology. 23
Nano-fluids, colloidal suspensions of nanoparticles in a base fluid, have garnered attention for their potential to enhance heat transfer properties in various applications. In the context of cooling photovoltaic (PV) panels, the stability and pH of nano-fluids have become crucial factors in optimizing their performance. The stability of nano-fluids is of principal importance in solar thermal applications. Previous research in this area has focused on developing nano-fluids with long-term stability to ensure that the nanoparticles remain suspended and do not settle over time. Various surface treatments and additives have been explored to enhance the stability of nano-fluids, making them suitable for use in solar collectors and heat exchangers. Kanti et al. 24 and Cherecheş et al. 25 found that the pH of the nano-fluid dispersion has a significant impact on the overall stability of nano-fluids. Additionally, the pH value affects the nanoparticles’ surface charge and zeta potential (ZP), where low ZP tends to cause sedimentation and agglomeration, whereas dispersions with a high ZP lead to electrical stabilization. Moreover, very low pH levels lead to the corrosion of the heat transfer system.
Previous research into solar PV cooling using nano-fluids has focused on those made with metal, metal-oxide, and silicon carbide nanoparticulate inclusions. Ebaid et al. 26 investigated the enhancement of heat transfer using water-based magnetite-nano-fluids in a heated pipe. The results showed that the thermal transfer performance of Fe3O4/water nano-fluid is significantly affected by the magnetic field. Additionally, Ebaid et al. 27 conducted experiments using two types of nano-fluids, Al2O3 and TiO2, at various concentrations (0.1%, 0.05%, and 0.01% by weight) and different volume flow rates. The power output of the PV cell decreased by 8.46%, 6.70%, 6.00%, and 2.95%, and 10.64%, 7.34%, 6.71%, and 2.95%, respectively. Furthermore, the efficiency of the PV panel increased by 9.09%, 6.80%, 5.9%, and 2.89%, and 11.08%, 7.75%, 6.94%, and 2.89%, respectively. It is evident that the use of nano-fluids improved the heat transfer rate compared to water and air-based cooling.
This paper investigates the feasibility of enhancing efficiency and electricity generation, specifically elevating output voltage and power from solar radiation. This is accomplished by employing two types of nanofluids (CaCO3 and Fe3O4) at a concentration of 1 wt% to cool PV solar panels. Comparisons are made against cooling with water and air. The experimentation of PV cooling is conducted under laminar and turbulent-flow conditions, as well as in real outdoor solar irradiation conditions.
Preparation of nanofluid
This study investigated the use of nano-fluids, specifically Fe3O4 and CaCO3 nano-fluids, for cooling PV panels with the aim of comparing their effectiveness. The selection of these nano-fluids was based on several factors, such as desired thermal performance, cost efficiency, availability, high specific heat capacity, high thermal conductivity, and whether they possessed metallic or non-metallic properties. In comparison to Fe3O4 nano-fluid, CaCO3 nano-fluid exhibited lower thermal conductivity, specific heat capacity, and cost. However, it boasted high availability.
To synthesize the Fe3O4 nanoparticles, Ebaid et al. 26 dissolved 16 g of ferrous-chloride-tetrahydrate (FeCl2. 4H2O, 99.0%, Fischer) in 300 ml of deoxygenated deionized water and 32 g of ferric-chloride-hexahydrate (FeCl3.6H2O, 99.0%, Alpha Chemika) in 400 ml of deoxygenated deionized water separately, as shown in Figure 1(a). The FeCl2.4H2O solution was added slowly to the FeCl3.6H2O solution in a glass reactor under strong stirring and bubbling of N2 gas at 70°C–80°C. Additionally, ammonium hydroxide was used as a precipitating agent. The solid nanoparticles were separated using qualitative filter paper. The wet magnetite nanoparticles were oven-dried at 100°C. Finally, 100 g of the magnetite nanoparticles powder (Fe3O4) was dispersed in 10 L of distilled water. The nano-fluid was dispersed for 15 min using an ultrasonic processor. Moreover, the pH was adjusted to pH 9 using NH4OH, and oleic acid and ethanol were used as surfactants.

Schematic diagram for: (a) preparation process of the Fe3O4 nanofluid and (b) preparation process of the CaCO3 nano-fluid.
CaCO3 nano-fluids were prepared for comparison, as depicted in Figure 1(b). A slurry was created using analytical grade Ca(OH)2 (99.0%, Alpha Chemica) and deionized water, and CO2 bubbling was employed to synthesize calcium carbonate (CaCO3) nanoparticles through carbonation. The experimental setups involved bubbling reactors with magnetic stirring. Qualitative filter paper was used to separate the CaCO3 nanoparticles, and the wet nanoparticles were subsequently oven-dried at 100°C. Subsequently, 100 g of the obtained CaCO3 nanoparticles were dispersed in 10 L of distilled water. The nano-fluid was dispersed for 15 min using an ultrasonic processor. Additionally, oleic acid and ethanol were utilized as surfactants to enhance the stability of the nano-fluid in both types. Particle size distribution and morphology analysis were conducted on the powder samples. The scanning electron microscope (SEM) image revealed that the magnetite powder particles are within the nano range, approximately 40 nm in size, and exhibit a spherical shape.
Experimental setup
The experimental setup, depicted in Figure 2, comprises four monocrystalline silicon photovoltaic modules, each with a power rating of 30 Wp. These modules measure 260 mm in width and 460 mm in length. On the rear surface of three of these PV modules, aluminum heat exchangers (specifically of the header and riser type) were affixed. The fourth PV module was left to dissipate heat naturally through air cooling. The three aluminum heat exchangers, categorized as primary heat exchangers, were securely positioned onto the backsheet of the cooled PV modules. This attachment was facilitated using aluminum foil, ensuring optimal contact between the heat exchanger and the backsheet, as depicted in Figure 3. To further enhance the contact between the aluminum heat exchanger and the rear surface of the PV cell, a heat sink material was introduced. Figure 4 provides dimensional details of the heat exchanger design and temperature measurement points. Each PV module, cooled by nanofluid, had a standard cooling network as shown in Figure 5. The nanofluid and water coolant were stored in a 15 L glass container designed to visually monitor any potential settlement of the nanofluids while providing continuous mixing by taking advantage of the velocity difference between the incoming fluid into the glass container and the fluid stored in the container, as demonstrated in Figure 5. The nanofluid and water coolant were forced into the cooling network using a commercial peripheral centrifugal pump with a 0.5 hP size, and the flow rate was measured using an ultrasonic flowmeter. Moreover, a network of pipes and fittings was used to transport the coolant within the cooling system to a secondary air heat exchanger. The three different coolants passed through three distinct liquid-to-liquid heat exchangers.
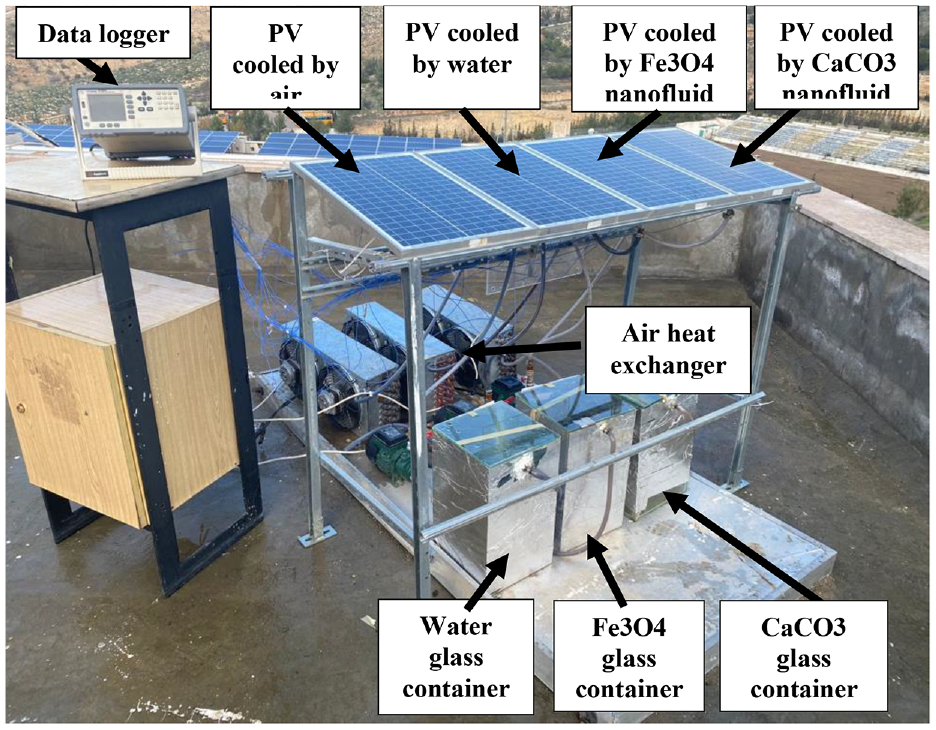
Experimental setup.

Heat exchanger with K-type thermocouples.

Heat exchanger details.

Nano-fluid cooling network cycle.
It is important to note that when employing nanofluids for cooling photovoltaic (PV) panels, careful consideration of appropriate boundary conditions is crucial to ensure the effectiveness and efficiency of the cooling system. The key boundary conditions in the context of using nanofluids for cooling PV panels are outlined below:
a. Inlet temperature: The temperature of the nanofluid at the inlet of the cooling system is a critical boundary condition. It determines the initial temperature of the fluid as it enters the system. The inlet temperature should be controlled to ensure that the cooling process is effective. The selection of the inlet temperature depends on the ambient conditions and the desired operating temperature of the PV panels.
b. Inlet velocity: The velocity at which the nanofluid enters the cooling system affects the flow dynamics and heat transfer within the system. Controlling the inlet velocity is essential to maintain a consistent flow rate and optimize the cooling efficiency. Proper consideration of the fluid flow characteristics helps in achieving uniform cooling across the PV panel surface.
c. Wall temperature: The temperature of the PV panel surface (or the cooling pipe walls) is another important boundary condition. The cooling system aims to dissipate heat from the PV panel to the nanofluid flowing through the cooling heat exchanger pipes. The wall temperature affects the rate of heat transfer between the PV panel and the nanofluid. Maintaining the wall temperature within acceptable limits is crucial to prevent overheating of the PV cells.
d. Outlet pressure: The pressure at the outlet of the cooling system affects the flow rate and fluid dynamics within the system. Proper outlet pressure control ensures that the nanofluid flows smoothly through the cooling pipes, avoiding issues such as cavitation and flow stagnation. Maintaining an appropriate outlet pressure is essential for efficient cooling.
e. Thermal insulation: In some cases, especially in outdoor environments with varying ambient temperatures, thermal insulation around the cooling system might be necessary. Insulation helps in maintaining the desired operating temperature by minimizing heat exchange with the surrounding environment. Properly insulated boundaries prevent heat loss or gain, ensuring the nanofluid maintains its cooling properties as it circulates through the system.
f. Material properties: Boundary conditions also include the material properties of the cooling system components, such as thermal conductivity and heat capacity. These properties influence the heat transfer between the nanofluid and the cooling system. Proper material selection and consideration of material properties are essential to enhance the overall efficiency of the cooling process.
Theory of work
Heat transfer governing equation
Convective heat transfer coefficient of fluid
The convective heat transfer by coolant is given as:

Where
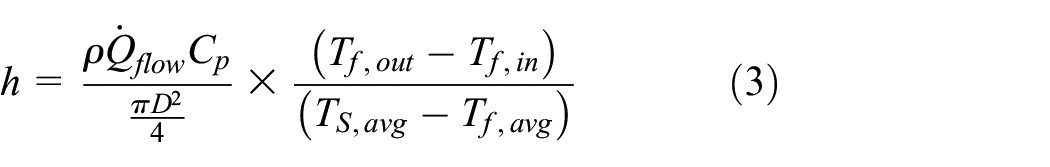
The convective heat transfer coefficient along the cooling heat exchanger is given by:

Where:
Combining (1) and (2) to give an expression for convective heat transfer coefficient
Nusselt number
Nusselt Number is given by Bianco et al. 28 as follows:

Where,
Governing equations of nanofluid properties
Volume fraction of nano particles
The volume fraction of nanofluid is given by 29 :


Where:
Effective thermal conductivity of nanofluid
Based on effective medium theory EMT, randomly dispersed, and uniformly sized spherical particles Das et al., 30 reported that Maxwell investigated the conduction analytically through a suspension particle and showed that the effective thermal conductivity of nanofluid can be calculated as:

Where,
Density of nanofluid
The density of a nanofluid is based on the classical theory of two-phase mixture given by Gelis et al. 31

Where
Specific heat capacity of nanofluid
The following equation is proposed for determining specific heat capacity of nanofluid and assessing heat transfer performance of nanofluids32,33

Where:
Dynamic viscosity of nanofluid
The dynamic viscosity of nanofluid can be computed as follows 34

Where,
Governing equations of fluid flow
Mean velocity
The mean velocity of nanofluid can be computed as follows:

Where
Reynolds number
Reynolds number is calculated based on pipe diameter as follows 35

Where
Governing equations of power and efficiency
Power output of PV panel
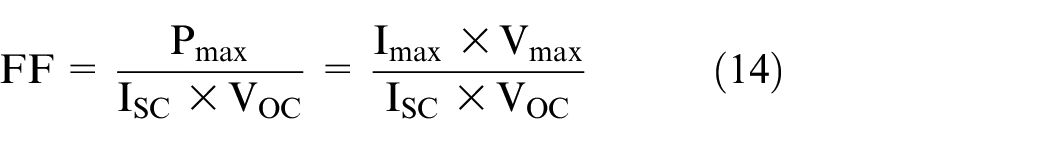
The maximum power output is given by 36

Where,
The cell generates the maximum power
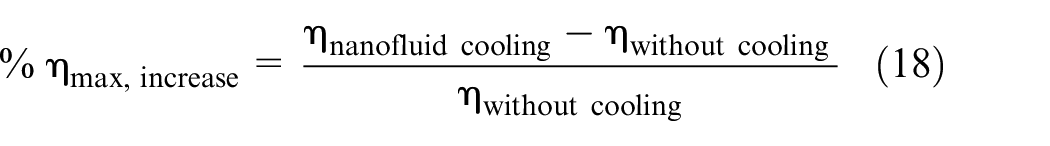
The percentage of the increase of the generated power, which is a dimensionless parameter, is defined as follows 37 :

Efficiency of PV panel
Efficiency is defined as the ratio of energy output from the solar cell to input energy from the sun as reported by Markvart and Castaner
36
and Karami and Rahimi
37
and it represents the performance of the solar cell itself. The efficiency depends on the spectrum of the incident sunlight, intensity of the incident sunlight, the temperature of the solar cell.


Experimental procedure
A series of six experiments were conducted to evaluate the cooling efficiency of solar panels using nanofluids containing calcium carbonate (CaCO3) and ferro-magnetite (Fe3O4) nanoparticles, both at a concentration of 1 wt%, in addition to water. These experiments encompassed various flow rates ranging from 1000 to 7000 units. As a baseline comparison, a control experiment involved natural air cooling. The essential parameters recorded across all experiments included the intensity of radiation, ambient temperature, flow rate, inlet fluid temperature, outlet fluid temperature, surface temperature of the photovoltaic (PV) cell, open circuit voltage of the cell, and short circuit current of the cell. Measurements were systematically taken during daylight hours from 9:00 AM to 3:00 PM. Notably, for more precise surface temperature readings, multiple positions on the cell surface were equipped with K-type thermocouples, and a data logger was employed to gather the data.
Results and discussion
Properties of nanofluids
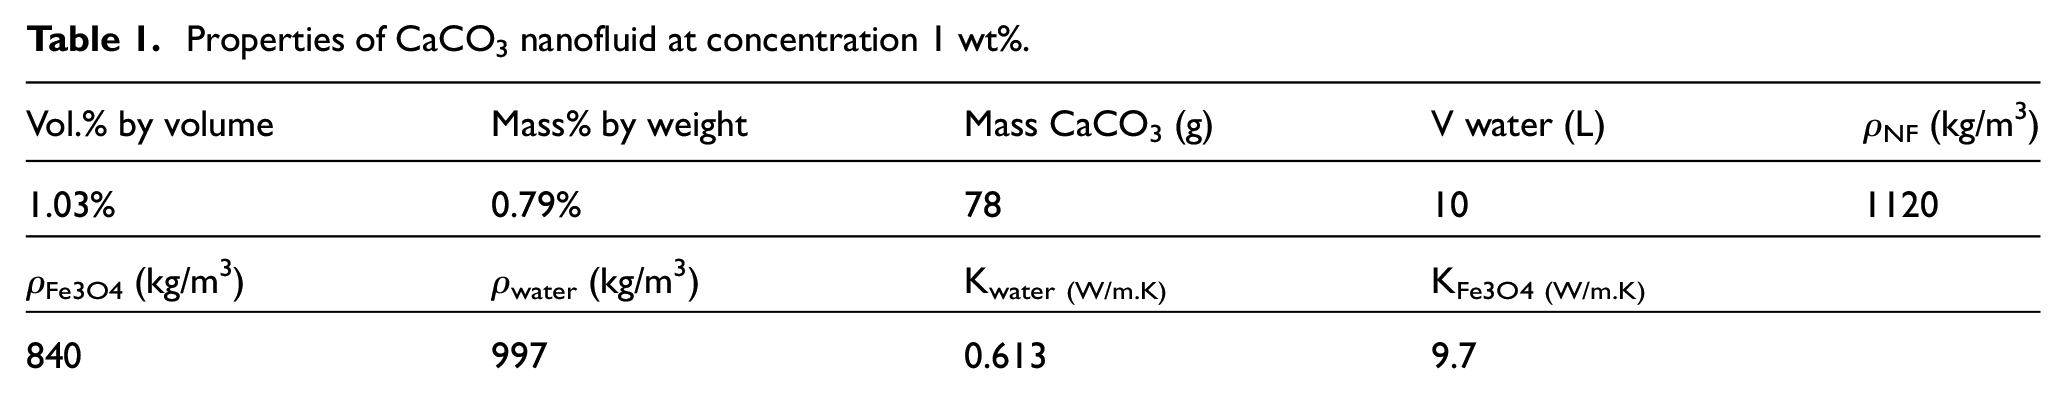
The calculation of the effective thermal conductivity (keff) for each nanofluid was performed using equation (7). Tables 1 and 2 present the outcomes of calculating the volume fraction of nanoparticles, volume occupied by nanoparticles, density, dynamic viscosity, and thermal conductivity for Fe3O4 and CaCO3 nanofluids with a 1 wt% concentration by weight.
Properties of CaCO3 nanofluid at concentration 1 wt%.
Properties of Fe3O4 nanofluid at concentration 1 wt%.

PV cell surface temperature characteristics
In Figure 6, the graphical representation illustrates the average surface temperature of photovoltaic (PV) cells, offering insights across various flow rates ranging from 1000 to 7000 mL/min for the three distinct cooling cells. This comprehensive analysis includes an uncooled cell reference for comparative purposes. The findings underscore the heightened cooling efficiency achieved by both Fe3O4 and CaCO3 nano-fluids when contrasted with conventional water- and air-cooling systems. Significantly, the Fe3O4-based nano-fluid emerges as the most efficacious coolant, owing to its superior thermal conductivity in comparison to alternative cooling mechanisms. This notable performance advantage positions Fe3O4 nano-fluid as a promising solution for optimizing the cooling process in PV cells. Moreover, it is noteworthy that the cooling effect demonstrates a positive correlation with the increase in flow rate. This implies that higher flow rates contribute to an augmented cooling effect, further accentuating the advantages of the aforementioned nano-fluids in the context of PV cell temperature regulation.
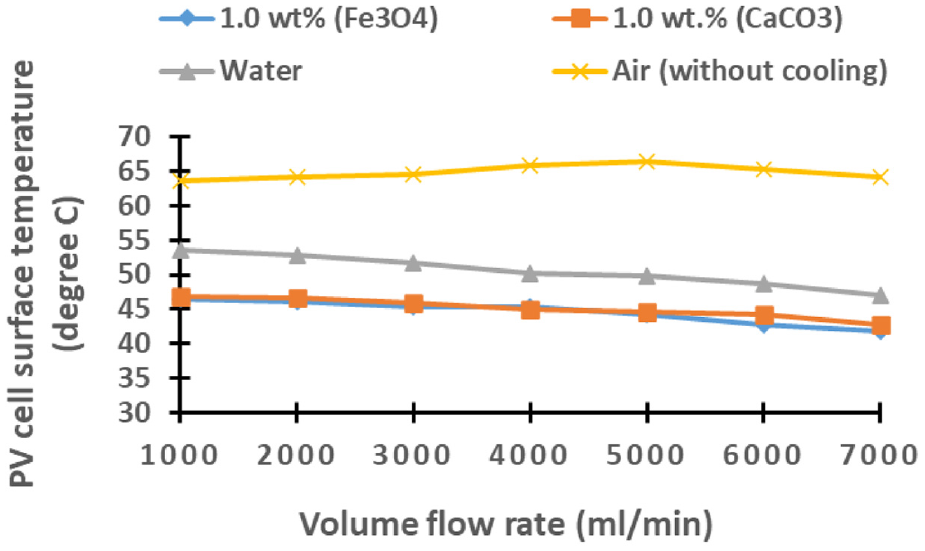
Illustrate the relationship between flow rate and the average PV cell surface temperature with for Fe3O4, CaCO3, water, and air cooling system.
Figure 7 visually presents the percentage reduction in photovoltaic (PV) cell surface temperature achieved through the application of nano-fluids in comparison to the baseline fluid, namely air. The relative PV cell surface temperature, in relation to air, exhibits a discernible trend for both Fe3O4 and CaCO3 nanofluids, and water with values displaying an upward path as flow rates experience increments. Noteworthy trends in the percentage decrease of PV cell surface temperature are evident, particularly with the Fe3O4 nanofluid, showcasing maximum and minimum reduction values of 35.76% and 26.85%, respectively. Similarly, for the CaCO3 nanofluid, the corresponding values stand at 32.44% and 25.26%. In contrast, the percentage decrease values for water range from 26.64% to 15.88% at flow rates of 1000 and 7000 mL/min, respectively. Importantly, it is crucial to highlight the correlation between flow characteristics and the percentage decrease in PV cell surface temperature. As the flow transitions from laminar to turbulent, there is a discernible increase in the percentage decrease in PV cell surface temperature. This observation underscores the dynamic relationship between flow conditions and the cooling efficiency of nano-fluids, offering valuable insights for optimizing PV cell temperature regulation in diverse operational scenarios.

Illustrates the proportion of surface temperature reduction in PV cells achieved by Fe3O4 and CaCO3 nano-fluids compared to the reference fluid, water, across a range of flow rates.
To assess the variation in photovoltaic (PV) cell surface temperature reduction among the three cooling fluids in comparison to the absence of cooling (air), as depicted in Figure 8, a comprehensive analysis was conducted. The findings reveal that, across all considered flow rates, cooling with water consistently yielded the lowest temperature differences relative to no cooling. Specifically, the maximum and minimum temperature differences using water as a coolant were 15.1°C and 10.1°C, observed at flow rates of 1000 and 7000 mL/min, respectively. Conversely, the Fe3O4 nanofluid exhibited the highest temperature differences, with maximum and minimum values of 17.1°C and 20.6°C at flow rates of 1000 and 7000 mL/min. For the CaCO3 nanofluid, the corresponding maximum and minimum temperature differences were 14.9°C and 18.7°C, respectively. These outcomes align with expectations, given the higher effective thermal conductivity of Fe3O4 nanofluid compared to both CaCO3 nanofluid and water. This comparison sheds light on the distinct cooling efficiencies of the three fluids, emphasizing the superior performance of Fe3O4 nanofluid in terms of temperature reduction. The observed temperature differences underscore the importance of considering fluid properties, particularly thermal conductivity, in optimizing cooling strategies for PV cell applications.

Displays the average surface temperature of PV cells in relation to the temperature when no cooling is applied.
Thermal performance of PV cells
Convective heat transfer performance for Fe3O4, CaCO3 nanofluids, and water
Figure 9 presents a comprehensive overview of the dynamic relationship between overall convective heat transfer and fluid flow rate across different cooling mediums, namely Fe3O4 and CaCO3 based nanofluids, as well as water. The graphical representation underscores a discernible trend wherein overall convective heat transfer experiences a notable upswing with escalating flow rates across all cooling mediums under consideration. Notably, the visual depiction unveils a superior heat removal capacity from the cell surface when employing nanofluids in comparison to conventional water-based cooling. Exploring the matter more comprehensively, an in-depth analysis indicates that Fe3O4 nanofluid outperforms both CaCO3 nanofluid and water in terms of achieving the most efficient heat transfer. This can be attributed to the inherently elevated thermal conductivity values exhibited by Fe3O4 nanofluid relative to its counterparts, including CaCO3 nanofluid and water. Moreover, the observed supremacy of Fe3O4 nanofluid is further substantiated by the influence of Brownian motions induced by the nanoparticles dispersed within the base fluids. These detailed motions contribute to an enhanced convective heat transfer performance, consolidating the status of Fe3O4 nanofluid as the optimal choice for maximizing heat transfer efficiency in the context of the studied system.
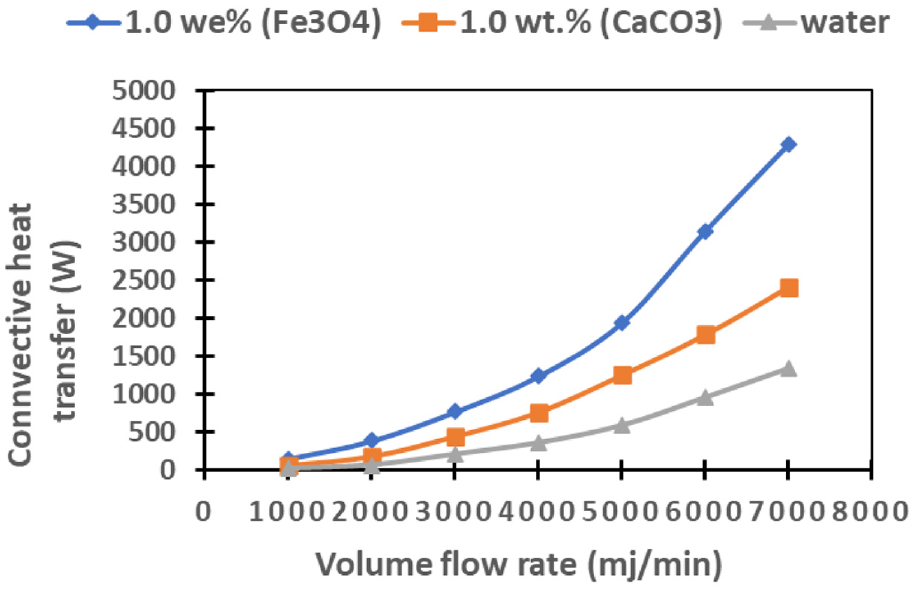
Illustrates the changes in overall convective heat transfer rates across various flow rates for Fe3O4 and CaCO3 nanofluids, as well as water.
Overall heat coefficient performance for Fe3O4, CaCO3 based nano-fluids, and water
The evolving patterns in the alteration of the overall heat transfer coefficient, influenced by changing flow rates for nano-fluids based on Fe3O4 and CaCO3, alongside water, intricately parallel the visual representation in Figure 9. Particularly noteworthy is the discernible surge in values within the turbulent flow regime. Furthermore, aligning with established research, the nano-fluid comprising Fe3O4 consistently manifests elevated heat transfer coefficients compared to its counterparts—CaCO3-based nano-fluid and water. This dissimilarity can be ascribed to the superior thermal conductivity of the Fe3O4 nano-fluid in stark contrast to the CaCO3 nano-fluid and water (Figure 10).

Depicts the alterations in the overall heat transfer coefficient as a function of flow rate for Fe3O4 and CaCO3 nano -fluids, along with water.
Nusselt number performance for Fe3O4, CaCO3 based nanofluids, and water
The graphical representation in Figure 11 elucidates the correlation between the Nusselt Number (Nu) and various flow rates. Notably, the graph vividly portrays a consistent augmentation in the Nusselt number as the flow rates increase across diverse cooling fluids. This observed trend is intricately linked to the transition from laminar to turbulent flow conditions, occurring in tandem with the ascending flow rates. This transition results in a notable amplification of heat transfer rates, consequently leading to a proportional upsurge in Nu values. Moreover, noticeable pattern emerges from the data, indicating that the Fe3O4-based nanofluid outperforms its counterparts in terms of heat transfer rates. This is substantiated by the noticeably higher Nu values associated with the Fe3O4 nanofluid. The rationale behind this noteworthy difference lies in the superior effective thermal conductivity exhibited by the Fe3O4 nanofluid when compared with both the CaCO3 nanofluid and standard water-based cooling fluids. This discrepancy in thermal conductivity underscores the Fe3O4 nanofluid’s capability to facilitate heightened heat transfer rates, thereby contributing to the observed elevated Nu values in the graphical representation.
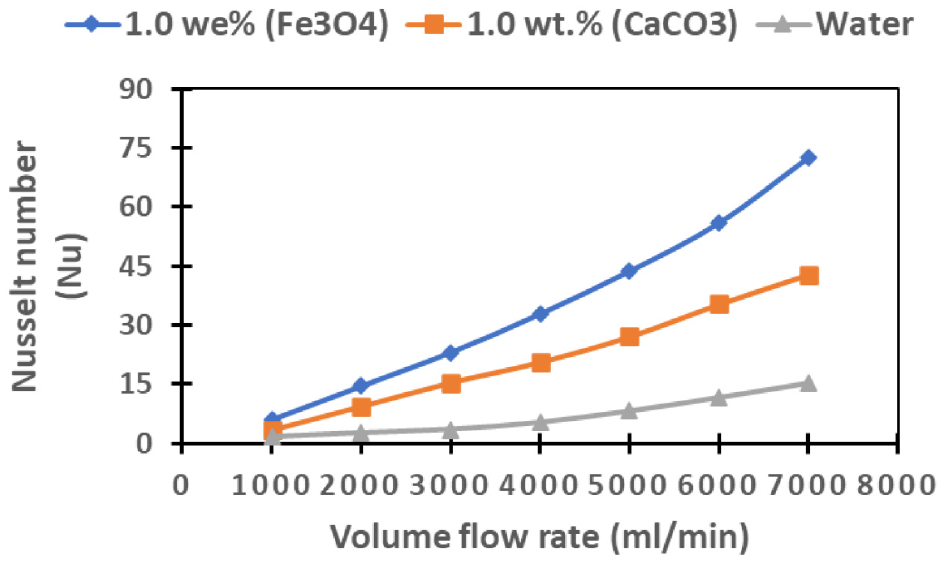
Displays the behavior of the Nusselt number concerning flow rate for Fe3O4 and CaCO3 nanofluids, in addition to water.
In Figure 12, the depicted data illustrates the percentage increases in Nusselt Number relative to water cooling across various flow rates. A prominent trend is observed, indicating a positive correlation between the Nusselt number and flow rates. Notably, the cooling performance of Fe3O4 surpasses that of CaCO3-based nanofluids. Upon closer examination, it is discerned that as flow rates increase, the Nusselt number exhibits a corresponding augmentation. This heightened performance of Fe3O4-based nanofluid is particularly noteworthy, outperforming its CaCO3 counterparts in terms of cooling efficiency. In particular, at flow rates of 7000 and 1000 mL/min, the Fe3O4-based nanofluid demonstrates maximum percentage increases in Nusselt Number of 86.88% and 75.45%, respectively. In contrast, the CaCO3-based nanofluids show maximum percentage increases in Nusselt Number of 74.28% and 50.30% at the same flow rates. This data again underscores the superior cooling capabilities of Fe3O4-based nanofluid, especially evident at higher flow rates.
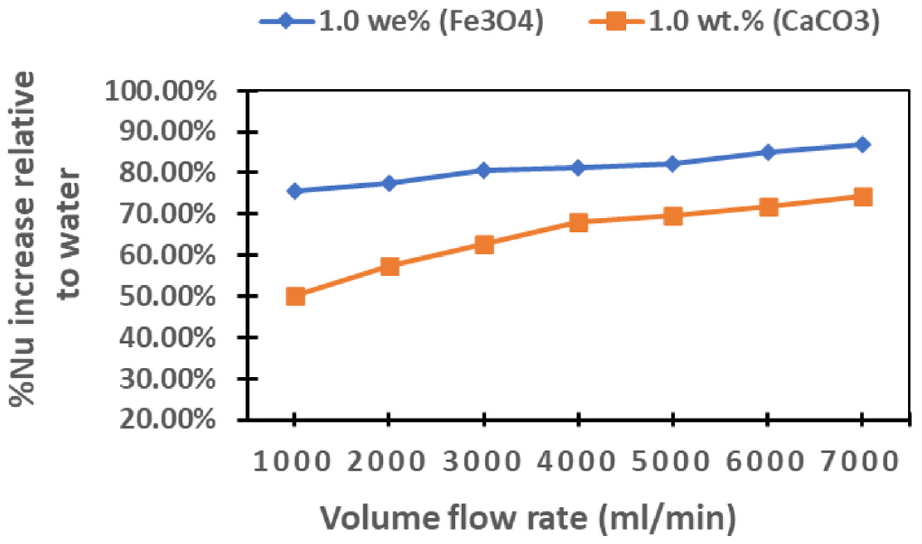
Demonstrates the percentage rise in the Nusselt number as flow rate changes, comparing the performance of Fe3O4 and CaCO3 nanofluids to water cooling.
Electrical characteristics analysis of PV cells
Performance of PV cell power output with flow rates for Fe3O4, CaCO3 nanofluids, and water
The graphical representation in Figure 13 delineates the power output of photovoltaic (PV) cells utilizing Fe3O4 and CaCO3 based nanofluids, as well as water, aligned with the performance of an uncooled cell for comparative analysis. It becomes apparent that the power output experiences a notable ascent with the progressive increase in flow rates for all cooling mediums. Significantly, both Fe3O4 and CaCO3 based nanofluids demonstrate a superior power output for PV cells compared to water and air. This enhanced performance is ascribed to the heightened efficacy of nanofluids in dissipating heat from the cell surface when contrasted with conventional water- and air-cooling methods, a trend also evident in Figure 6.

Depicts how the performance of PV cell power output changes with varying flow rates for Fe3O4 and CaCO3 nanofluids, as well as water.
The percentage increase in PV cell power output, relative to the absence of cooling, is vividly depicted in Figure 14, with the Fe3O4-based nanofluid yielding the highest values across the entire range of examined flow rates. Specifically, at flow rates of 7000 and 1000 mL/min, the maximum and minimum percentage increases in power output for Fe3O4 are 25.13% and 20.75%, for CaCO3 are 16.97% and 10.77%, and for water are 7.15% and 3.73%, respectively. This underscores the substantial impact of the Fe3O4 nanofluid in optimizing PV cell performance, especially evident at higher flow rates.

Illustrates the enhancement in PV power output percentage for Fe3O4 and CaCO3-based nanofluids, as well as water, compared to the scenario without cooling.
Comparison for power of PV cell between various working fluids, Fe3O4 and CaCO3 nanofluids, water, and without cooling at two different flow rates (1000, 6000) mL/min
The temporal fluctuations in power output for Fe3O4 and CaCO3 nanofluids, in comparison with water, are comprehensively depicted at two distinct volume flow rates (1000 and 6000 mL/min), as illustrated in Figures 15 and 16. It is noteworthy that the observed power output trends exhibit a commendable level of consistency across all cooling systems, even in scenarios where no cooling is applied. Furthermore, the temporal aspect of power output is clarified, with maximum power outputs of 26.09, 24.41, 21.82, and 18.72 for Fe3O4, CaCO3, water, and air, respectively, occurring at midday (13:00 h) when solar radiation reaches its zenith, as depicted in Figure 15. In contrast, minimum power output values of 17.70, 15.70, 14.02, and 12.15 are observed at 9:00 h for Fe3O4, CaCO3, water, and air, respectively, when solar radiation is minimal. These values pertain to a volume flow rate of 6000 mL/min. However, at a volume flow rate of 1000 mL/min as shown in Figure 16, the maximum and minimum power outputs at 13:00 and 9:00 h are 25.92, 23.28, 20.88, 18.55, and 18.06, 17.06, 16.07, 14.07 for Fe3O4, CaCO3, water, and air, respectively. It can be concluded that this temporal pattern remains consistent for both volume flow rates, as effectively portrayed in the detailed representations found in Figures 17 and 18. Additionally, a notable pattern emerges, highlighting the consistent superiority of Fe3O4 nanofluid in yielding the most favorable power output outcomes when compared to CaCO3 nanofluid, water, and the non-cooling scenario. This distinctive trend underscores the sustained enhanced performance attributed to the Fe3O4 nanofluid. Moreover, a discernible observation is made regarding the direct relationship between power output and fluid flow rates, as shown in Figures 15 and 16. As fluid flow rates increase, there is a corresponding escalation in power output. Conversely, as anticipated, the PV cell’s least optimal performance is registered in the absence of any cooling mechanism.

Displays the changes in PV power output over time for Fe3O4 and CaCO3 nanofluids, along with water, under a flow rate of 1000 mL/min.
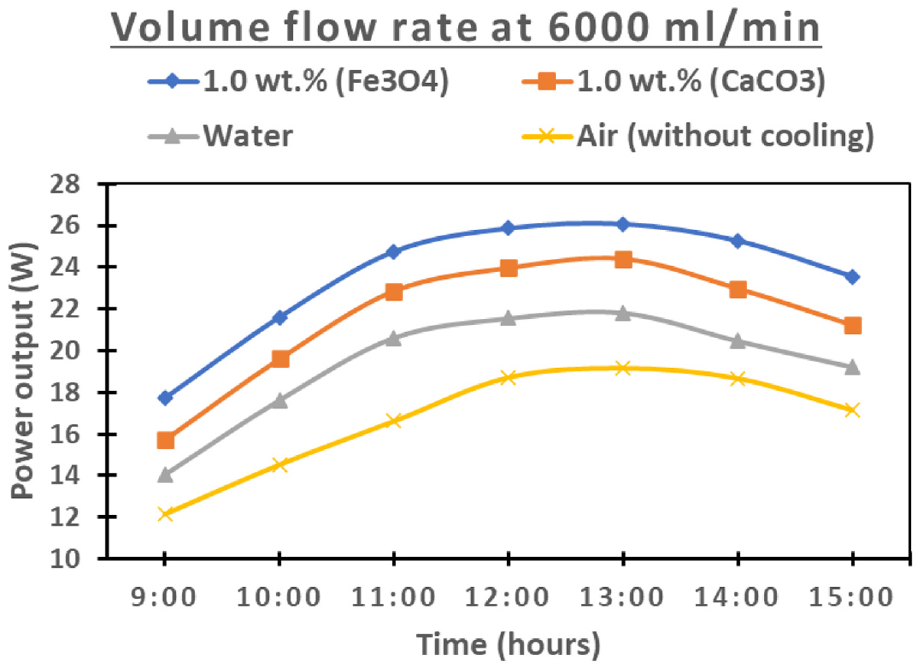
Illustrates the changes in PV power output over time for Fe3O4 and CaCO3 nanofluids, along with water, using a flow rate of 6000 mL/min.

Shows the changes in solar irradiance over time for Fe3O4 and CaCO3 nanofluids, in comparison to water, under a flow rate of 1000 mL/min.

Variation of solar irradiance with time for Fe3O4 and CaCO3 nanofluids, and water at flow rate 6000 mL/min.
Performance of PV cell efficiency with flow rates for Fe3O4, CaCO3 nanofluids, and water
Figure 19 provides a visual representation of the dynamic shifts in PV cell efficiency corresponding to varied flow rates for based nanofluids, along with water. It is noteworthy that the efficiency of the PV cell demonstrates an observable upward trajectory as the flow rates increase across all employed cooling mediums. This notable trend is attributable to the enhanced heat transfer mechanisms, resulting in a consequential reduction in the surface temperature of the PV cell. Consistently, both the Fe3O4 and CaCO3 based nanofluids consistently outperform water and air in terms of PV cell efficiency, with the Fe3O4 nanofluid exhibiting the most superior efficiency values throughout the observed range. This sustained superiority suggests the remarkable impact of these nanofluids on enhancing the overall performance of the PV cell.

Depicts the changes in efficiency output of PV cells as flow rate varies. The comparison includes Fe3O4 and CaCO3 nanofluids, water, and a condition without cooling.
To further elaborate on the significance of cooling, Figure 20 visually encapsulates the percentage increase in PV cell efficiency relative to the scenario with no cooling. Evidently, the Fe3O4 nanofluid stands out by achieving the highest efficiency percentage increase when compared to other cooling mediums. This pronounced effect is consistently observed across the entire range of flow rates. The detailed analysis of percentage increase reveals that, at flow rates of 6000 and 1000 mL/min, the Fe3O4 nanofluid attains the maximum and minimum efficiency percentage increases, with values of 25.23%, 19.73%, 18.31%, 13.00%, and 4.73%, 10.05% for Fe3O4, CaCO3, and water, respectively. This comprehensive exploration underscores the significant role of flow rates and nanofluid type in influencing the overall efficiency of the PV cell under consideration.
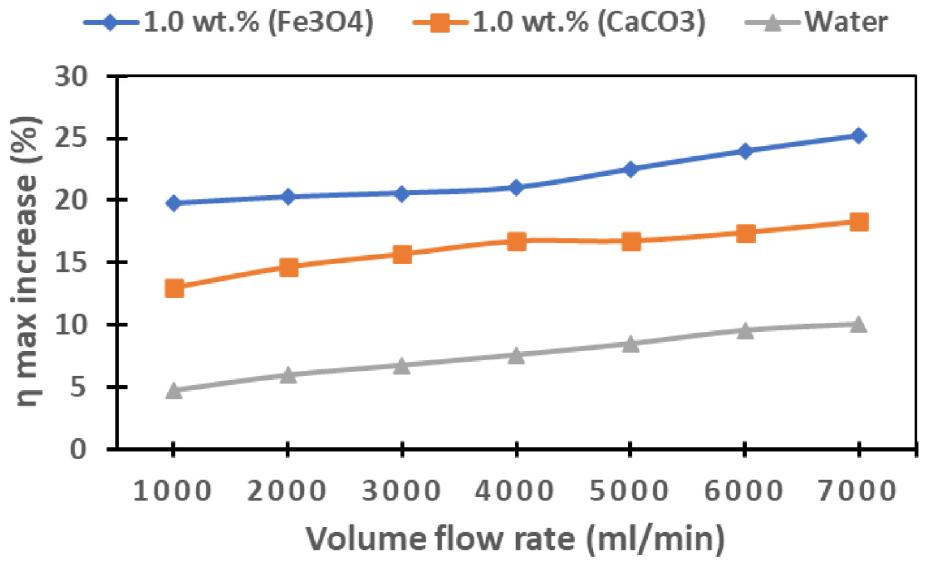
Performance of PV cell efficiency percentage increase for Fe3O4 and CaCO3 nanofluids, and water relative to no cooling.
Comparison for efficiency of PV cell between various working fluids, Fe3O4 and CaCO3 nanofluids, water, and without cooling at two different flow rates (1000, 6000) mL/min
The graphical representation in Figures 21 and 22 depicts the temporal variation of cell efficiency for Fe3O4, CaCO3 nanofluids, and water at two distinct volume flow rates (1000 and 6000 mL/min). The consistent trends in PV cell efficiency are evident across all cooling systems and the scenario without cooling. Notably, among the options of CaCO3 nanofluid, water, and the absence of cooling, the Fe3O4 nanofluid consistently yields the most favorable outcomes in terms of cell efficiency. Moreover, a noticeable observation is that cell efficiency exhibits an upward trajectory in tandem with the increase in fluid flow rates. This positive correlation underscores the influence of flow rates on enhancing PV cell performance. Conversely, the least efficient PV cell performance is as expected when no cooling is applied. The maximum cell efficiency is achieved around midday at 13:00 h, aligning with the peak solar radiation (Qrad), while the minimum cell efficiency is observed at 9:00 h when solar radiation reaches its minimum. This consistent temporal pattern holds true for both volume flow rates, as meticulously illustrated in Figures 17 and 18, further emphasizing the reliability and replicability of these observations.

Illustrates the fluctuation of PV cell efficiency over time for Fe3O4 and CaCO3 nano-fluids, as well as water, at a flow rate of 1000 mL/min.

Displays the changes in PV cell efficiency over time for Fe3O4 and CaCO3 nano-fluids, along with water, at a flow rate of 6000 mL/min.
Conclusion
An experimental investigation was conducted to examine the cooling of PV panels using ferro magnetite (Fe3O4), calcium carbonate (CaCO3) based nanofluids at a concentration of 1 wt%, as well as water and natural air. The study encompassed flow rates ranging from 1000 to 6000 mL/min. The experiments were conducted outdoors under real conditions, leading to the following noteworthy conclusions:
a. The introduction of nanoparticles notably improved the cooling effectiveness of PV panels compared to water and air cooling methods. Among the options, the Fe3O4 nanofluid exhibited the most significant enhancement in heat transfer.
b. PV cell surface temperature rises with flow rates for Fe3O4, CaCO3 nanofluids, and water, indicating percentage temperature reductions relative to air cooling. Fe3O4 nanofluid shows 35.76% and 26.85% reductions, CaCO3 nanofluid exhibits 32.44% and 25.26%, and water decreases from 26.64% to 15.88% at 1000 and 7000 mL/min. The shift from laminar to turbulent flow underscores the crucial correlation between flow characteristics and percentage temperature decrease, emphasizing the dynamic relationship with nanofluid cooling efficiency and providing insights for PV cell temperature optimization.
c. Enhanced volume flow rates led to improvements in convective heat transfer performance, overall heat transfer coefficient for the Fe3O4 and CaCO3 nanofluids, as well as water, in contrast to natural air cooling. This can be attributed to the inherently elevated thermal conductivity values exhibited by Fe3O4 nanofluid relative to its counterparts, including CaCO3 nanofluid and water. Moreover, the observed supremacy of Fe3O4 nanofluid is further substantiated by the influence of Brownian motions induced by the nanoparticles dispersed within the base fluids. These detailed motions contribute to an enhanced convective heat transfer performance, consolidating the status of Fe3O4 nanofluid as the optimal choice for maximizing heat transfer efficiency in the context of the studied system.
d. It is discerned that as flow rates increase, the Nusselt number exhibits a corresponding augmentation. This heightened performance of Fe3O4-based nanofluid is particularly noteworthy, outperforming its CaCO3 counterparts in terms of cooling efficiency. In particular, at flow rates of 7000 and 1000 mL/min, the Fe3O4-based nanofluid demonstrates maximum percentage increases in Nusselt Number of 86.88% and 75.45%, respectively. In contrast, the CaCO3-based nanofluids show maximum percentage increases in Nusselt Number of 74.28% and 50.30% at the same flow rates. This data again underscores the superior cooling capabilities of Fe3O4-based nanofluid, especially evident at higher flow rates.
e. Results showed that the power output experiences a notable ascent with the progressive increase in flow rates for all cooling mediums. Specifically, at flow rates of 6000 and 1000 mL/min, the maximum and minimum percentage increases in power output for Fe3O4 are 25.13% and 20.75%, for CaCO3 are 16.97% and 10.77%, and for water are 7.15% and 3.73%, respectively. This underscores the substantial impact of the Fe3O4 nanofluid in optimizing PV cell performance, especially evident at higher flow rates.
f. The efficiency of the PV cell demonstrates an observable upward trajectory as the flow rates increase across all employed cooling mediums specifically at flow rates of 6000 and 1000 mL/min, the Fe3O4 nanofluid attains the maximum and minimum efficiency percentage increases, with values of 25.23%, 19.73%, 18.31%, 13.00%, and 4.73%, 10.05% for Fe3O4, CaCO3, and water, respectively. This comprehensive exploration underscores the significant role of flow rates and nanofluid type in influencing the overall efficiency of the PV cell under consideration.
g. The most optimal electrical performance of PV cells (power and efficiency) was achieved using the Fe3O4 based nano-fluid. This outcome can be attributed to the higher thermal conductivity of nano-fluids compared to water and air.
Footnotes
Acknowledgements
Additionally, the authors would like to acknowledge and appreciate the ongoing support provided by Philadelphia University, AlBalqa Applied University, Wathba Investment Company, and the University of Bath.
Handling Editor: Chenhui Liang
Declaration of conflicting interests
The author(s) declared no potential conflicts of interest with respect to the research, authorship, and/or publication of this article.
Funding
The author(s) disclosed receipt of the following financial support for the research, authorship, and/or publication of this article: The authors extend their heartfelt gratitude to the Royal Academy of Engineering (UK) and the Higher Council for Science and Technology (Jordan) for their generous funding of this project.