
Abstract
The water pump is a piece of crucial electromechanical equipment to ensure the safety of tunnels. Therefore, it’s essential to master the performance trend of pumps to prevent the occurrence of failure. In this paper, essential information and failure records of pumps in 15 operating tunnels for many years were collected. According to the data characteristics, a data-filling model based on XGBoost is developed to address the issue of the censored data. Considering that most pumps are still in operation, a failure prediction model based on Random Survival Forest (RSF) is designed by incorporating survival analysis principles. The proposed Pump Failure Trend Prediction Model (PFTPM) overcomes difficulties caused by the lack of previous data and the small number of old pumps. We identify two phases of failure: the first phase exhibits a bathtub-shaped failure rate curve, while the second phase is characterized by a lower failure risk. The importance of considering rainfall, pump operating time, and performance changes for effective maintenance planning is emphasized. Furthermore, we summarize the failure evolution law of various types of pumps to amend maintenance cycle in the existing specification. Overall, this paper integrates innovative big-data technologies into the traditional maintenance data of tunnel pumps.
Introduction
The pump plays an important role in the safe operation of the tunnel. Because of the low terrain, once the water pump fails, the tunnel can cause serious accidents such as ponding or flooding during the rainy season or rainstorms, which seriously affects the tunnel’s safety. For example, in April 2013, a drainage pump in an underground tunnel in Zhuhai failed, causing water to accumulate in the tunnel, forcing cars to stall, and causing traffic accidents. Therefore, it has become a hot research topic to study the law of pump failure and reasonably arrange the pump maintenance and repair plan.1–3
The failure mechanism method establishes a physical model from the perspective of the causes of equipment failure to reflect the performance change of the equipment. Orsagh et al. 4 combined the Totaro model and the crack propagation model to establish a full-lifecycle failure prediction model for bearing components. On the basis of studying the displacement efficiency and wear degradation of the axial piston pump, Guo et al. 5 put forward a life prediction model based on the Weibull distribution. Failure mechanism models have high prediction accuracy, but the methods are highly targeted and hard to extend to other devices.
Data-driven approaches are mainly implemented by artificial intelligence (AI) methods, such as neural networks and support vector machines (SVM), which are widely used in fault diagnosis 6 and condition-based maintenance. The former is broadly used for utilizing data from multiple sensors to achieve multiple fault warnings,7,8 while the latter is more conducive to preventive maintenance decisions in advance. Cui et al. 9 applied the autoregressive integrated moving average model (ARIMA) and long-short-term memory recurrent neural networks (LSTM) to create a prediction method that has a better effect on the performance trend prediction of aircraft hydraulic pumps. Dai et al. 10 use fuel pump data to forecast the degradation trend of airborne fuel pumps based on the singular value trend decomposition, using an algorithm combining the least squares support vector machine (LSSVM) and particle swarm optimization (PSO). Kimera and Nangolo 11 use the SVM to predict terminal pump failure trends, pointing out that the quality and quantity of historical data sets significantly impact forecast accuracy.
Data-driven approaches show unique advantages, but they are highly dependent on data integrity. On the one hand, AI algorithms can be applied more widely and quickly without a physical model as long as collecting data. 12 On the other hand, their performance depends on the data. The absence of data limits the effectiveness of feature extraction, 13 resulting in poor model training and ultimately affecting the accuracy of prediction results.
However, due to the management level of the tunnel operation and maintenance enterprise, the data of many pumps are not available at the initial stage of operation, and maintenance data is seriously missing. In addition, most of the tunnel life is not long, many pumps have not yet reached the scrapping stage, and there is little data on pump failures for more than 10 years. Therefore, the tunnel water pump’s historical failure data has both left and right censoring, bringing substantial obstacles to failure trend prediction.14,15 If censored data is not considered, the predicted results will have a notable deviation. 16 Nevertheless, the existing research does not consider the censored characteristics of fault data collected in practice, so how to fully overcome the problem of censored data and design the performance prediction model of the water pump is the focus and difficulty of the research.
The processing of censored data is divided into two types. One is the data-filling method, such as substitution, standard statistical routines, various filling methods, and parameter estimation.17–19 Alrumayh et al. 20 used a Bayesian estimator to estimate the distribution and the parameters of the reliability function, which was verified on multiple datasets with censored samples. When there are few missing values, these kinds of operations are simple and popular, but in the case of numerous unknown data, they may lead to low accuracy of prediction. 21 Regardless, there are problems such as significant filling errors, long consumption time, and challenging selection of data distribution. The other one is reducing the impact of censored data on model performance through model design. For example, the survival analysis method has certain advantages in dealing with right-censored data. Hsieh and Chen 22 proposed a two-stage redistribution algorithm to estimate the survival function of failure time under the current state with independent censored data. Mukherjee et al. 23 improved the Weibull survival model to solve the problem of right-censored data, thus improving the robustness of research results. In addition to the Weibull distribution model, traditional survival analysis methods such as Kaplan-Meier estimation and Cox proportional hazard model can also meet the basic needs of censored data prediction.24–27 However, their advantages are not apparent in processing high-dimensional data which has a heavy censoring rate.28,29 With the development of machine learning, because of their minor initial restrictions, this kind of method has gradually been applied to censored data filling and prediction. Compared with previous methods, the Random Survival Forest (RSF) method has several unique advantages. Firstly, it does not involve the traditional survival analysis method, thus its performance is much better on high-dimensional data, 30 avoiding the problem of over-fitting. Secondly, the RSF is based on the voting results of most trees, which is insensitive to outliers and has high robustness.31,32 Finally, it does not require complex parameter optimization and shows excellent interpretability. 33 Thus, RSF can meet the requirements of pump data analysis.
This paper combines the idea of survival analysis and machine learning. It establishes the failure prediction of water pumps to overcome the shortcomings of traditional methods in censored data processing and prediction and improve prediction accuracy.
The rest of this article is organized as follows. Section 2 describes the methodology and procedures used to conduct the failure trend prediction model of the tunnel water pump. Section 3 analyzes the characteristics of data collected by water pumps. Section 4 incorporates the tunnel water pump data into the proposed failure trend prediction model and compares other models to prove the effectiveness of the prediction models. Section 5 applies the model to numerical studies and some suggestions are given for the maintenance and management of pumps in the tunnels. Finally, the conclusion of this paper and future work is in Section 6.
Methodology
Feature extraction based on Spearman correlation and VIMP
Feature extraction is essential for constructing relevant features from the original collected data, thereby improving model efficiency. This study used Spearman correlation analysis and Variable Importance (VIMP) to capture the relationships among features and between features and the target variable.
When analyzing feature relationships, Spearman correlation analysis is a non-parametric measure that assesses the multicollinearity between variables, making it suitable for analyzing both continuous and categorical variables simultaneously.
VIMP is widely used in various machine learning techniques to evaluate the contribution of variables to the prediction of the target variable. It assesses the extent to which the model’s predictive accuracy changes when variables are randomly removed or rearranged. For a variable X, out-of-bag (OOB) samples are put into the in-bag survival tree, and a daughter node is randomly assigned to it whenever the split for X is encountered. After that, each tree’s cumulative hazard function (CHF) is calculated and averaged. The VIMP for X is equal to the original ensembles’ prediction error subtracted from the new ensembles’ prediction error obtained by randomizing X assignments.
Data filling model based on XGBoost
Due to the low level of early information management, some data is missing previous fault records. Effectively filling in the missing data is beneficial for ensuring the accuracy of fault trend prediction. However, determining the data distribution is challenging. Machine learning techniques, which are not limited by data distribution assumptions, are increasingly being used for filling the left-censored data. Extreme Gradient Boosting (XGBoost) is a tree-based integrated learning method, 34 which can realize regression and classification and is widely used in device fault diagnosis and prediction.35–37 It has powerful advantages, such as fewer hyperparameters, 38 higher training performance of imbalanced data sets, 36 and fast calculation speed. 37 Wang et al. 39 applied XGBoost to predict the fault of the fan bearing. Zhang et al. 40 combined random forest and XGBoost for failure detection of offshore fans, and the results showed that the model was robust to fans under different working conditions. Therefore, we transform the early data deficiency into a dichotomic problem of fault diagnosis and use the XGBoost algorithm as a prediction model to fill the censored data.
Failure trend prediction model based on RSF
Combined with the results of key feature extraction and the calculation principle of the random survival forest algorithm (Figure 1), the modeling process of failure trend prediction based on RSF is as follows.

Random survival forests algorithm diagram.
The calculation principle of RSF algorithm
First, the original data set is subjected to bootstrapping, where a random sample of B bootstrap samples is drawn with replacement. On average, each bootstrap sample excludes 37% of the original data as OOB data, which is used as the testing sample for the RSF model. Secondly, for each bootstrap sample, a binary recursive survival tree is constructed. At each tree node, a random selection of P variables is considered for splitting, and the variable that maximizes the survival difference among the child nodes is chosen. Thirdly, the trees are allowed to grow to their maximum extent until the sample size in each terminal node is equal to or greater than the specified minimum default value. Fourthly, the cumulative hazard function (CHF) is calculated for each tree, and the average of the CHFs from all trees is considered as the CHF for the overall forest. Finally, the prediction error of the overall CHF is computed using the OOB data.
There are four parameters that need to be optimized in the RSF model. First, the parameter of
Cumulative hazard function and failure rate
Assume that the pump data is
It is assumed that

Since the pump

Formula (2) is the CHF from a tree. To calculate the overall CHF, it is necessary to average


Pump Failure Trend Prediction Model
The model framework is shown in Figure 2 to provide a visual representation of the key steps and components involved in our proposed Pump Failure Trend Prediction Model (PFTPM). PFTPM includes five steps: data preprocessing, creation of the feature extraction model based on VIMP, creation of the data filling model based on XGBoost, creation of the failure trend prediction model based on RSF, and pump failure trend analysis as well as management insights.

Failure trend prediction process.
Data collection and analysis
Data collection
The pump is a piece of complex mechanical equipment with various types and characteristics under different working conditions. Service performance degradation is often the result of a combination of factors. For example, temperature, equipment operating parameters, load, surrounding working environment, and other characteristics are important factors affecting the service performance of water pumps. According to the operating mechanism of pumps, inappropriate operating parameters and loads can increase the pressure on hydraulic components, while adverse working environments can lead to pump clogging. These factors accelerate the aging and failure of pumps to varying degrees. Therefore, in modeling equipment failure trends, it is often necessary to consider the influence of multiple factors.
In the data collection phase, this study particularly focuses on ensuring the adequacy of variables. Due to technical limitations, certain factors such as temperature and vibration data are unavailable due to the lack of sensor devices and data storage equipment in traditional maintenance modes. Through communication with experts in tunnel equipment operation, we ensure that the collected variables adequately cover the pump failure characteristics and that the data is obtainable, ensuring the effectiveness of subsequent analysis and research. In this paper, the basic information of 602 pumps from 15 tunnels in service in Shanghai and Hangzhou and the available historical fault data are collected, including primary equipment data, fault maintenance feature data, and climatic conditions feature data. The relevant parameter variables are shown in Table 1. A pump data collection form has been designed, listing all variables and their definitions as presented in Table 1. The form was provided to the tunnel operating company for completion. In addition, a thorough investigation of the equipment’s historical records was conducted to ensure the integrity and accuracy of the provided data.
Data feature parameter variables.

Feature analysis
Comparing the actual service life of each pump with the years of data recording (Figure 3), we found that only two of the pumps in the 15 tunnels started recording failure data when they were put into service. Many of the pump failure records were incomplete. Thus, pump failure data is generally characterized by missing left-hand data, so filling in missing data values is essential. In addition, since the deadline for observing pump failure data in this paper is December 31, 2021, the vast majority of the pumps are still in use and have not reached the end-of-life stage. Therefore, the pump data has left and right censoring characteristics.

Pump data characteristics analysis.
Table 2 presents the basic statistical results of the continuous variables. In the fundamental parameters of pumps, it can be observed that the lift and power are significantly lower than the mean and standard deviation of the flow, indicating a larger variability in flow compared to the relatively smaller variability in lift and power. Regarding the climatic condition factors, the annual minimum and maximum temperatures exhibit relatively higher stability in comparison to the annual accumulated precipitation.
Basic statistical results of the continuous variables.

Case study
Data preprocessing
According to different data types, we take different processing methods. For example, continuous variables

Feature extraction
In order to eliminate redundant features and preserve those features that are relevant to the predicted target, the study explores the correlations among features and between features and the target variable. First of all, to address the issue of multicollinearity among features, a correlation analysis is conducted to capture the relationships among features. Given the presence of both continuous and categorical variables in the collected features, Spearman correlation analysis is employed in this study, and the results are depicted in Figure 4. The heatmap reveals a strong correlation of 0.83 between the variables Lift and Power, indicating the need to remove one of them to enhance the stability of the constructed model.

Spearman correlation analysis.
Next, the paper further determines which variable to delete by prioritizing those that exhibit significant correlations through VIMP. 30 VIMP is a feature extraction method in the random survival forest. A variable’s VIMP value is a high positive value, indicating that the variable dramatically impacts the pump failure trend. Otherwise, it has a weak impact on the pump failure trend.
Based on the 12 types of feature data collected in Section 2.1, nine key features, including tunnel in service, pump type, manufacturer, flow, lift, power, service age, total precipitation, and failure time, are extracted by the VIMP method. The rank and importance of each feature are shown in Table 3. It can be observed that the VIMP value of the variable Power is greater than the variable Lift, so Lift is removed to avoid multicollinearity between variables. The VIMP values of the remaining eight key features are all >0, which indicates that they have a specific impact on the pump failure trend. The pump’s service life ranks first, followed by the total precipitation, demonstrating that the service life of the pump and the local rainfall are highly correlated with the failure trend of the pump.
VIMP analysis.

Data filling
Considering that pump failure is closely related to its characteristics and usage, pump type, flow, power, total precipitation, service age, previous failure times, manufacturer, and service tunnel are input variables. The failure status (whether the water pump has failed) in a specific year is an output variable. The left-censored data-filling model is established by formula (6):
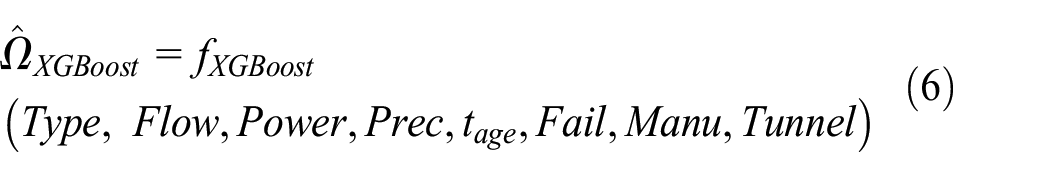
Where,
In this paper, the water pump failure data of seven tunnels, such as the Beidi Road tunnel and Jiaohuan tunnel, were selected as training sets. Failure data has been recorded for these pumps since the tunnels started in service. In addition, the model replenishes the missing data on early pump failures, which is applied to fill the left-censored fault data of the remaining 602 pumps of eight tunnels.
Failure trend prediction model
The input data is the characteristic information
If
If

Calculation method of failure time and examination results.
After converting the data of 602 water pumps into input data based on their service age, the dataset consists of 2087 samples. Subsequently, these samples are allocated according to a specified proportion. The training and validation sets are assigned 70% of the total samples and are utilized for model training. The validation set is further divided during the process of k-fold cross-validation, serving the purpose of optimizing model parameters and mitigating overfitting. The remaining 30% of the samples constitute the test set, which is employed to evaluate the predictive performance of the model. Consequently, the data distribution yields a training set with a sample capacity of 1169, a validation set with a sample capacity of 292, and a test set with a sample capacity of 626.
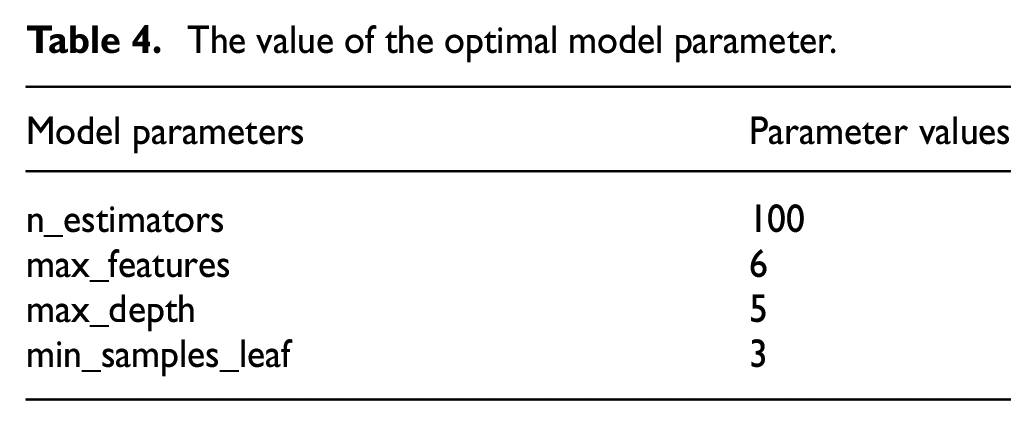
The random grid search method is employed to optimize parameters and perform cross-validation within a specified parameter space, ultimately resulting in the identification of the optimal parameter configuration, as shown in Table 4.
The value of the optimal model parameter.
Model performance evaluation
We evaluate the prediction effects of the data-filling model and failure prediction model, respectively. The former uses three common evaluation indicators, while the latter compares the predicted concordance index (C-index) with the traditional survival analysis model.
Data filling model
To analyze the validity of data filling, this paper selects


Where
The evaluation results of the model are shown in Table 5.
Model evaluation results.

Failure prediction model
The pump data set is trained by the Cox proportional hazards (CPH) model and the random survival forest (RSF) model, respectively. The advantage of the CPH model is that it does not need to make any specific probability distribution assumption for baseline survival time, so it has become one of the statistical methods widely used in survival analysis. 41 It is commonly used in research to quantify the degree of influence of covariable on equipment failure and the probability of survival event occurrence at each time point. 42 Harrell consistency index (C-index) 30 is used to compare the prediction errors of the two models, and the probability that the predicted results are consistent with the actual results is estimated. The C-index is calculated as follows:
First, all samples are paired to generate all possible data pairs in the data.
Secondly, if the failure time of pump A in the data pair is earlier than that of pump B, but the data of pump A is censored, delete the data pair. If the failure time of the data pair is the same and the data pair is censored, delete the data pair, too. The remaining number of data pairs is recorded as
Thirdly, for each data pair: we suppose that the failure time of pump A is
Fourthly, calculate the C-index, as shown in formula (10).

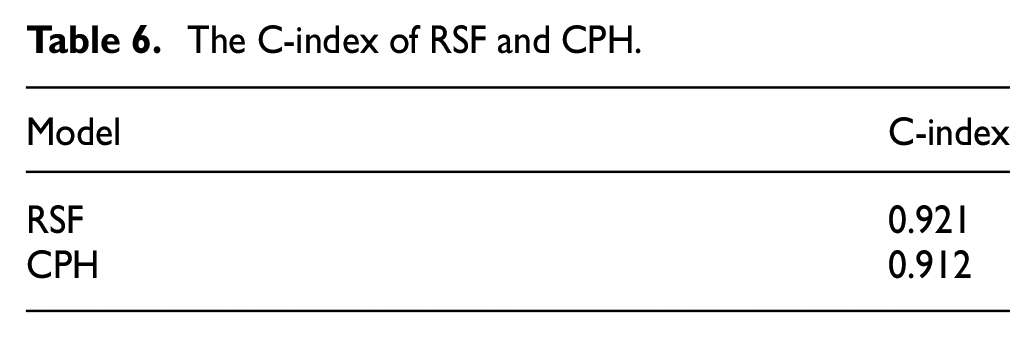
As shown in Table 6, the results prove that the prediction accuracy of the XGBoost-RSF model is higher than that of traditional survival analysis methods, which confirms that the model proposed in the paper is effective.
The C-index of RSF and CPH.
Discussion
Results analysis
A data-driven model based on censored data interpolation is established to predict the failure trend of pumps in the tunnel. Some insights are provided for formulating pumps’ maintenance strategy. The general failure rate curve and cumulative hazard curve of pumps are shown in Figure 6(a) and (b). The general failure law of the water pumps is divided into two stages: the first 10 years is the first stage, which presents characteristics of the bathtub curve. The failure rate exceeds 10% in the second year, and the following 6 years are at a low level of failure risk, which means that the first 2 years are in the run-in period when pumps are put into use. It reaches the peak failure rate in the 10th year, meaning pumps are in the wear and tear failure period, which is not conducive to maintaining stable tunnel operation. Then it comes to the second stage in the 11th to 18th years, which presents a yearly decreasing trend. This is because in the actual engineering situation, the pumps are usually dismantled and parts replaced in the 11th year, which dramatically enhances the performance of the pumps.

Water pumps’ fault trends. (a) General failure rate curve and (b) cumulative hazard curve.
Figure 7 shows the failure curves of various pumps with the age of service. Figures 8 and 9 illustrate the failure rates of four kinds of them within the first 10 years and after the 11th year, respectively. From these three graphs, there is a certain pattern of differences between the different sorts of pumps.
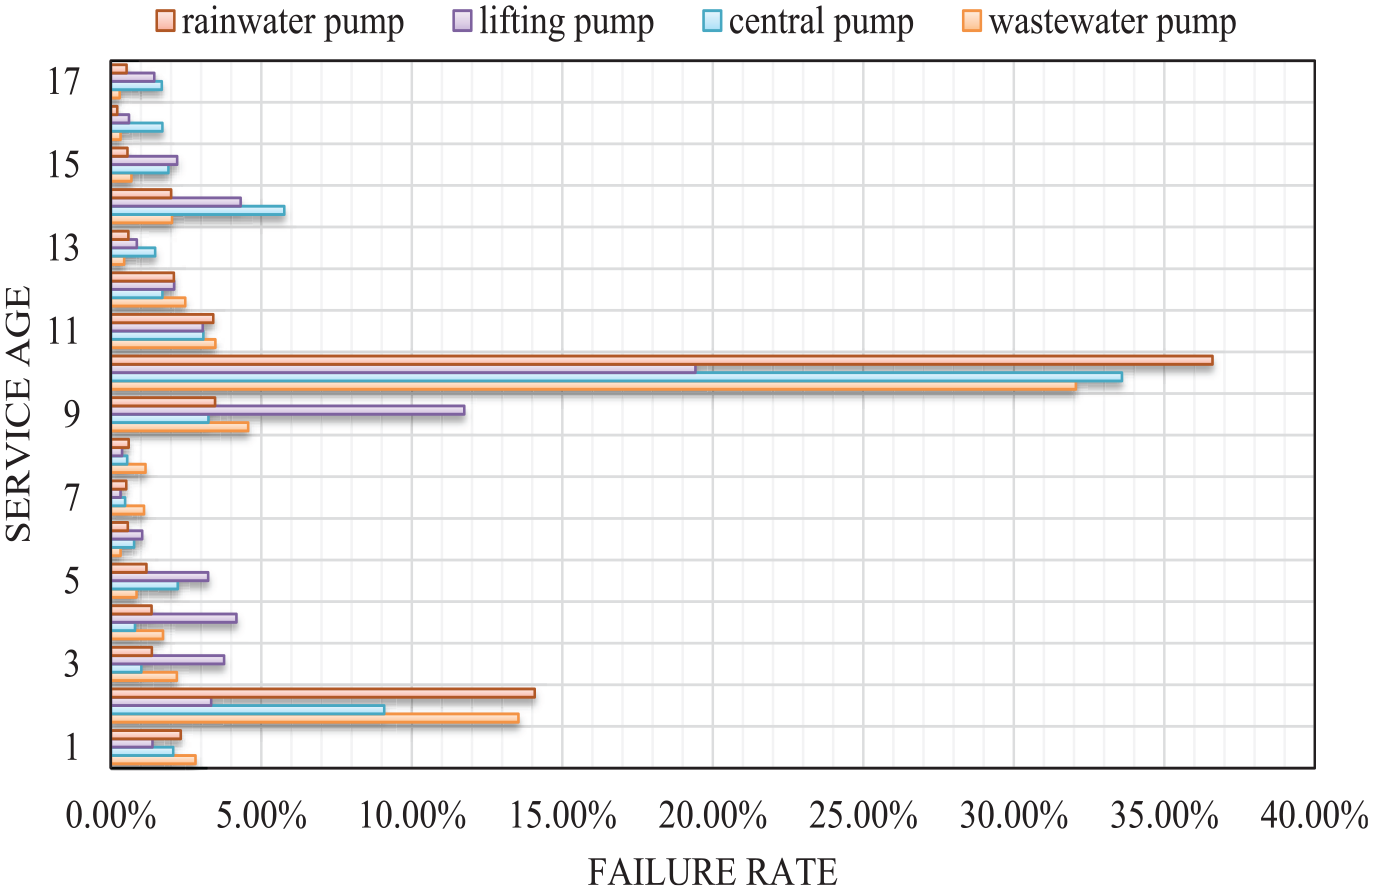
Failure curves of various pumps.
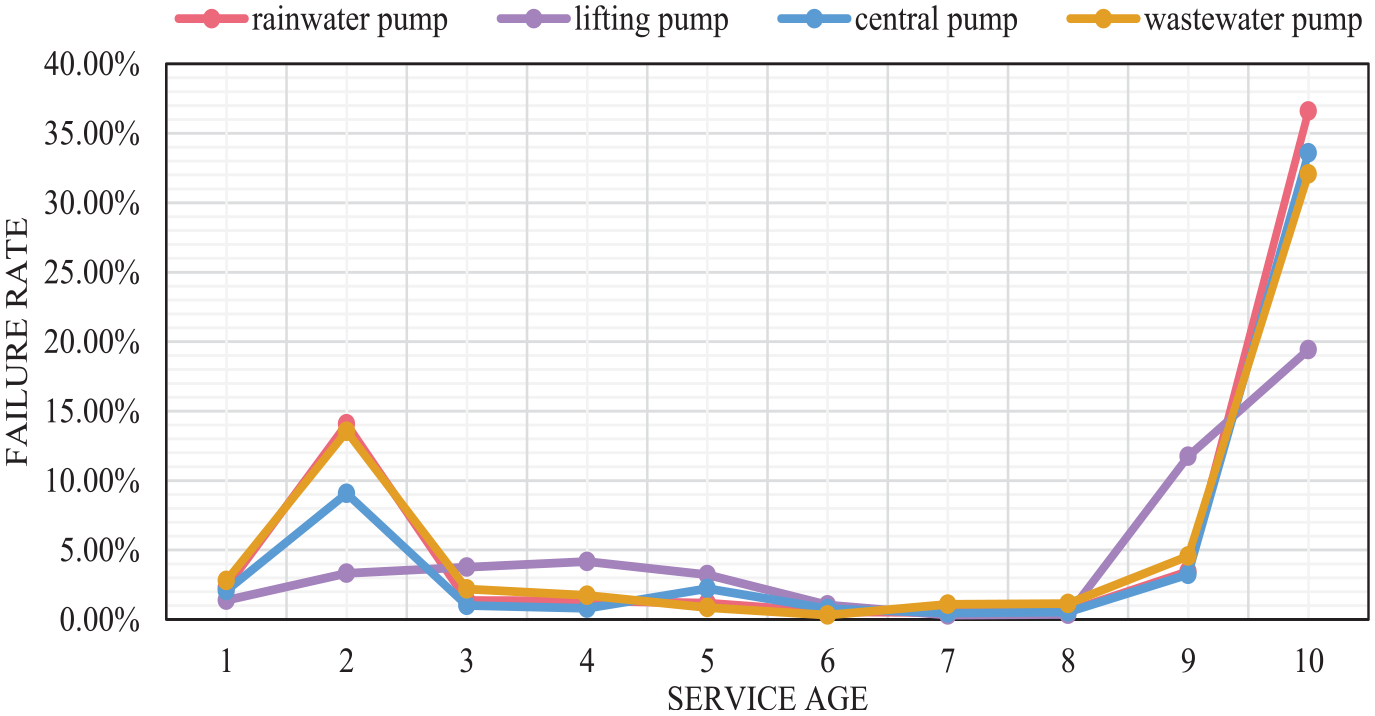
Failure trends of four kinds of water pumps from 1 to 10 years.

Failure trends of four kinds of water pumps from 11 to 18 years.
Wastewater pumps are the category of pumps with higher failure rates in the first 2 years and the seventh to ninth years. In the second stage, they are at a bit lower failure rate. In contrast, the central pumps are more prone to failure in the second stage of service periods, as evidenced by the higher failure rate of this pump category in the 13th to 18th years. The lift pumps have a lower peak failure rate than any other class of pumps, for example, the failure rate in the 10th year is only 19.42%, while the next lowest failure rate is 32.02%. Not only that, but it also did not show a significant increase in the second year, indicating that it has a shorter break-in period. So, the lift pumps can be put into service quickly and can maintain better operational performance during the same service period.
The figures also reflect that the failure rate curves of the rainwater pumps and the wastewater pumps follow a similar trend. However, the peak of the rainwater pumps in the 10th year is the highest. Combined with the characteristic VIMP it can be found that the service life and precipitation of the rainwater pumps are strongly correlated with the failure rate. In years with high precipitation, the rainwater pumps will have a higher probability of failure due to excessive workload.
In addition, basic pump information, failure records, and environmental and meteorological information are incorporated into the model input. The verified model helps managers to better understand the relationship between pump failure and its factors and causes (type, climate, service age, etc.) so that they can take action in advance. It is worth reminding managers that they should adapt the characteristics of the input to apply in similar situations.
Finally, our model has obtained the failure trend of the overall water pumps and the change in the failure rate of various types of pumps. By analyzing the results, the paper has provided the corresponding scientific maintenance management insights that can help the pumps in the tunnel to maintain good performance in the long-term operation process. We also have created a platform for research applications that can be referenced. This visualization pathway can greatly improve management efficiency. Therefore, the practical value of this study lies in providing opportunities for preventive maintenance of water pumps, minimizing the negative impact of water pump failure on the running state of the tunnel, reducing the time of road closure maintenance operations as much as possible, and ensuring that the tunnels, as a key infrastructure in the field of transportation, will generate lasting economic, social and security benefits.
Management insights
Basic pump information, failure records, and environmental and meteorological information are incorporated into the model input. The verified model helps managers to better understand the relationship between pump failure and its factors and causes (type, climate, service age, etc.) so that they can take action in advance. Firstly, managers should plan for preventive maintenance as early as possible before peak failure periods. In practice, pumping equipment is returned to the factory in batches for maintenance. The results of this paper can be used as a source of maintenance decision support for tunnel managers and can help them decide on the sequence of maintenance to avoid potential pump failures. Secondly, this paper suggests that there is a close relationship between precipitation and rainwater pump failure events. Hence managers should carry out pump inspections in advance in accordance with weather forecasts to eliminate pump failures that cause waterlogging during periods of heavy precipitation. Thirdly, Maintenance work of water pumps should consider the characteristics and trends of pump performance changes, rather than determine a fixed cycle. 43 The maintenance plan adopted in practical projects focuses on the cycle from the fourth to the sixth year. Although this is helpful in decreasing the failure rate of the pumps, it can be seen from the calculation results that the maintenance time is not in the critical years before the equipment is prone to failure. Hence, its effect on reducing the failure rate is limited.
Following the proposed research model in this paper, we designed a digital display interface (Figure 10) and a decision aid interface (Figure 11) for the visualization of pump failure records. The number of pumps and pump types is visualized in the data center through a pie chart. Non-continuous historical pump failure information can also be clearly viewed here. In the decision aid section, managers can schedule preventive maintenance in advance with the help of future failure trends of overall and individual pumps based on the RSF prediction model. Because each pump has a unique number, this maintenance advice is more targeted and actionable.

Water pumps data center interface.
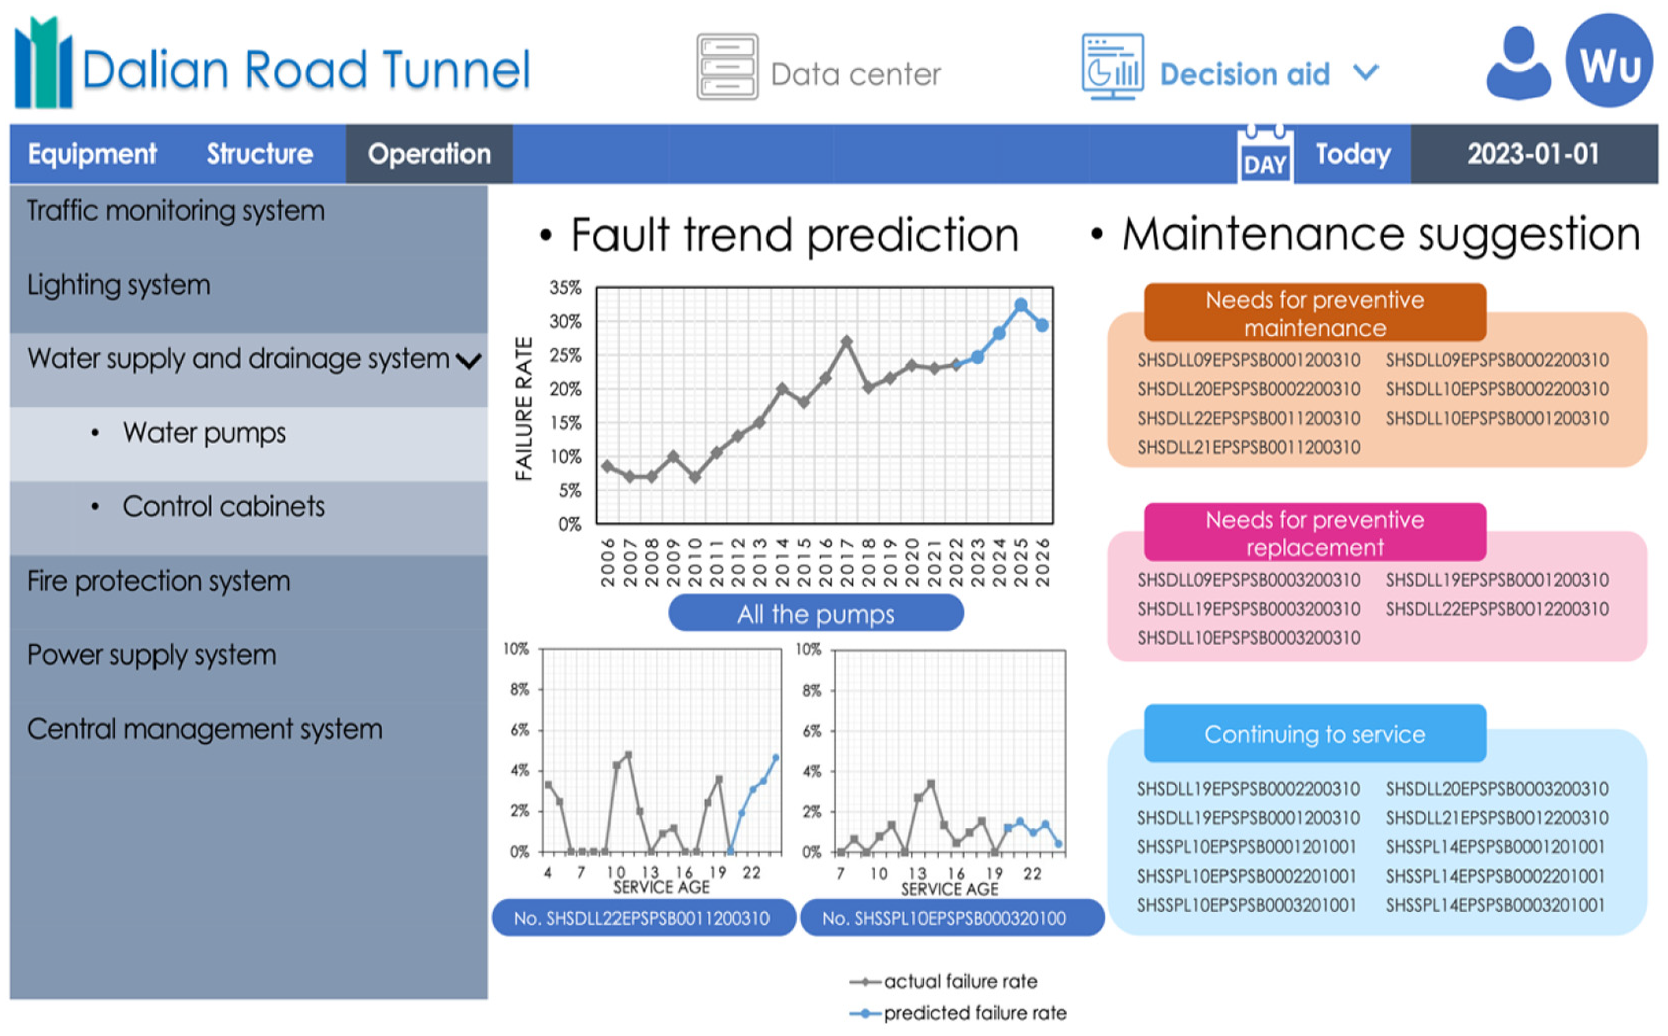
Water pumps decision aid interface.
Conclusions
This paper establishes a failure trend prediction model to master the malfunction law of pumps in tunnels. Our work collected and sorted out the basic information, fault records, and environmental and meteorological information of pumps, among which the fault data was manually recorded and found to have serious censored characteristics. In this paper, a failure prediction model based on XGBoost in the early stage and discontinuous failure period is established, which solves the left-censored problems of water pump data in some old tunnels and provides digital support for subsequent failure trend prediction. On the other hand, considering that most of the tunnel equipment is still in service, our model draws lessons from the idea of survival analysis and designs the failure trend prediction model based on RSF. The experimental results show that the accuracy of the XGBoost method reaches 88%, and the RSF fault trend model has better performance than the CPH model. The proposed model can solve the fault prediction in the whole service life of the equipment. Finally, according to the prediction results of the pump fault trend, the paper summarizes the fault rule and puts forward the reference maintenance opinion. Overall, the study is based on real data obtained from devices under traditional operational modes, rather than virtual data. This approach is easy to implement and helps to provide tunnel equipment managers with productive preventive maintenance decision support to avoid potential pump failures. Importantly, the model proposed in this paper is built upon common equipment baseline information and failure data characteristics, effectively addressing the challenges associated with leveraging these data to establish accurate predictive fault models. Consequently, the model exhibits valuable generality, thereby offering extensive application potential for other devices.
However, there are still areas worthy of further improvement. First, the model can be improved in the ability of failure pre-warning by exploring pump failure tendencies using current and voltage signals. Failure pre-warnings can be issued according to the probability of occurrence by analyzing and predicting changes in data eigenvalues. Secondly, we can improve the accuracy of fault diagnosis and make accurate fault Repair Strategies according to analyzing the causes of equipment fault by causal inference. Finally, it would be promising to modify the framework of our proposed model by introducing an integrated decision-making approach and combining the results of fault diagnosis and failure trend prediction to provide tunnel equipment managers with more target-specific preventive maintenance advice, including early maintenance, replacement, or preparation of spare parts in advance.
Footnotes
Handling Editor: Chenhui Liang
Declaration of conflicting interests
The author(s) declared no potential conflicts of interest with respect to the research, authorship, and/or publication of this article.
Funding
The author(s) disclosed receipt of the following financial support for the research, authorship, and/or publication of this article: This work was supported by Shanghai Municipal Transportation Committee [grant numbers JT2021-KY-013].
Data availability
The data that support the findings of this study are available from Shanghai University and Shanghai Urban Construction (Group) Corporation Research Center for Building Industrialization, upon reasonable request.