
Abstract
Image elicitation methods generating visual data are becoming more common in social science research to generate rich and detailed findings and access topics using nonverbal approaches. Current elicitation techniques using photos and drawing methods have limited application for studying sexually transmitted infections (STIs). To address this, I describe a novel elicitation method—the flash card activity—which involves ranking STI flash cards according to predetermined themed continua. The activity was embedded within semistructured interviews focusing on social representations of STIs and experiences and meanings of STI symptoms and care-seeking behavior with 27 participants. Participants were recruited from the third National Survey of Sexual Attitudes and Lifestyles that took place in Britain 2010–2012. This article reports on the methodological findings of implementing the flash card activity. The activity generated linked verbal and visual data that were more fluent, cohesive, and diverse than other interview data and disrupted normative accounts of infections, enabling participants to reflect on the formation and influences on their social representations. Acceptability of the flash card activity was high, although there were feasibility issues when either language comprehension or time were limited. There is scope for further methodological innovation and adaptation for different topics.
Keywords
What is already known?
Some topics, especially those perceived to be sensitive or personal, are not accessible through language, but verbal data are still the most common form of data used in qualitative research. Image elicitation methods introduce visual elements to research processes and can enhance analytical insights into social phenomena; they are becoming more common but have not been widely used to explore health related topics.
What this paper adds?
A descriptive overview and reflections about implementing an innovative image elicitation method to study sexually transmitted infections, situated within a review of similar methods. The flash card activity elicits verbal and visual data about how meanings are made in relation to the research topic, in this case sexually transmitted infections, using a rank ordering approach and allowed participants to reflect on the process. This article uses a joint display to integrate multimethod qualitative data, an innovation of joint displays typically reserved for mixed methods research.
Introduction
Visual methods are becoming increasingly common in social research to produce findings with more depth and analytical insight into the research topic. They help go “beyond text” and overcome the reliance on verbal data (Banks, 2001, p. 2; Prosser & Loxley, 2008). Methods producing visual data can help link the subject and the narrative (Reavey, 2011, p. 10) and enable patterns and associations between different components to be seen (Goody, 1986, pp. 54–55, as cited in Banks, 2001, p. 24). Visual methods offer alternatives to words and numbers data to answer research questions about human experiences (Prosser & Loxley, 2008). They have been particularly successful in studies involving vulnerable or “unheard” populations such as formerly homeless people with mental illness (Padgett, Smith, Derejko, Henwood, & Tiderington, 2013) due to their participatory nature and different mediums of expression used. However, these methods are likely to have wider applicability in terms of the types of images used for elicitation and the groups they are used with. This study builds on the existing visual methods literature, focusing on image elicitation to describe an innovative method—the flash card activity.
I address two main research questions: How can the flash card activity be used to study sexually transmitted infections (STIs) and what impact does it have as an image elicitation method on data production? I start by reviewing the literature on image elicitation methods and the challenges of studying STIs before describing the flash card activity and reflecting on its use to generate data. This work is part of a mixed methods study exploring how social representations of STIs influence experiences and interpretations of symptoms and care-seeking responses in the general population in Britain (Mapp, Hickson, Mercer, & Wellings, 2016).
Image Elicitation Methods
Image elicitation methods are a collection of techniques often embedded within other methods, particularly qualitative interviews or ethnographies (Rose, 2016). The image can be created by the researcher or respondent-generated (Prosser & Loxley, 2008). I will discuss the following common elicitation methods, giving illustrative examples of each: photo elicitation with debriefing interviews, photo diaries and drawing methods.
Photo elicitation, defined as “inserting a photo into a research interview” (Harper, 2010, p. 13), is one of the most common image elicitation methods. It was first used by Collier (1957) to address a methodological problem in categorizing housing quality in a study examining mental health in changing communities in the maritime provinces in Canada. It has since been applied to a multitude of research topics primarily within the social sciences and humanities (Prosser & Loxley, 2008) and most approaches involve research participants taking photos (Rose, 2016, pp. 314–327). Suchar (1989) suggested photo elicitation is an interrogatory process where the photo acts as a question, stimulus, or probe to elicit additional meanings and social significance. Blinn and Harrist (1991) used photo elicitation in this way in their two-part study about females returning to college after time away from education. Participants were given a Polaroid camera each and asked to take 10 photographs representing their experiences as a reentry student and write a short description of the photo and the thoughts and feelings it evoked in them. These data were analyzed using thematic content analysis and photos were categorized according to the location in which they were taken. Participants then took part in a semistructured interview using the photos and written descriptions as a basis for discussion and thematic analysis of interview data provided additional insight to the photos to reveal time as an overarching theme across photo and interview data. Combining data from the photos and interviews highlighted conflicts in the women’s experiences of their role as college students and their family duties, which was not apparent from either method in isolation.
A similar approach combining photos taken by participants with “debriefing” interviews was used by Karlsson (2001) to explore apartheid and postapartheid discourse in school environments in Durban, South Africa. Karlsson was keen to gain an insider perspective and used a visual method to “fix” the fluidity of the research environment to critically engage with the research topic and facilitate learner participation in research in a culturally and linguistically complex context. Focusing on methodological challenges, her findings highlight the importance and reliance on language within visual research, which is often not anticipated when using visual data (Karlsson, 2001). Karlsson’s work is methodologically important, as it emphasizes the role of images within interviews both as a prompt to elicit verbal data and as a tool to reduce eye contact with the researcher, which may induce anxiety in participants.
Another use of photos as part of a method was described in a study about street children in Kampala, Uganda, where photo diaries were used to understand the child’s perspective about daily life on the street and avoid “adult” assumptions about the research setting (Young & Barrett, 2001). Disposable cameras were given to 15 children to take pictures of their activities and places they visited over 24 hr. Like Karlsson’s (2001) findings, the photos were a powerful discursive tool with discussions often revealing more information than the photo itself, despite the range of content and subjects photographed. Photos were analyzed chronologically to give pictorial representations of individuals’ daily lives and then collated to generalize findings. This study used a multimethod approach and carried out other elicitation methods including drawing mental maps of places street children visited, thematic and nonthematic drawings about daily life and daily time lines (Young & Barrett, 2001, p. 144) allowing for creativity and free expression. Visual data were triangulated with data generated from other qualitative methods.
Bagnoli (2009) also used visual methods based on drawing (self-portraits, relational maps, and time lines) in qualitative interviews in studies about identity and migration between England and Italy and young people’s lives, identities, and relationships in England. Using image elicitation methods made the research process more “stable” and enabled a focus on participant reflexivity and gathering holistic data. By using the researcher’s instructions as a “scaffolding” (Bagnoli, 2009; Prosser & Loxley, 2008), participants produced their own meanings and associations for each drawing, which became the focus of analysis instead of using preexisting theory. Including elicitation methods as part of data collection helped participants convey what they meant but could not articulate in words and was useful to overcome silences around sensitive aspects of their stories (Bagnoli, 2009).
Using Image Elicitation Methods to Study STIs
I use the term STIs to encompass a range of sexually transmissible infections (World Health Organization, 2015). STIs still tend to be negatively framed in society, highlighting the taboo nature of the topic and associations with deviant behavior (Weston, 1999, p. 4). They are not commonly discussed outside medical settings (Hood & Friedman, 2011) and for some participants, the topic is not accessible through language (Eisner, 2008) because it is too abstract and unfamiliar, which presents some unique methodological challenges for studying STIs. Visual methods using elicitation techniques seem to offer a solution, but current image elicitation methods are not well suited to investigating personal health issues such as STIs. Taking photos of symptoms on and around genitals is neither feasible nor appropriate for this study. Similarly, as existing medical images of STIs and symptoms are often very graphic (Holmes et al., 2008), using these images may cause strong emotive responses, distorting individual’s perceptions of their own experiences. Creating a drawing of STIs or related symptoms is unlikely to result in good quality data because of the unfamiliarity of what infections look like and may instead reproduce stereotypical images of infection and elicit superficial narrative.
However, image elicitation methods still offer methodological potential when the specific challenges of the research topic are identified and addressed creatively, an approach encouraged by Mason (2006). The flash card activity described in this article draws on image elicitation principles to ground the research topic through the creation of a visual image by the participant using predetermined conceptual themes and text-based flash cards. The method is designed to simultaneously mitigate the lack of appropriate language about STIs (by providing named infections and relevant themes to focus discussions) and explore the process of forming representations and making sense of these infections through verbal and visual approaches. The activity is an experimental method, developed specifically for this study, which is common in image elicitation approaches to meet the needs of the study aims and participants involved (Rose, 2016, p. 319; Young & Barrett, 2001).
The Flash Card Activity
Participants
The third National Survey of Sexual Attitudes and Lifestyles (Natsal-3) was a large probability survey in Britain (Erens et al., 2014) and I used participant responses to the survey to identify my sampling frame for this study. I recruited participants who reported recent STI symptoms (see Table 1), never having attended a sexual health clinic, and who agreed to be recontacted about further research. These survey questions were asked to a subset of sexually experienced participants aged 16–45 years. I used a purposive sample to ensure the inclusion of different types of symptoms in women and men, to explore how these influenced representations of STIs (Mapp et al., 2016).
Sexually Transmitted Infection Symptoms Asked About During The Third National Survey of Sexual Attitudes and Lifestyles Data Collection.
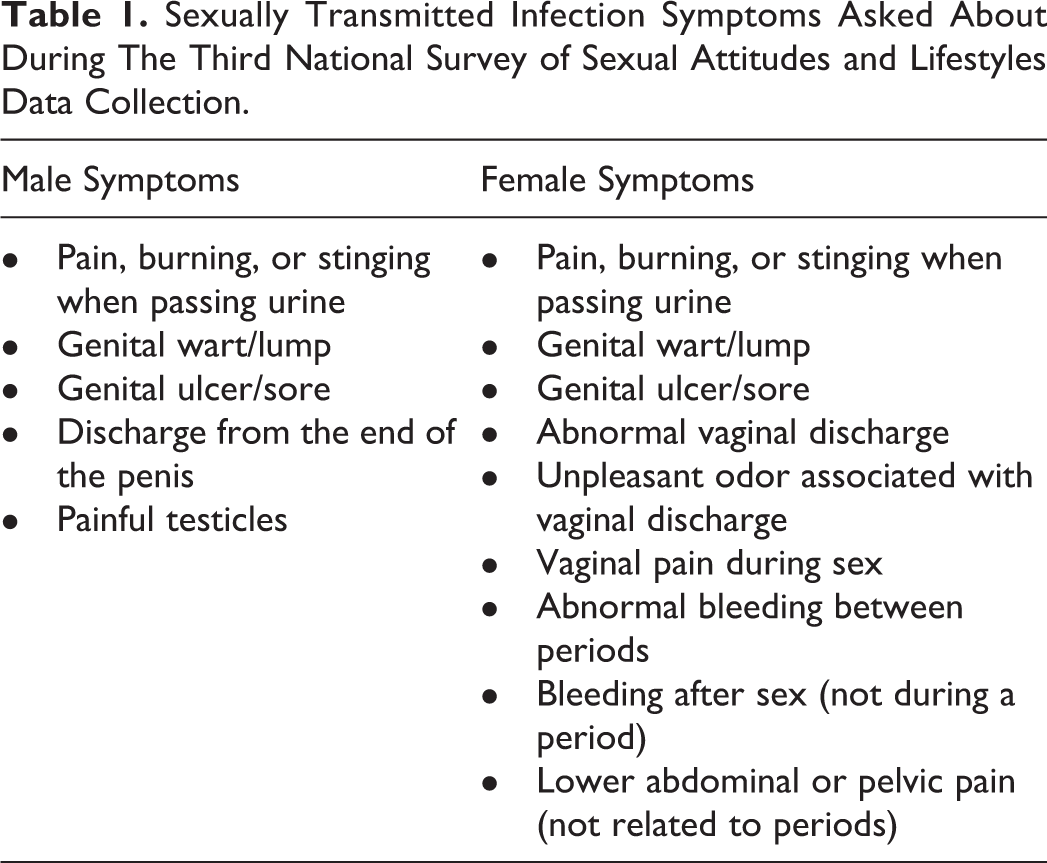
There were 16 women and 11 men in the sample. Most were White British/other, three were Asian/Asian British and one was Black/Black British. Five participants did not speak English as their first language. Sixteen were employed and six were in full-time education; less than a quarter of the sample were educated to degree level and two participants did not have any educational qualifications. Eight participants were from the two least deprived quintiles and 12 from the two most deprived quintiles in Britain (Payne & Abel, 2012). One participant reported having only 1 lifetime sexual partner and eight reported having more than 10 partners. Three participants reported they had previously been diagnosed with an STI.
Data Collection
Semistructured interviews took place a median of 30 months after survey data collection, in England and Wales. Two participants did not complete the flash card activity, one due to time constraints and the second because English was not their first language and they did not understand the term STIs. Participants were shown cards with the names of eight common STIs (Table 2; Centers for Disease Control and Prevention, 2013; World Health Organization, 2015), removed cards they were unfamiliar with, and then ranked them according to thematic continua (Table 3). Themes were informed by the public health literature on STIs and care-seeking behavior (Malta et al., 2007), psychological theories including the health belief model, theory of planned behavior, and Jones et al.’s (1984) six dimensions of social stigma, particularly “concealability,” “aesthetic qualities,” and “peril.” Each of the six themes was dichotomized into extremes, for example, the prevalence theme was divided into the most and the least common, to simplify complex epidemiological, biomedical, and sociological concepts and to facilitate flash card ranking. I took a photograph of the participant’s card arrangement for each theme. These photographs constituted the visual data alongside the verbal data generated by participants “thinking out loud” followed by discussions to elicit further justification for their positioning of the flash cards. I emphasized that it was their opinions I was interested in rather than specific knowledge about infections.
Flash Cards Included in the Flash Card Activity.

Flash Card Activity Continua Themes.

The flash card activity was carried out halfway through the interview following general questions about STIs, experiences of symptoms and care-seeking responses, and it preceded a discussion about STI stigma. The activity lasted between 14 and 38 min and the complete interviews ranged from 44 min to 1 hr and 48 min in duration. The whole interview was digitally recorded and transcribed verbatim.
I chose flash cards as the basis for the method to allow repositioning of the cards during the ranking process. Rank order exercises are flexible and useful tools for studying individual differences in opinion, decision-making, priorities, and preferences (Hudelson, 1994, pp. 19–20). The ordering and grouping of flash cards during the activity mirrors similar information sorting tasks such as Peterson and Barron’s (2007) use of sticky notes in focus groups. They asked secondary school students to use the sticky notes to write their own ideas about the definition, purpose, and personal responses to assessment and feedback in school. They then asked them to organize the sticky notes into groups reflecting common and differing views on large sheets of paper. This stimulated more “engagement, interaction and discussion” (Peterson & Irving, 2008, p. 241) among students, generating contextualized explanations of common themes.
Ethical Considerations
All participants provided written consent agreeing to participate in the study, for the interview to be audio recorded and for anonymized data to be used. Ethics approval was given by National Research Ethics Service Committee South Central—Oxford A 11/H0604/10 and London School of Hygiene & Tropical Medicine Observational/Interventions Research Ethics Committee 6538.
Analysis of the Flash Card Activity Data
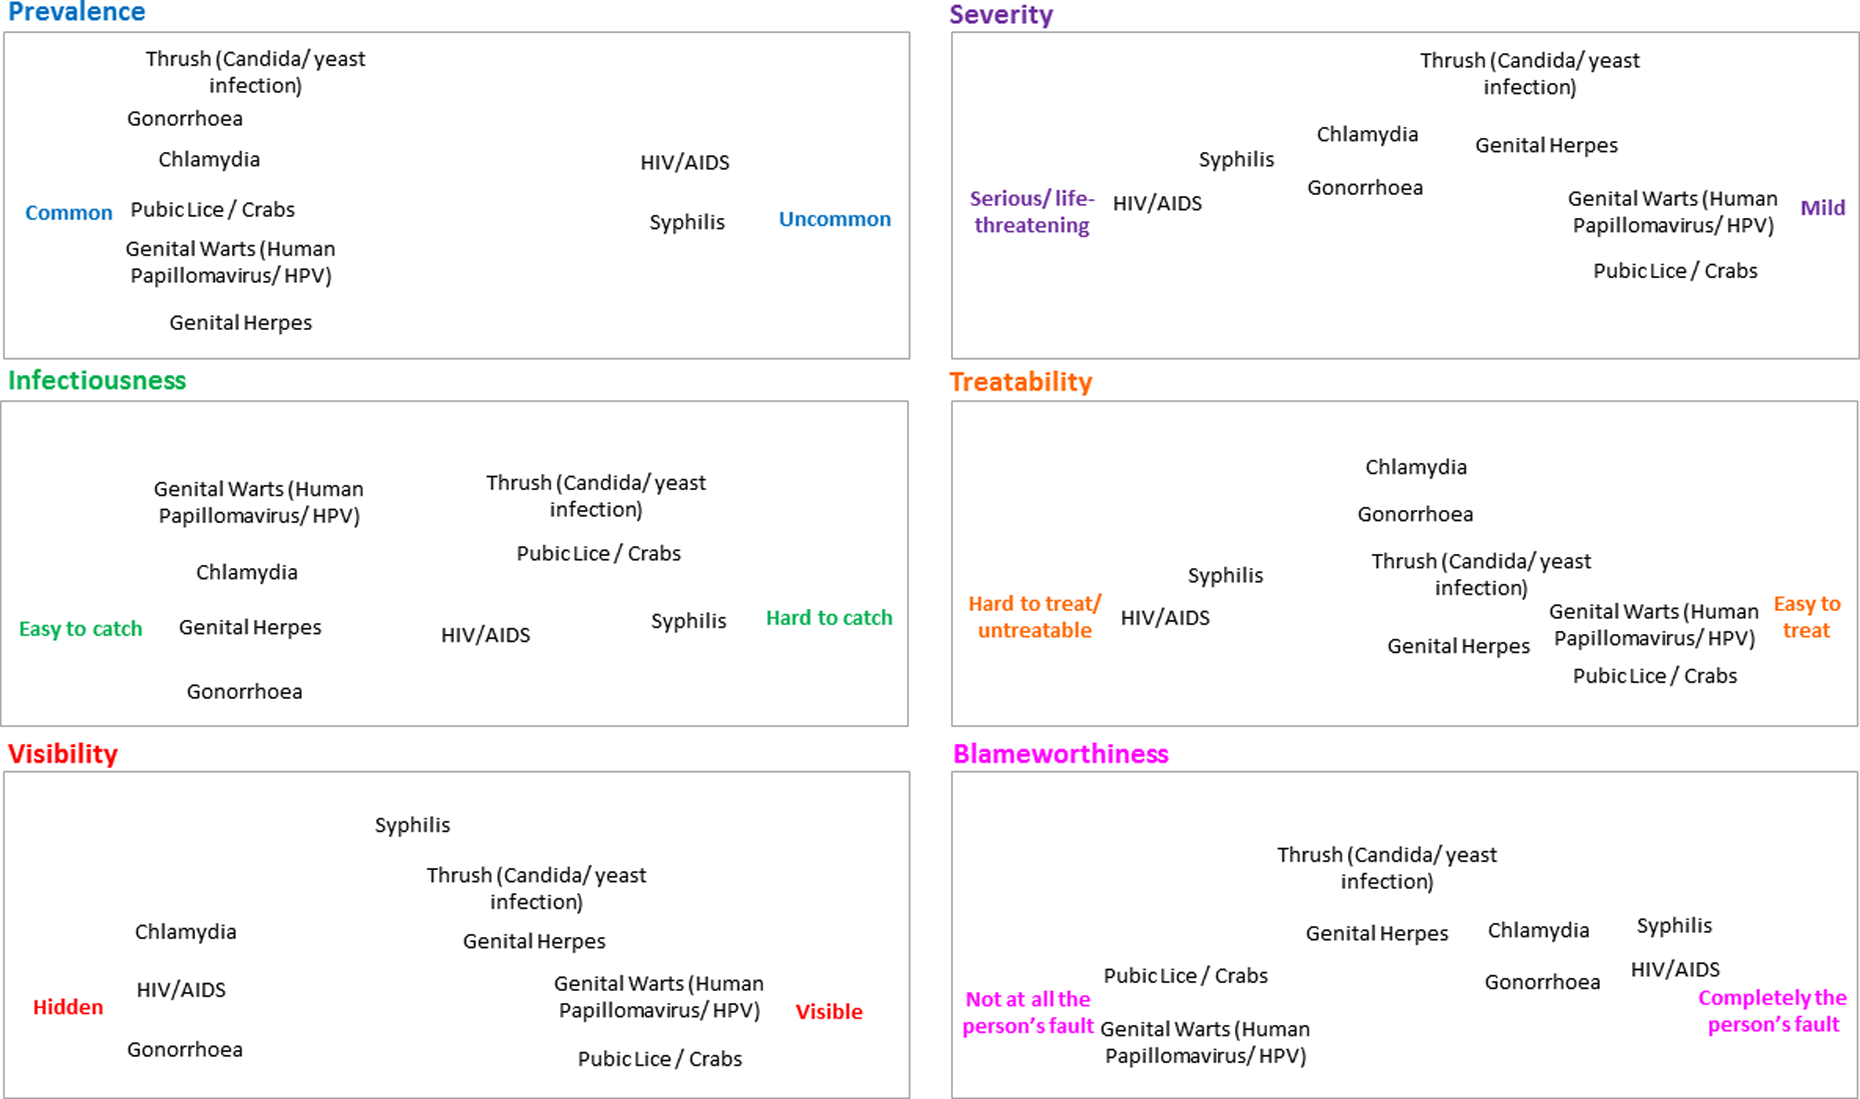
Visual and verbal data were analyzed separately but concurrently using principles of interpretative phenomenological analysis to understand how individuals made sense of STIs and the meanings and social representations of these infections (Smith, 1996; Smith, Flowers, & Larkin, 2009). The photographs were collated and grouped as a set of continuums completed by each participant (see Figure 1) as well as according to continua themes (see Figure 2). This enabled comparison of an individual’s social representations of STIs as well as comparison across different participants’ views within each theme.
Ordering of the flash cards according to the six continuum themes by an individual participant (i13, man, aged 20–24).

Joint display showing the integration of verbal and visual data from four different participants for the visibility continuum to produce key themes.
For the transcribed verbal data, each transcript was analyzed in full to situate the flash card activity in the context of the complete interview. Empirical findings from these analyzes about STIs are reported elsewhere. The text relating to the flash card activity was then extracted and analyzed separately, according to the method described by Smith, Jarman, and Osborn (1999), paying particular attention to discourse. Using an idiographic approach, initial coding notes, comments, and questions were transformed into conceptual themes to summarize the “essence” of the data (Smith et al., 2009). Analyses were iterative and inductive, focusing initially on descriptive individual meanings which developed into interpretations of shared meanings and commonalities in the data (Smith et al., 2009, p. 79). The visual data were analyzed by considering the spatial positioning of the flash cards in relation to each other and the continuum end points. I developed codes to describe the pattern created for each completed continuum, referring to the transcribed verbal data to distinguish intentional variations in flash card positioning from incidental placement. I considered the content of the flash card activity and coded how participants had interpreted specific STIs in relation to the other infection flash cards and the overall theme. Analysis also focused on what impact the method had on the participant’s account during the interview.
Visual and verbal data were then integrated using joint displays, a technique used to synthesize different types of data in mixed methods research (Guetterman, Fetters, & Creswell, 2015). This article represents the use of a joint display to integrate different types of qualitative data in a multimethod study, a novel application of the technique and methodological innovation in using joint displays typically reserved for integrating quantitative and qualitative research findings.
Participants’ descriptions of their ordering process were placed together with the photo of the completed continuum (represented diagrammatically in Figure 2) to look for areas of analytic convergence and divergence according to the research topic and methodological research questions (see Figure 2). Key themes were generated as the inference of data integration. This ensured photographs of continua were analyzed within the context of the interview, an analytic approach used in other visual methods studies (Blinn & Harrist, 1991; Pilcher, Martin, & Williams, 2015).
Findings
The focus of this article is on the methodological findings from using the flash card activity and does not report empirical results about STIs. Participants showed good engagement with the activity and 22 participants used all eight flash cards in their ordering process; the lowest number of flash cards used in the activity was five. All participants completed at least five of the six continuums and the blameworthiness theme was the most frequently refused continuum with 6 of the 25 participants either not attempting it or positioning all of the flash cards together (usually in the middle of the continuum extremes).
Verbal Data
The text element of the flash card activity gave participants specific terminology, which they could choose if and how to use. Specifying particular words offered a clear framework for participants to respond and helped structure the activity. Some participants immediately adopted the language of the flash card activity as their own and became more confident in what they were saying, such as this participant who used the names of specific infections as she ordered the flash cards. I’m not sure about syphilis but I know herpes is untreatable and so is AIDS and pubic lice you could rid of easily. (i3, woman, aged 20–24, treatability continuum)
And what comes into your head when I say sexually transmitted infection, or STI to you?
You shouldn’t really say it ‘cos anyone can get them but kind of, more it’s perceived as slightly, not dirty people but kind of more promiscuous, stuff like that…(i24, man, aged 16–19)
The introduction of terminology, that is, the names of infections and specific themes, during the flash card activity opened up a greater narrative range (beyond that which was given as part of the exercise) for participants and enabled more cohesive ideas to emerge. The quote below is from the same participant during the flash card activity. It could take a while for symptoms to show and then on some they can or can’t have symptoms…I think HIV, AIDS can take years for it to have any detrimental effects on you, and the symptoms you get from that are not from the virus itself, they’re from immune deficiencies. (i24, man, aged 16–19, visibility continuum)
The flash card activity was particularly successful at disrupting normative discourses about STIs and helped overcome “clichés and ready-made answers” (Bagnoli, 2009, p. 566), such as STIs only affecting promiscuous people. This occurred as participants were choosing positions for the STI flash cards and justifying their reasoning. They often reordered flash cards reflecting the reformulation of ideas about the infections and this added depth and additional meaning to the data collected similar to Young and Barrett’s (2001) findings about how street children created and amended their mental maps of Kampala. The flash card activity also gave participants the opportunity to reflect on how their social representations were formed and influenced, which added a reflexive element to the method and highlights another advantage of including visual components (Bagnoli, 2009).
Visual Data
The flash card activity was semistructured, with predetermined flash card contents and themes that were interpreted and ranked by participants, creating different spatial patterns. I have included the original photo of a completed continuum in Figure 3, but other figures show diagrammatic representations for clarity. The patterns that participants created through ordering the flash cards were diverse (see Figure 2). Some participants interpreted categories as dichotomous, that is, infections were common or uncommon, severe or mild, and visible or hidden (Figure 2, i27). Other participants responded to the idea of a continuum very literally and there was strong linearity to their organization of the flash cards (Figure 2, i8). For other participants, it was a more complex pattern of relative relationships of the different infections, with marginal spatial differences conveying distinction in their social representations of one infection compared to another, which was only highlighted when verbal and visual data were considered together (see Figure 3).

Participant (i10, man, aged 20–24) quote about ordering the flash cards for the blameworthiness continuum (top). The same participant’s completed blameworthiness continuum showing differential positioning of pubic lice in relation to the other infection flash cards (below).
The ordering or grouping of different infections gave some insight into the relativity of social representations of STIs. The flash card activity enabled participants to build up visual depictions of their social representations and circumvented the linearity of verbal speech (Gauntlett, 2007, p. 126). The visual aspect of the flash card activity accounted for and allowed the fluidity of the subject of STIs to be incorporated; it generated and organized data in a more tangible way than giving a verbal account and “fixed” the fluidity within the research process (Karlsson, 2001). Additionally, the physical presence of the flash cards and continuum themes in front of the participants provided a focus to discussions and made a complex topic more accessible. They acted as visual prompts to stimulate additional narratives that verbal prompts may not have elicited, performing a similar function to the photos in photo elicitation methods (Harper, 2010).
Other Methodological Findings
A valuable and novel outcome of the flash card activity was the insight it gave into the process of meaning making and the forming and reforming of social representations of STIs. By asking participants to think out loud as they ordered the flash cards, additional explanatory data were produced that were not apparent from the visual data alone. Sources of cognitive dissonance were revealed through doing the activity, which the participant often reconciled as they went along. Syphilis I know is kind of labelled as an old disease but I’m also aware that it’s something that’s been on the rise recently so…[it’s] not uncommon really, just less common than the others. (i6, woman, aged 35-39, prevalence continuum)
The social context in which views about infections were created and revised was often incorporated within narratives, and participants drew on experiential knowledge to inform their decisions about ordering the flash cards. Some individuals disclosed personal experiences that they had not previously mentioned, suggesting the flash card activity was a useful way of accessing sensitive information which enriched the data set overall. (Interviewer going through the infections listed on the flash cards) I should say, I’ve actually had thrush…I thought I might have left it out. (i10, man, aged 20–24)
This participant then used their personal experience of having had thrush to help them complete the activity. Thrush as I say, I’ve had, more than once so I’d say that’s quite common…because, I have experience with that [thrush], those are obviously visible…thrush [is] mild, real mild as well, cos I had that as well and I’m fine…thrush you have one of those tablets and you get some cream and that’s it…it’s over in 2 days. (i10, man, aged 20–24, prevalence, visibility, severity, and treatability continua)
Disclosing personal information in the flash card activity may have been easier than in other parts of the interview as the method diverted attention away from the researcher–participant relationship as other researchers have found (Karlsson, 2001; Young & Barrett, 2001). While including the flash card activity broadened the data in some areas, it potentially restricted it in others. This activity relied on relative ordering of flash cards in relation to other cards and the continuum theme so is not necessarily generalizable to social representations about STIs in other contexts. The data were created within the setting of the interview and produced for the purposes of this study.
The flash card activity was a text-based exercise (similar to most qualitative data) rather than an expressive visual method and, in its current form, required specific knowledge that was not shared by all participants. Despite emphasizing it was the participants’ own opinions and views that I was interested in, some participants were uncomfortable with gaps in their knowledge being revealed and tended to place that flash card in the middle of the continuum rather than removing it from the activity (see Figure 4). I’m putting gonorrhoea in the middle because I don’t know anything about that. (i16, woman, aged 25–29, treatability continuum)

Completed treatability continuum by i16 (woman, aged 25–29) with gonorrhea positioned in the middle of the continuum.
This led to some partiality in the flash card activity data. Placing flash cards in the middle of continua shares similarities with responses to quantitative scales and the central tendency (Tourangeau, Rips, & Rasinski, 2000), whereby respondents are unlikely to answer using the extremes of the scale and commit themselves to a specific viewpoint. Participants sometimes employed guesswork or arbitrary flash card positioning which may have influenced the quality of the visual data and in turn, the verbal data produced. Despite the visual component, the flash card activity also required some language comprehension about the research subject to understand instructions given, evidenced by the participant who did not complete the activity as they did not understand the term STI.
Some participants considered the themes too broad, vague, or abstract. Before starting the ordering process, a few imposed certain considerations that determined how they responded to the activity; themes were restricted to specific populations, geographical locations, behavioral determinants, or other contextual social factors. Oh we haven’t spoken about protection, it depends whether you have protected or unprotected sex then […] so we are talking about somebody who stays at home and has got a normal lifestyle. (i25, woman, aged 45–49, infectiousness continuum)
The scope for differential interpretations of the themes gave the flash card activity flexibility and potential to adapt within the parameters of the method (Bagnoli, 2009) and distinguished it from structured quantitative ranking exercises.
Acceptability of the Flash Card Activity
Other authors have reported the fun, interesting, and engaging aspects of using visual methods with participants (Pilcher et al., 2015) as well as enabling participants to have some autonomy and control of the research process (Young & Barrett, 2001). Overall participants enjoyed the participatory elements of the flash card activity and the change from the standard interview format. Although there was no formal evaluative component of the activity, several participants gave spontaneous feedback about their experience of participating in the activity. I’m enjoying this bit. (i2, woman, aged 35–39) Okay, I like this game, to do [sic] my knowledge. OK, that’s interesting. (i25, woman, aged 45–49)
Despite being a positive experience for most, a few participants were not comfortable using the tool and in these cases, including the method in the interview may have artificially driven the process of deriving meaning about the subject matter and deviated from the core principle of “naturalness” within qualitative inquiry (Green & Thorogood, 2009, pp. 22–23).
Concluding Comments
The flash card activity is an innovative, text-based image elicitation method, producing rich data in the form of photos of rank orders of STIs and associated verbal discussions about the ordering process in a sample of British adults. The duality of data generated different perspectives about STIs and contextualized new knowledge in meaning making processes. Considering each completed continuum in conjunction with participants’ explanations about how and why they had decided on the positioning of cards gave new insights into salient themes in relation to STIs and is a key advantage of using the flash card activity. Through the activity, the topic of STIs became more accessible; participants built up complex accounts using visual representation; and narratives were more fluent, cohesive, and diverse than those elicited in standard interviewing. This demonstrated the value of including an experimental image elicitation method within interviews, which was specifically designed to accommodate complexities of researching STIs (Hood & Friedman, 2011). Other visual methods have been shown to “prompt” data production (Prosser & Loxley, 2008) and photos in particular have been described as an “anchor point,” a “springboard,” and as a “safety net” (Hatten, Forin, & Adams, 2013). The flash card activity fulfilled all three roles, as it anchors the subject and makes an abstract topic easier to articulate, catalyzes data production, and provides language to participants, minimizing discomfort when articulating their views about STIs.
Development of the flash card activity aligned with the shift in qualitative research to embrace innovative approaches to produce data that fit the needs of the investigation (Taylor & Coffey, 2009). Although it built on other image elicitation methods, the flash card activity is distinct and there were inherent trade-offs linked to its utility. As the method used cards with written words, it imported the language and certain assumptions of biomedicine, which helped minimize discomfort in talking about STIs, but was a less dimensional approach than using photos or drawings. Differences in meanings were manifest in both the visual and verbal data, although discussion about the ordering often elicited implicit assumptions behind the meanings. Therefore, the verbal data often revealed more than the photos of the continua which support methodological findings from other visual methods (Karlsson, 2001; Young & Barrett, 2001). Using a text-based method was appropriate for understanding social representations of STIs, unlike using images of the infections, but required participants to know infections by name and inadvertently inserted a measure of STI knowledge into the activity. The activity is unable to capture the dynamism and fluidity of STI social representations as it collects data at one point in time. Repeated interviews using the activity may elucidate changes in how individuals think about specific STIs, reflected in different flash card positioning. The method had a defined structure enabling comparisons across continua themes and between different participants, but the semideductive approach limited the scope of interpretations of STIs beyond the parameters of the activity.
Through the processes of developing, implementing, and reflecting on using the flash card activity, I have devised recommendations for how to use the flash card activity effectively: Adapt the design of the flash card activity to the specific needs of the research questions, topic, and participants. Derive continua themes from relevant literature and theory. Embed this method within another qualitative method—semistructured interviews work particularly well. This will enable comparison of data generated by different methods. Ensure participants have sufficient knowledge of the items listed on the flash cards, there is enough time to conduct the activity during data collection and the location where data collection takes place is suitable (i.e., has a well-lit flat surface that both researcher and participant can access). This method works well for topics that are not often verbally discussed and that are not amenable to drawing or photographic methods and where different types of data are needed to access different perspectives or disrupt normative or stereotypical descriptions. The flash card activity should be implemented part way through data collection to allow data to be collected before and after specific terminology is introduced; the change in method also engages the participant in a different way, refocusing them, and minimizing the impact of research fatigue on data quality. Other applications of this method should utilize its advantage of eliciting and reflecting on the meaning making process of ordering flash cards not just the final ordering.
The data elicited were coproduced through interaction between researcher and participant and were contextual to the interview. Therefore I, as the researcher, had a substantial impact on what was said and not said and how continuum themes were interpreted and flash cards positioned. My gender was likely to have had the most influence on the flash card activity as STIs and other genital infections affect women and men differently (Weston, 1999); as a cis-woman, I found it easier to relate to women in the sample than men, and several women commented that they would not have been comfortable discussing this subject with a man.
There is potential to further develop and adapt the activity for different research contexts, subgroups, and purposes, and the flexibility of using flash cards as the main component of the method would enable a variety of data to be generated. This method could also be employed for generating multiple perspectives to understand how individuals attribute meaning to other stigmatized areas of health such as mental health conditions, psoriasis, or irritable bowel syndrome. The activity would be amenable to digitalization and administering via handheld tablets, which also increases the applicability of the method to other studies and may further increase engagement, as has been found with similar technologically enhanced elicitation studies (Pilcher et al., 2015).
Footnotes
Acknowledgments
The author would like to thank all of the Natsal-3 participants and those who took part in the follow-up interviews for this study. Thanks to Professor Kaye Wellings for her conceptual input and guidance in the early stages of developing this method and for reading a draft of this article. Also Dr. Ford Hickson for his clear and concise comments on draft versions of this article and ongoing support throughout this work. Thank-you to the qualitative analysis group at the London School of Hygiene & Tropical Medicine for their constructive and insightful feedback on an early draft of this article and to Jessica Kuehne and Bill Paxton for the final proofread and fresh perspective on the work. This article has been greatly improved by the practical and insightful comments from the anonymous reviewers of this article.
Declaration of Conflicting Interests
The author(s) declared no potential conflicts of interest with respect to the research, authorship, and/or publication of this article.
Funding
The author(s) disclosed receipt of the following financial support for the research, authorship, and/or publication of this article: This work was funded by the Economic and Social Research Council ES/J500021/1.
Supplemental Material
Details about the data used in this study are available from the author. Data will be archived after completion of the study where participant consent has been given.