
Abstract
This article explores the use of two visual methods to facilitate elicitation of temporal data in a qualitative interview study—specifically, a timeline drawing activity and collaborative viewing of an interface for visualizing personal social media histories, the Online Scrapbook—for eliciting participants’ recollections and reflections upon their experience of chronic illness. This study makes a novel contribution in the use of an interactive, data-driven timeline based on social media participation to elicit personal reflections. Both elicitation techniques were effective for encouraging participants to tell their story and take a closer look at their own experiences in their respective ways. Whereas the timeline drawing activity gave participants the opportunity to share their illness experiences from their own perspective, the Online Scrapbook facilitated a multidimensional exploration of how participants interacted with their surrounding online and offline environments, enabled participants to revisit their past through their own digital artifacts, and supported a deeper exploration of participants’ information behaviors. The article examines how the timeline drawing activity and the Online Scrapbook viewing activity were used together in the same study to bring out the richness and complexity of the relationship between information behavior and health management, and facilitate a nuanced view of participants’ lives.
Keywords
What Is Already Known?
Visual elicitation techniques can be useful to facilitate data collection for a variety of reasons including drawing out ideas that would be difficult to elicit entirely through verbal transactions, triggering richer conversations and reflections, and building rapport. Timelines are one form of visual elicitation that can be useful for these purposes.
What This Paper Adds?
This study makes a novel contribution in the use of an interactive, data-driven timeline based on social media participation to elicit personal reflections. Additionally, this article compares the affordances of the two elicitation techniques and illustrates how employing the timeline drawing activity and the Online Scrapbook viewing activity in the same study brought out the richness and complexity of the relationship between participants' information behavior and their health management, and facilitated a nuanced view of participants’ lives.
Introduction
Interviews can be conducted in different ways, and the manner in which an interview is conducted can have a profound influence on the data that are collected. Each research question poses its own challenges in data collection. This article focuses on the elicitation of information about personal histories within the context of chronic illness. Research on this topic can be difficult because the time period of interest might be as little as several months, to as much as several decades. There may be problems with memory regardless of length of time, but particularly in situations where illnesses span long periods or include difficult or traumatic experiences. Moreover, illnesses often touch upon many aspects of life, which can make structured data collection difficult.
In these types of situations, it can be useful to employ visual elicitation techniques to facilitate data collection. Visual elicitation techniques can serve many purposes including drawing out ideas that would be difficult to elicit solely through verbal transactions, triggering richer conversations and reflections, and building rapport (Crilly, Blackwell, & Clarkson, 2006; Meo, 2010). This article explores the use of two methods to facilitate collection of temporal data in a qualitative interview study of illness journeys. The first method is based on a participant-drawn timeline, and the second, an interactive, data-driven timeline generated from social media content that participants have authored. To contextualize this discussion, the article first provides a literature review on visual elicitation techniques, with particular attention to timeline drawing activities, and then an overview of interview research involving retrospective recall of social media participation.
Visual elicitation is the process of using a visual stimulus to draw out a verbal or a visual response (Salmons, 2010). Visual stimuli can include physical specimens, maps, drawings, photographs, and video clips (Crilly et al., 2006). One subset of visual elicitation is graphic elicitation techniques, which involve the use of diagrams or drawings in interviews (Crilly et al., 2006). Graphic elicitation techniques open up participants’ interpretations, enable participants to form a holistic view of topics being explored, encourage participants to explore different layers of experience, and evoke deeper elements of human consciousness (Bagnoli, 2009; Harper, 2002). Arts-based methods can give participants an opportunity to reflect and facilitate creativity and self-expression (Bagnoli, 2009). Photo elicitation can trigger rich conversations about the subjects depicted and operate as a bridge between the world of the researcher and research subjects (Meo, 2010). In photovoice, in which participants take photographs and share them with the researcher in focus groups or interviews, participants can influence the research agenda by determining what to capture (Burles & Thomas, 2014).
Graphic elicitation techniques have been used to study patients’ illness experiences (e.g., Oliffe & Bottorff, 2007; Thygesen, Pedersen, Kragstrup, Wagner, & Mogensen, 2011). There are reasons why they can be helpful for such studies. Graphic elicitation techniques can support participants to remember “nearly forgotten parts of their experiences and…[express] emotions associated with those significant experiences” (Thygesen et al., 2011, p. 596). In addition, visual methods can be useful for eliciting data relating to emotions and emotional experiences (Copeland & Agosto, 2012), and “spontaneous pictures portray an inner world, which sometimes cannot easily be put into words” (Gallo, 2001, p. 197). Moreover, they can be used to facilitate an exploration of perceptions of health and illness (Rollins, 2005).
Timelines are one type of graphic elicitation technique. They have been used to encourage young people to reflect upon the past, present, and future (Bagnoli, 2009). In addition, researchers have employed timelines to examine individuals’ experiences with weight loss, stress and coping, emotional aspects of disease trajectories, breast cancer, and diabetes (Mazzetti & Blenkinsopp, 2012; Sheridan, Chamberlain, & Dupuis, 2011; St. Jean, 2012; Thygesen et al., 2011). The life grid has been used to explore young people’s recollections of parental substance abuse (Wilson, Cunningham-Burley, Bancroft, Backett-Milburn, & Masters, 2007). The process of learning to manage a chronic condition can be accompanied by drastic life changes, alterations of worldviews, and transformations of self-identity (Charmaz, 1991; Crooks, 2007; Mishel, 1999; Röing & Sanner, 2015), and timeline drawing can serve as a vehicle for meaning-making (Leung, 2010).
Many studies that have employed timelines to study patient experience have provided participants a grid or other simple framework such as a line to structure their drawing (e.g. Sheridan et al., 2011; St. Jean, 2012; Thygesen et al., 2011). There were instances in which participants were led to focus on particular time periods (Thygesen et al., 2011). But participants have also been encouraged to think broadly about what might go on the timeline (Sheridan et al., 2011; St. Jean, 2012). Some researchers asked participants to verbalize what they were drawing (St. Jean, 2012; Thygesen et al., 2011). In this study, I also employed a more open-ended structure in which participants were encouraged to think broadly about what to depict and were provided as many blank sheets of paper as they needed.
Aside from participant-drawn timelines, an interactive, data-driven timeline can be employed in an interview to encourage participants to reflect upon illness histories. By interactive, data-driven interface, what is meant is an interface with a display that is rendered based on underlying data and that participants can engage with interactively by querying, clicking, hovering, or otherwise acting upon, to bring up information and engage in sensemaking. In the context of this article about visual elicitation techniques, the purpose of the interface would be to assist the viewer in reflecting upon their own past (as it is portrayed through the medium of the interface). In this study, a timeline depicting social media participation was used. To this author’s knowledge, showing participants timelines based on their own social media participation to elicit reflection is a novel method for investigating personal experience.
We might want to consider why it could be useful to incorporate social media participation into a study focused on personal histories. When a person draws a timeline, they invariably include items of significance to them and omit others by default. If significant elements of participants’ histories could be easily obtained, then showing these to participants might jog their memories. Such artifacts might also be useful to the researcher as an additional medium through which we can “know” an individual. In fact, such artifacts do exist—among them, the social media that participants have produced over time. A person’s digital traces can—as digital cues—facilitate access to personal memories from many points in the past (Belk, 2013).
Previous research has observed that it is helpful to be able to collect digital traces in context, with interpretive input from subjects (Latzko-Toth, Bonneau, & Millette, 2017). The Internet is not a space that is set apart from everyday life; it can mean different things to different people and be used in different ways to realize particular interests (Hine, 2015). An interface that aggregates digital artifacts produced by participants over the course of their illness journeys can enable participants and researchers to explore those journeys together.
Additionally, the use of the Internet and social media can be an important part of illness journeys. Previous research has reported that people with chronic illnesses increasingly use the Internet for a variety of reasons including finding information, support, and practical advice for self-management; for reassurance, encouragement, and to compare experiences of treatment; and to offer advice and support to others (Ziebland, Lavie-Ajayi, & Lucius-Hoene, 2015; Ziebland & Wyke, 2012). They often rely on multiple social media channels including health-related social networks and online support groups and Facebook (Chen, 2014; Greene, Choudhry, Kilabuk, & Shrank, 2011; Swan, 2009). There is considerable research on how people use social media such as Facebook, including studies that have employed visual elicitation by asking participants to view their Facebook displays with the researchers. These studies examined how people employed Facebook for impression management and archival purposes and argued that digital traces have great potential for supporting self-reflection and reminiscence (Schoenebeck, Ellison, Blackwell, Bayer, & Falk, 2016; Zhao et al., 2013). Social media research has increased greatly over time, and studies employing qualitative and mixed-methods have generally been conducted with well-established methods such as interviews, surveys, focus groups, or content analysis (Snelson, 2016).
However, to this author’s knowledge, the use of interactive, data-driven interfaces based on social media to engage participants in collective exploration of their past is a novel interview elicitation technique. In addition, using a participant-drawn timeline, in conjunction with a data-driven timeline, in participant interviews afforded a more multidimensional view of participants’ illness journeys than could have been accomplished through either alone, while continuing to offer participants the flexibility of sharing their own histories and expressing themselves in their own ways. This article presents an example of the use of these techniques together, beginning with a brief introduction to the study and then illustrating how the methods were used.
The Research Focus
This study explored the illness journeys of fibromyalgia patients including how patients’ views of illness and of health evolve, what role information plays, and how participants’ use of online communities, Facebook, Twitter, and other social media changes over time. Fibromyalgia is a condition characterized by chronic widespread pain, joint stiffness, and systemic symptoms (e.g., mood disorders, fatigue, cognitive dysfunction, and insomnia; Bellato et al., 2012; Häuser & Wolfe, 2012; Wolfe, Brähler, Hinz, & Häuser, 2013), in which patients often must face invalidation and lack of understanding from those around them (Kool, van Middendorp, Boeije, & Geenen, 2009; Madden & Sim, 2006).
This interview study aimed to recruit participants who varied in terms of age, illness duration, and social media participation style (nonuser/lurker, infrequent participator, and active participator). A lurker was defined as someone who read social media content but did not author content themselves (Nonnecke & Preece, 2000). Multiple recruitment methods, including an e-mail contact list from a previous survey (Chen, 2012), a university staff and student listserv, face-to-face support groups, health-related discussion forums, and Twitter, were used in order to recruit a diverse sample that varied in terms of these characteristics (N = 23).
The majority of the sample was White women. The sample was geographically diverse in terms of the United States, with participants residing in nine different states; Washington, DC; and Australia. The use of multiple recruitment methods also led to a sample that varied in terms of age (range = 21–79 years), illness duration (1–58 years), and social media participation style.
The data collection was collected through either one or two interviews, depending on geographic proximity to the researcher and extent of social media participation. Regardless of the number of interviews, the interview protocol first focused on the illness journey (and timeline drawing) and then moved to social media participation (including the Online Scrapbook). This sequence enabled participants to first tell their story as they saw it and then engage in a deeper exploration of their information behaviors with the aid of digital artifacts and a timeline to assist in sensemaking.
The data were analyzed through a qualitative approach drawn from grounded theory and interpretative phenomenological analysis. Grounded theory focuses on how social and psychological processes occur in a given environment or situation (Charmaz, 2014), and the primary aim of interpretative phenomenological analysis is to explore how participants make sense of their world and focuses on participants’ interpretations of the object or event (Brocki & Wearden, 2006; Smith & Osborn, 2008).
The Timeline Drawing Activity
In this study, the primary purpose of the timeline drawing activity was to facilitate participants’ sharing of their illness journeys from their own perspectives. The interview prompt was crafted to leave possible interpretations of what a timeline was as open as possible. In the session, instead of starting with the timeline drawing activity, which I thought might be intimidating for some, I opened by asking an open-ended question, inviting participants to tell me about when their symptoms first began. This helped to establish rapport with participants and see how I might best position the timeline drawing activity. They would share their story with me and I would ask questions along the way. Once they appeared to be at a good stopping and/or pausing point, I would ask them to begin drawing. I would tell them to think about their illness journey and to draw something that represented it. I told them that there were no rules as to what they drew and that the timeline need not be a “line.” It could contain a line if they wished or it could contain a squiggly line, meandering line, or no line at all. I brought colored pencils and highlighters. Participants had access to a sketchpad and as many pieces of paper as they needed.
Many said the timeline drawing activity was helpful for thinking about their history, and a few participants also asked for a copy of their timelines. Previous research using timelines has included both reports of participants feeling nervous about drawing (e.g., Guillemin, 2004) and reports of participants being eager and enthusiastic about engaging in the proposed activities (e.g., Copeland & Agosto, 2012). In this study, participants were put at ease with the timeline drawing activity by letting them know that they could draw it however they wanted and emphasizing that artistry was not a concern. Participants seemed to enjoy the timeline drawing activity and the process of telling their story.
Types of Timelines
There was great variability among the timelines, but main dimensions of variability were color (color/monochrome/Black and White), linear/path, pictographic/text-based, completeness, and period of life depicted. Participants tended toward multicolor, path-based, and text-based representations.
Let us consider a timeline as an example. The timeline in Figure 1 depicts many of the themes that participants shared. Although there were differences among the sample, there were certain points, such as onset, diagnosis, acceptance, and development of a self-management strategy, that were shared by almost all the participants. One salient element was the stethoscopes, which represent multiple doctors and medications: “Let me put in some pills here, because that’s what these doctors all want to do is put you on pills” (P21). Gradually P21 moves toward alternative medicine and a wellness orientation, which she depicts using a green leaf. Another salient element was her efforts to improve her sleep. P21’s timeline also depicted trajectories: an empty gas tank earlier on and a fuller one later; and directional arrows showing a gradual decrease in work requiring physical activity. An important emotional/mental lesson for her was learning to let go and not being such a perfectionist.
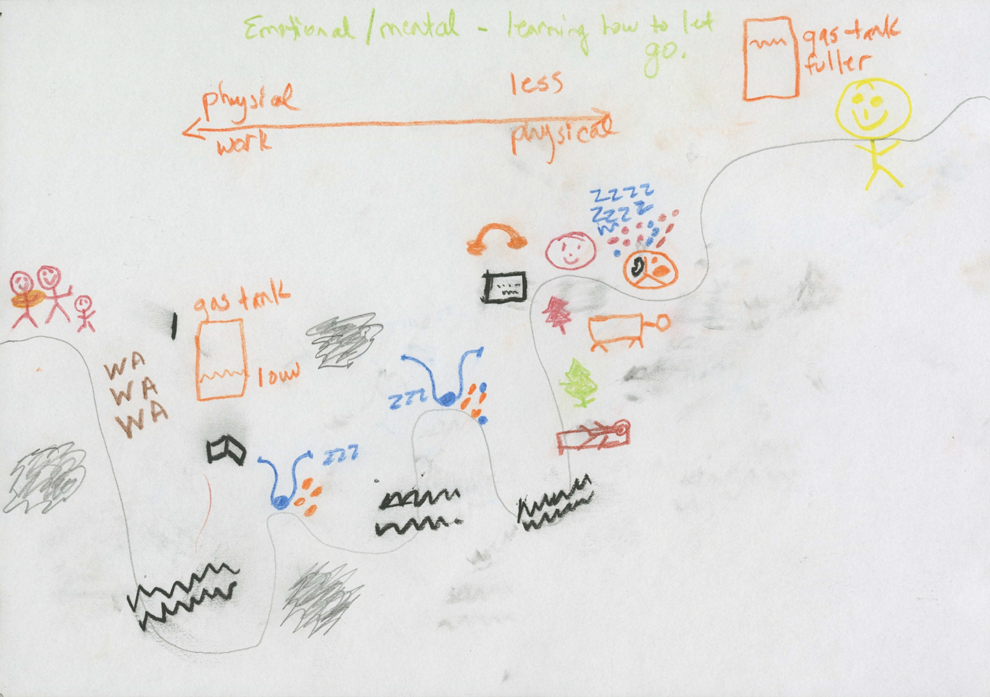
Color, path, and pictographic timeline (P21).
The timeline drawn by P6 is a traditional linear timeline, running from left to right, with years or ages as one axis, depicting events/phases in the illness journey (Figure 2). Information interactions such as researching and diagnosis appear in blue and affective experiences appear in red. This representation could potentially be useful for research intended to identify temporal points where patients feel a greater need for information and/or support and exploring the relationship between illness experiences and affective experiences.

Linear timeline (P06).
P14 employed a very different style of expression, drawing a five-page timeline using a mixture of text and cartoon figures, punctuated by questions and impressions at different time points (Figure 3). This representation facilitates an experiential understanding of the participant’s journey and ties together the participant’s cognitions with her affective reactions.
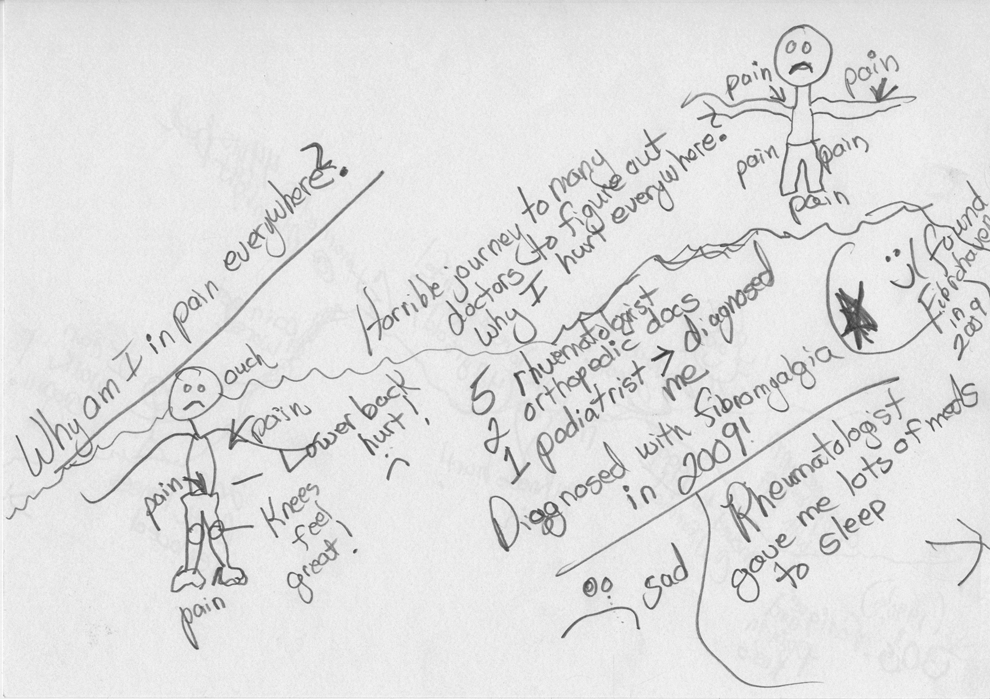
Cartoon + textual timeline (P14; 1 of 5).
Many of the timelines involved curvy paths, which seemed to be an apt analogy for the meandering nature of illness journeys. A number of the participants made comments to the effect that the path they had taken was not a straight line. P12 remarked of her path: You’re on this journey, but you don’t quite know where. And there’s places in it that I would make rocky, and places that have gone smoother…Maybe I thought I was going somewhere, and there were all these detours that didn’t really go anywhere.
Affordances
In this section, I reflect upon the affordances of the timeline drawing activity for exploring illness journeys. First, the use of this method was an apt one to study how participants’ information behaviors, including information seeking and use and communication with others, led to better health management over time. Fibromyalgia patients often have trouble explaining their experiences to others, and conversations with health-care professionals and others around them can be frustrating and invalidating (Barker, 2008; Kool et al., 2009). The timeline drawings helped illustrate how participants’ use of information, thought processes, and behavior changed over time, in ways that enabled them to improve their health management. For example, P21’s visual depiction, coupled with her interview testimony, aptly illustrated information seeking behaviors that met with marginal or no success (the reading of books and clinical consultations) and the gradual, cumulative successes with alternative medicine that led to a cognitive shift and altered worldview focused on wellness and the development of an effective health management routine.
Drawing the timelines also appeared to help participants focus on their bodily sensations and their emotions. For example, P14 drew a representation of herself, pain everywhere except her knees, to represent how she felt right after her double knee replacement surgery, which is the time point to which she attributes the beginning of her experience of her condition (Figure 3). She drew a big smiley face to represent her discovery of a support group that was instrumental to her path to feeling better.
The timelines afforded a view of how participants viewed time in relation to their journeys. The time periods depicted showed that participants had different ways of viewing their journey in relation to the rest of their lives. Some participants’ timelines began when they first noticed the symptoms that led to their diagnosis. Others went further back, perhaps even to childhood, seeing the symptoms as a continuation of a much longer journey. Some participants projected into the future. The variation thus demonstrates that the activity enabled participants to find their own ways of expression and, at the same time, illustrates the diversity of illness experiences.
Engaging in timeline drawing can also enable participants to work through their memories and engage in deeper reflection. The exercise helped participants to remember the past, as there were times when, as they were constructing the timeline, they would ask themselves whether the chronology was correct, think a bit more deeply about what actually had happened, or engage in other dialogic behavior which provoked them to work with their own mental representations of the past. Prior research has reported that engaging in timeline drawing can also elicit deeper reflection than might otherwise occur in an interview (Guenette & Marshall, 2009). The timeline drawing activity showed how the illness and other aspects of participants’ lives were inextricably connected, a goal that is consistent with the aim, in interpretative phenomenological analysis, of understanding the “person-in-context” (Larkin, Watts, & Clifton, 2006). To consider how the experiences of life and of illness might be connected, we might consider P22’s timeline (Figure 4). The two major downward trajectories depicted are (1) a cyclone, depicting the period after a disc break and (2) the divorce. The divorce is a life event that is not directly related to P22’s illness, but when we consider illness experiences, life events often come into the picture. Several participants in my study experienced problems with their partners due to health issues.

Pictograph-based timeline (P22).
In interpretative phenomenological analysis, there is an emphasis on meaning and sensemaking (Smith & Osborn, 2008). The researcher endeavors to make sense of the participant, who in turn is making sense of what is happening to them (Smith & Osborn, 2015). Smith and Osborne (2015) argue that the approach is “especially valuable when examining topics which are complex, ambiguous and emotionally laden” (p. 41). The open-ended nature of the timeline drawing activity and the tendency for participants to engage in deeper recall, processing, and reflection while engaged in the activity facilitated this focus on meaning making. The emergence of symbols and metaphors is also congruent with the philosophical foundations of this approach.
Methodological Challenges
Despite the aforementioned strengths, there were also challenges associated with the timeline drawing activity. There was great variety in terms of the timelines that participants drew, and the exercise showed that people have varying abilities to express themselves through drawing. There were participants who told their story better verbally, either on paper or orally. A few participants were uncertain about what to do without a clear set of instructions, and, for those participants, more suggestions were offered about what to include. For instance, they were asked to indicate points at which they had experienced emotions along the way or engaged in more or less information seeking (e.g., P06).
If one intends to perform a content analysis of timeline elements, providing participants different amounts of guidance would not necessarily be desirable since this would mean that there would be a level of inconsistency across interviews. However, in this case, the timeline was employed primarily as an elicitation technique and the interview content served as the primary content type for analysis; the goals of the research were to explore different types of illness journeys. Because interpretative phenomenological analysis was a basis for the research approach, variability within the sample was expected.
Summary and Comparison with Prior Work
In this study, one of the main research aims was to come to a greater understanding of how people’s health-related information behaviors and cognitive representations of health, illness, and life evolve over time. As such, asking participants to draw timelines was an ideal approach to encourage participants to share their experiences.
As stated in the Introduction, many research studies that have employed timelines have used more structured timelines. For example, Sheridan, Chamberlain, and Dupuis (2011) employed a timeline with time on one axis and weight in kilograms on the other. In doing so, their intention was to elicit discussions of sensitive categories including underweight, normal, overweight, and obese. Thygesen, Pedersen, Kragstrup, Wagner, and Mogensen (2011) employed a grid with emotion on one axis and a standardized gynecological cancer trajectory in the Region of Southern Denmark on the other. Inherent in both of these elicitation techniques is the explicit intention to focus the participants’ attention on a particular set of concepts.
In this study, my intention was to encourage participants to think broadly about their illness experience. Thus, I kept the prompt deliberately open-ended by asking participants to draw “something” that represented their illness journey and specifying that there need not be a line. Previous research has also opted to employ open-ended timelines for a similar reason (e.g. Kolar, Ahmad, Chan, & Erickson, 2015).
However, in this study, a greater proportion of the content depicted on the timeline appeared to be about information. Aside from the questions that explicitly asked participants about information behavior and conceptualization of health, illness, and life, it is likely that participants’ awareness of information as a focus of the study increased the tendency to depict information sources and change in illness beliefs over time. For example, previous research employed a more structured interview method, Dervin’s micro-moment time-line interview technique, to study gaps in individuals’ information needs, seeking, and use (St. Jean, 2012). While this approach may facilitate more precise identification of gaps and characterization of information sources, the approach that was employed in this study led to a more holistic depiction of the evolving relationship between information behavior and cognitive representations of health concepts over time.
The Online Scrapbook Viewing Activity
The second elicitation technique in this study employed an interactive, data-driven interface based on participants’ social media content. This interface, called the Online Scrapbook, was designed to enable participants to visually compare their participation across the different social media with which they have engaged over time. The Online Scrapbook was presented in the context of an interview on social media participation, after participants had already shared their illness journey and engaged in the timeline drawing activity. Participants were first asked about their impressions of different social media and then the Online Scrapbook was introduced. I explained how they could use the Online Scrapbook to explore their social media histories and then offered participants the opportunity to explore it.
As stated in the research focus section, participants in this study engaged in social media production to varying degrees. Regardless of whether they engaged in content production or not, the interview protocol included a set of questions concerning different social media types. This part of the procedure was intended to explore participants’ attitudes toward online health information, and it proved to be important, as many individuals who do not typically post (“lurkers”) consumed substantial amounts of health-related social media.
The Online Scrapbook
The Online Scrapbook is an interface with an interactive, data-driven timeline that is generated based on an individual’s social media participation history. In this visualization, each social media type that participants employed is depicted on a separate row (Figure 5). Examples of social media types include Twitter, Facebook, Reddit, MedHelp, and Tumblr. The size of each circle indicates the relative volume of posts during a given month, such that the larger the circle, the greater the number of posts in that month, and clicking on any given circle displays the corresponding social media content (e.g., Facebook status updates, tweets, and discussion posts). Previous visualization work has used similar indicators for social roles and participation in message boards and online health communities (Donath, 2002; MacLean & Hangal, 2009; Welser, Gleave, Fisher, & Smith, 2007).

The Online Scrapbook visualization (P05). Annotations were made by the researcher.
Digital traces represent reflections of the values and motives of their creator and/or user and, as such, should be studied in the context of their development and use (Hedman, Srinivasan, & Lindgren, 2013). Only through the study of multiple sources can we arrive at an understanding of the complexity of a phenomenon. A key purpose of this design was to enable participants to visually compare their participation across different types of social media through a single interface.
In the case of discussion forums, each post that is displayed also links back to the original posts on the source platform (e.g., Reddit), thus facilitating quick access to the context of these posts, which can be useful to both the study participant and the researcher. The Online Scrapbook also features a full-text search that could be used to identify posts and topics that feature prominently in participants’ testimonies.
In order to use the Online Scrapbook, it was necessary to collect participants’ social media content prior to their interviews. This included content that participants had authored on discussion forums, tweets, Facebook comments and notes, and in a few cases, health-related e-mail and listserv communications. The copies of the online artifacts underwent a preprocessing procedure in which the webpage display code was removed, and the content of participants’ posts was inserted into a MySQL database, which was then used by Online Scrapbook application to display the content.
Affordances
There are various strengths of the Online Scrapbook as an elicitation technique. First, the Online Scrapbook enabled participants to access content that they had often forgotten about. Many participants remarked that they liked the interface and that they found it interesting to look at their own content in that way: “This is cool! I haven’t looked at any of this in so long. It’s really crazy to see all of this stuff…” (P05). Even participants who had been diagnosed and had authored content regarding their condition relatively recently (i.e., within the last couple of years) had trouble recalling what they had posted. Thus, the interface was a handy tool to be able to collaboratively review the content that they had previously authored.
Like timeline drawing, the Online Scrapbook afforded an opportunity to explore how participants’ information seeking behaviors in relation to their health management goals. For example, we might consider P05’s social media participation (Figure 5). Like many others, she engaged more with social media toward the beginning of her journey, when she was most actively seeking information and she selectively employed different media platforms to answer different questions. When she was first diagnosed, she went to MedHelp to ask questions about condition management and to learn about others’ experiences. Later, she sought help through Chronic Marriage to seek solutions concerning her interactions with her spouse.
The timeline from the Online Scrapbook also facilitated a view of ebbs and flows of information seeking in conjunction with the evolution of one’s health condition. P17’s earliest social media traces date back to 1997, on the Google Groups listserv, alt.med.fibromyalgia (Figure 6). At this time, she was engaged in information exchange with others concerning fibromyalgia, but as time passed, she stopped engaging in these discussions. At the time of her second interview in 2014, she was participating in a forum for hair loss, called Alopecia World, due to her more recent onset of alopecia. Her history demonstrates the tendency for increased social media engagement from condition onset through the point of developing effective management strategies, disengagement as participants become accustomed to conditions and/or frustrated with online information, and renewed use due to the appearance of new conditions.

P17 participated actively in social media in the beginning of and recent period of her journey (Online Scrapbook).
The Online Scrapbook also calls attention to the degree of participant engagement on each medium, and differences in participation between media types, through the use of variable size indicators of participation. For example, P11 engaged in Facebook, Twitter, and online discussion forums but was most active on Twitter, tweeting over 3,000 times within the span of a year. P11 said that Twitter was her medium for “whining.” She and others within the sample felt a need to be more careful about disclosure on media such as Facebook, where there might be family members who would worry due to the content posted. P14 said that she engaged with Tumblr more earlier on because she needed an outlet for self-expression, but as she gained more control over her health and also was able to communicate her feelings concerning her illness with those around her, she felt less of a need to write. Thus, the Online Scrapbook also facilitates conversations about participants’ degrees of and motivations for engagement on different platforms. Other participants, such as P13 and P16, shared information on different platforms including Reddit and ProHealth but eventually their interest and participation waned due to the lack of response.
Aside from examining instances of information seeking, the Online Scrapbook could also be used to study examples of information disclosure. For example, P05’s Facebook participation was punctuated by two notes to her extended Facebook network, one announcing her condition and another thanking them for their support. She said that the notes enabled her to let those around her know that she was open to talking about her condition if they wanted to talk to her about it, without having to bring it up if people did not want to hear about it. Here, we see a strategic use of “context collapse” in the sense that the Facebook notes enabled her to reach out across multiple audiences at the same time (Marwick & boyd, 2011). P05 also explains her short-lived participation on two blogging platforms, Hibiscus Garden and Tumblr, saying that she prefers paper journaling to blogging, and though she occasionally comes across new platforms and engages with them enthusiastically, she loses interest over time.
Lastly, the Online Scrapbook might lead to conversations about how participants’ thought processes change over time. At the most basic level, P17’s patterns of engagement and disengagement with particular media illustrate her changes in information need. Other changes in thought were reflected not necessarily through the visualization, but rather through discussions about the content. For example, earlier on in his illness experience, P13 made quite a few posts about being in constant pain. However, at the time of the interview, he said of those posts, “Those are probably points where I was a little bit fed up, and not a lot of people seemed interested in my condition, and many people seemed to think that it didn’t even exist…But…since then it’s become quite clear that it’s a real condition, and nobody really questions it anymore, so I don’t really feel that way anymore.” Thus, the Online Scrapbook facilitates the revisiting of moments in the past, even if they have diminished in significance for participants and promotes reflection on the past as compared to the present.
Methodological Challenges
Despite the various affordances in the use of the Online Scrapbook, there were also challenges. Although participants were enthusiastic about the interface and found it interesting, many did not interact with readily. There might be various reasons for this. First, the interface was not the focus of the interview as much as the timeline drawing activity had been. Although the functionality of the interface was explained and demonstrated, participants were not asked to engage in tasks to make sure they understood. This was partially due to an overarching principle through which the study was initially conceived, in which it was desired for participants to determine the directions that they took. In addition, hands-on training would have increased what was already a substantial amount of interview time. However, it seems that in order to increase engagement, it would be helpful to ask participants to perform explicit tasks with the interface in a manner that is as nondirective as possible. Although it was useful to be able to see in a single visualization how individuals participated across a range of social media channels, creation of the visualization did present challenges. There was the logistical challenge of collecting social media artifacts from multiple platforms, storing the data, and presenting it through the interface. Generally, a different script was written for each platform. In some cases, it was difficult to collect all of the social media that a participant had authored due to site design or accessibility over time. Given the effort involved, it is important to consider whether this investment is worth the potential gain.
In addition, the Online Scrapbook emphasizes certain characteristics of participation, such as temporal period and post volume (number of posts). More sophisticated analysis tools that provide semantic information, such as tag clouds or visual indicators that call attention to important metadata such as post length, could assist participants to identify themes that are personally significant. For example, in one of P09’s lengthier Reddit posts, she vented about multiple frustrations including the difficulties of having an invisible illness and her father’s passing. In a display based on the number of posts, this one would not stand out. There were other participants who chose not to share information about their condition on social media. The inclusion of features that facilitate semantic exploration of post content, bring out posts that are thematically or structurally different, or call attention to gaps could potentially enrich the interview and analysis. These techniques could then lead to insights about the ways in which participants’ illness experiences have caused them to grow and change. In this study, in the interest of having participants tell their story in a way that came naturally to them, such assistive features were not included. Thus, the tension between making exploration easier and seeing where participants’ thoughts would naturally go is a critical issue to be addressed in this type of research.
Lastly, since the Online Scrapbook was based on a participant’s own social media production, it was only useful if participants engaged in social media production. Since the goal of this study was to understand participants’ health-related social media consumption regardless of their actual content production, an alternative implementation might be to allow participants to “collect” social media that they found interesting through it.
Summary and Comparison to Prior Work
There is extant visualization research that employs variable size indicators to depict social roles and participation in message boards and online health communities (Donath, 2002; MacLean & Hangal, 2009; Welser et al., 2007). It has also been observed that visual analytics techniques might be used to assist administrators in the monitoring of online health communities (Kwon et al., 2016). However, in this extant work, the original participants were not shown these interfaces, nor given the opportunity to comment on them. This study was an initial attempt to enable social media content authors to reflect upon their health histories through a visual interface. The Online Scrapbook viewing activity facilitated conversations about participants’ strategic use of media, for both information seeking and sharing, and about how their social media participation changed along with their illness and life circumstances.
To my knowledge, there has not been prior research employing a data-driven timeline based on multiple social media platforms as an elicitation technique. However, there has been prior work in which researchers and participants have engaged in collaborative viewing of the Facebook timeline. Schoenebeck, Ellison, Blackwell, Bayer, and Falk (2016) have observed that the Facebook timeline, introduced in September 2011, allows users to move quickly and chronologically through their own historical content to revisit past posts and relive memories, and in so doing, lowered the social and technical barriers to perusing past activities on the site.
This familiarity with the social media platforms that one is accustomed to has potential implications for the user experience of study participants using the Online Scrapbook. During one of my interviews with P12, she went to Facebook to try to locate content to support what she was saying, and she attempted to locate this content based on her memory of where it was on the page. Given how accustomed some individuals are with Facebook, it can be difficult to engage them in the use of the Online Scrapbook. Engaging participants in activities that demonstrate the power of the interface to find content of interest could encourage them to use the platform.
There is a bit of a cost here in the sense that participants may not be able to find information as easily using a novel platform as they might on platforms to which they are accustomed. However, the Online Scrapbook offers multiple potential benefits including the ability to view and analyze multiple forms of social media participation for the same person and more analytic power. Thus, these are trade-offs for the researcher to consider in their choice of elicitation technique.
Discussion and Conclusion
This article described the use of two visual elicitation techniques, a timeline drawing activity and the Online Scrapbook viewing activity. The Online Scrapbook is an interactive, data-driven timeline of social media participation that enabled participants to revisit and explore their previously authored social media content. In this study, the timeline drawing activity provided an overview of participants’ lives and illustrated the relative salience of items depicted. The Online Scrapbook drew from social media data sources to create an interactive interface that served as both a conversation piece and an interrogative tool.
We now consider how the two techniques, when used together, can facilitate a richer understanding of participants’ illness experiences, using the affordances described in preceding method sections (Table 1). I began with the timeline drawing activity, which tended to be holistic. Participants reflected upon many facets of their lives including physiological, psychosocial, work, and school-related challenges. It was generally more participant-driven, as the researcher provided probes as needed, and participants chose what to draw and share. As a result, there is also a natural depiction of salience. Participants are able to “speak through their language” and use the tools of expression to which they are accustomed, whether it be pictographs, text, symbols, or metaphor. Thus, the timeline drawing activity elicits a representation of a participant’s illness journey, seen from their perspective.
The Timeline Drawing Activity and Online Scrapbook: A Comparison of Elicitation Affordances.

The timeline drawing activity established an initial understanding of participants’ stories, which was then enriched through a discussion focused on information behaviors, and using the Online Scrapbook. In contrast to the timeline drawing activity, which often depicted broad swaths of time and participants’ states of mind and behaviors over an extended period, the Online Scrapbook was more narrowly focused and provided “snapshots”—specific incidents, information needs, and communicative instances.
Because it was driven by digital artifacts, it inherently emphasized information behavior and communicative processes, and unlike studies involving photovoice such as Meo (2010) in which participants intentionally captured and chose what to depict, these artifacts were produced naturalistically over time and were not filtered through the lens of the participants or the lens of the researcher for presentation at the time of data collection. Thus, it can provide insight into what was previously important to participants but had faded in significance by the time of the interview.
The Online Scrapbook houses artifacts from that journey and affords viewers an alternate set of views, with emphasis on the plural. Views of participants derived from a single social media type might be one-sided, due to their discretionary use of the platform. For example, several participants refrained from disclosing health information on Facebook and other participants used particular platforms for “venting.” People can also construct different “selves” or personas on different social media platforms (Takahashi, 2010; Van Dijck, 2013). Seeing how participants construct these different versions of self can also help us to understand how they are dealing with their condition over time.
Whereas the timeline drawing activity tended to be more participant driven, collaborative exploration through the Online Scrapbook could be either participant driven or researcher driven, depending on the extent to which participants engaged in the activity. In this study, as I tended to spend quite a bit of time prior to interviews examining participants’ content through the interface, a fair amount of the interview might be devoted to questions that I had initiated about participants’ social media content.
Thus, used together, the timeline drawing activity and the Online Scrapbook can facilitate a richer understanding of participants’ experiences by encouraging reflection through multiple lenses and views. The two activities also complement each other in the sense that they provide participants different avenues for expression.
Lastly, we might consider alternative ways of integrating the two activities. We consider a several variations: (1) varying the order of the activities, (2) integrating elements of the timeline into the Online Scrapbook viewing activity, and (3) facilitating sensemaking through the Online Scrapbook viewing activity.
In this study, I began with the timeline drawing activity to establish a common understanding of participants’ life histories. Doing so also then placed emphasis on the participant’s own interpretation of their illness history. What might happen if one were to start with the Online Scrapbook? As discussed earlier, the Online Scrapbook focuses the discussion on information exchanges and communication processes. Thus, starting with the Online Scrapbook might be effective if the research were more focused on individual information interactions as compared to the overall timeline. Some individuals might also be more comfortable starting out with their social media participation than their personal history. This could potentially lead to better recall with the timeline drawing activity, but admittedly, the recall would most likely be colored by what the participant disclosed over social media.
Another possibility might be integrating elements of the timeline into the Online Scrapbook viewing activity. In this study, I had originally considered asking participants to select activities from their own hand-drawn timelines, which would automatically be embedded into the Online Scrapbook timelines at the appropriate points. In the end, this idea was not implemented because there was some concern that the most important items on the hand-drawn timelines might not be discrete events, but rather periods of time. This often turned out to be the case. While I still think that this might be an interesting possibility, it would be useful to consider integrating functionality to include not only events but periods of time, drawn by study participants on their timelines.
We now consider alternate implementations to increase opportunities for sensemaking using the elicitation techniques. First, one might consider asking participants to prepare for the timeline drawing activity and/or elaborate on the timeline after the session. Several of the participants actually offered to do so of their own accord, and I told them that they could certainly do so if they wanted, but that I was not expecting them to. I did not ask them to prepare either, as I wanted to reduce the burden on them as much as possible.
However, there are opportunities to increase sensemaking during the Online Scrapbook viewing activity. Aside from the possibility of offering features that extract common themes from participants’ social media content, another interesting feature would be to offer participants the opportunity to annotate their own Online Scrapbook visualizations, in perhaps a similar way as I have done with the Online Scrapbook visualizations shown in this article. This approach places greater emphasis on the value of activity-based learning in that engaging in creative activities can cause participants to have additional insights concerning the material that they are considering—their own personal histories.
In summary, the use of the timeline drawing and Online Scrapbook viewing activities together brought out the richness and complexity of the relationship of participants’ information behavior to their health management as well as encouraged participants to reflect on their journeys. Coupling the Online Scrapbook activity strategically with the timeline drawing activity in interviews facilitated a more nuanced view of participants’ lives and how different aspects of a person’s life are interwoven.
Footnotes
Acknowledgments
I would like to thank the study participants who contributed their experiences to this research; Drs. Barbara M. Wildemuth and Stephanie W. Haas at the University of North Carolina, Chapel Hill, for their advice and suggestions during the process of writing this manuscript; and the reviewers, for their helpful feedback.
Declaration of Conflicting Interests
The author(s) declared no potential conflicts of interest with respect to the research, authorship, and/or publication of this article.
Funding
The author(s) received no financial support for the research, authorship, and/or publication of this article.