
Abstract
Introduction: Whether stroke survivors can meet risk factor recommendations set by guidelines is unknown. We investigated the proportion of stroke survivors that met the secondary prevention guideline recommendations, analyzed the trends over time, and assessed the impact on mortality. Methods: Using cross-sectional data on stroke survivors from the National Health and Nutrition Examination Survey (NHANES) from 1999-2018, we determined the proportion of stroke survivors who met guideline recommendations. We performed linear regression analyses to determine trends and performed Cox-proportional hazards models to assess mortality. Results: We included 2197 stroke survivors (51% female, mean age 68). Most patients met guidelines set for alcohol consumption (93% [95% CI 91-95]), while few met the thresholds for physical activity (18% [95% CI 15-30]) or BMI (25% [95% CI 22-27]). The proportion that met guidelines for blood pressure (+1.4% every 2 years) and LDL (+3.0%) increased, while the proportion that met physical activity guidelines decreased (−1.1%). Mortality was increased in those that did not meet recommendations regarding blood pressure (HR 1.24 [95% CI 1.04-1.48]) and smoking (HR 1.30 [95% CI 1.03-1.64]). Conclusion: More than half of stroke survivors do not meet recommendations set by prevention guidelines on BMI, physical activity and LDL.
“Use of lipid-lowering and glucose-lowering medication increased, while use of blood pressure-lowering drugs remained constant.”
Introduction
Stroke remains a leading cause of morbidity and mortality worldwide. Previous estimates have indicated that stroke is currently the second most common cause of death, and the third leading contributor to disability-adjusted life years. 1 Given the aging population, this high burden of stroke is expected to rise even further. 2 Of all strokes, around 25% are attributable to recurrent events. 3 This necessitates effective secondary prevention strategies to mitigate the risk of recurrent events and improve long-term outcomes.
Secondary prevention strategies involve managing and controlling risk factors for stroke recurrence, such as blood pressure, body mass index (BMI), low-density lipoprotein (LDL) cholesterol, glycated hemoglobin (HbA1c), smoking, alcohol consumption and physical activity. With adequate risk factor management, risk of recurrent stroke can be reduced by 80%. 4 Previous studies have shown that after stroke, the vast majority of patients receive risk factor lowering therapies such as medication to control blood pressure or LDL, or education programs for smoking cessation or weight loss. 5
Despite these interventions, it remains unclear whether stroke survivors routinely meet the risk factor thresholds set by secondary prevention guidelines. We aimed to determine what proportion of stroke survivors meet these thresholds, how this is affected by medication use, what the trends over time are, and how not meet guideline recommendations affects mortality.
Methods
Data Collection
The National Health and Nutrition Examination Survey (NHANES) is iteratively conducted by the National Center for Health and Statistics. 6 It consists of multiple cross-sectional data collections, where the design is focused on the representativeness of the cohort to the US population. Data collection methods include physical examinations, laboratory measurements, and at-home interviews. These data are publicly available and released in 2-year cycles. In this study, we analyzed data from ten iterations, between 1999 and 2018. We collected data on demographics, history of stroke, blood pressure, BMI, HbA1c, LDL, self-reported smoking, self-reported alcohol use and self-reported physical activity. Using the second level category ID from the Multum Lexicon Therapeutic Classification Scheme provided by the NHANES drug information files, we further collected data on the use of antihypertensives (defined as a beta-blocker, calcium channel antagonist, ACE-inhibitor, angiotensin-2 inhibitor or a combination), lipid-lowering drugs (defined as a statin) or glucose-lowering drugs (defined as using metformin or insulin). We then linked the data with death certificate records from the National Death Index, updated through December 31st, 2019 to obtain mortality status and time to follow-up. 7
Inclusion and Exclusion Criteria
We included all patients with a history of stroke, defined as answering “Yes” to the question: “Has a doctor or other health professional ever told you that you had a stroke?” Exclusion criteria were: (a.) Age <18, (b.) Previous history of myocardial infarction, (c.) missing history of stroke, and (d.) refusal to answer history of stroke questions or those who answered that they did not know their stroke history.
Definition of Outcomes
Using the secondary prevention guidelines that were in effect between 1999-2018 for each risk factor, we defined meeting the guidelines using the following cut-off values: (a.) Blood pressure <140/90 mmHg averaged across 1 to 3 measurements (depending on availability in the NHANES dataset), (b.) 19.5 < BMI <25, (c.) HbA1c < 7.0%, (d.) LDL-C <100 mg/dL, (e.) Not answering the question “Do you now smoke cigarettes?” with “Some days” or “Every day,” (f.) Having <3 drinks per day for male and <2 drinks per day for female participants and (g.) Reporting >75 minutes of vigorous or >150 minutes of moderate physical activity a week (or an equivalent combination). 8 We chose not to include the most recent LDL secondary prevention guidelines that have gone into effect in 2021, as these were not yet in practice during our study period. 4 To examine trends in medication use and risk factor control, we defined a risk factor as being (I) controlled if a patient used corresponding medication and guideline recommendation was met; (II) uncontrolled if a patients used medication and guideline recommendation was not met and; (III) unaware if a patient did not use medication and guideline recommendation was not met. We did not include nutritional information, as dietary guidelines have evolved substantially within our study period. While initial guidelines recommended a diet rich of fruits, vegetables and low-fat dairy, this gradually evolved into an endorsement of the Mediterranean diet.4,8
Statistical Analysis
Descriptive statistics were used to describe populations demographics and risk factors. We reported mean and standard deviation (SD), median with first (Q1) and third (Q3) quartile or proportion with 95% confidence interval (CI) where appropriate. To account for the complex survey design of NHANES, we set up the survey design for our cohort, which includes specifying the primary sampling units, strata and survey weights. 9 We calculated the survey-weighted proportion and 95% CI of those that meet guideline recommendations for each risk factor, as specified in the statistical guidelines from NHANES. We then estimated the number of patients that did not meet guideline recommendations. We calculated survey-weighted proportion and 95% CI per risk factor per chronological 2-year NHANES iteration and plotted them, smoothing out the curves using the locally estimated scatterplot smoothing (LOESS) method. 10 To examine trends in meeting guideline recommendations over time, we conducted trend analysis by fitting a survey-weighted generalized linear model using the iteration (time) as the predictor variable. We performed the same calculations of proportions and trends for drug use and risk factor control in hypertension, hyperlipidemia and diabetes. For each risk factor, we then used survey-weighted Cox-proportional hazard models, adjusted for a priori chosen demographic confounders (age group [stratified to 20-34, 35-49, 50-64 and 65+], sex, race, and education level) to determine the effect of meeting the guideline thresholds on mortality after stroke. To isolate the effect of physical activity from motor deficits on mortality, we additionally adjusted the model including physical activity for the question “because of a health problem, do you have difficulty walking without using any special equipment?”. Schoenfield residuals were calculated, and proportional hazards assumption was met in all models. For those risk factors where not meeting guideline recommendations significantly impacted mortality, we calculated the attributable risk as previously described, using survey-weighted exposure prevalence, the hazard ratio and 95% confidence interval. 11 We then scaled the obtained attributable risk by the number of expected deaths (derived from the survey-weighted prevalence of mortality in our dataset multiplied by the previously estimated number of stroke survivors) to obtain a number of potentially salvageable patients if all were able to meet guideline recommendations. All analyses were performed using R studio, version 4.2.0.
Results
Included Participants
Weighted Characteristics of Included Participants.
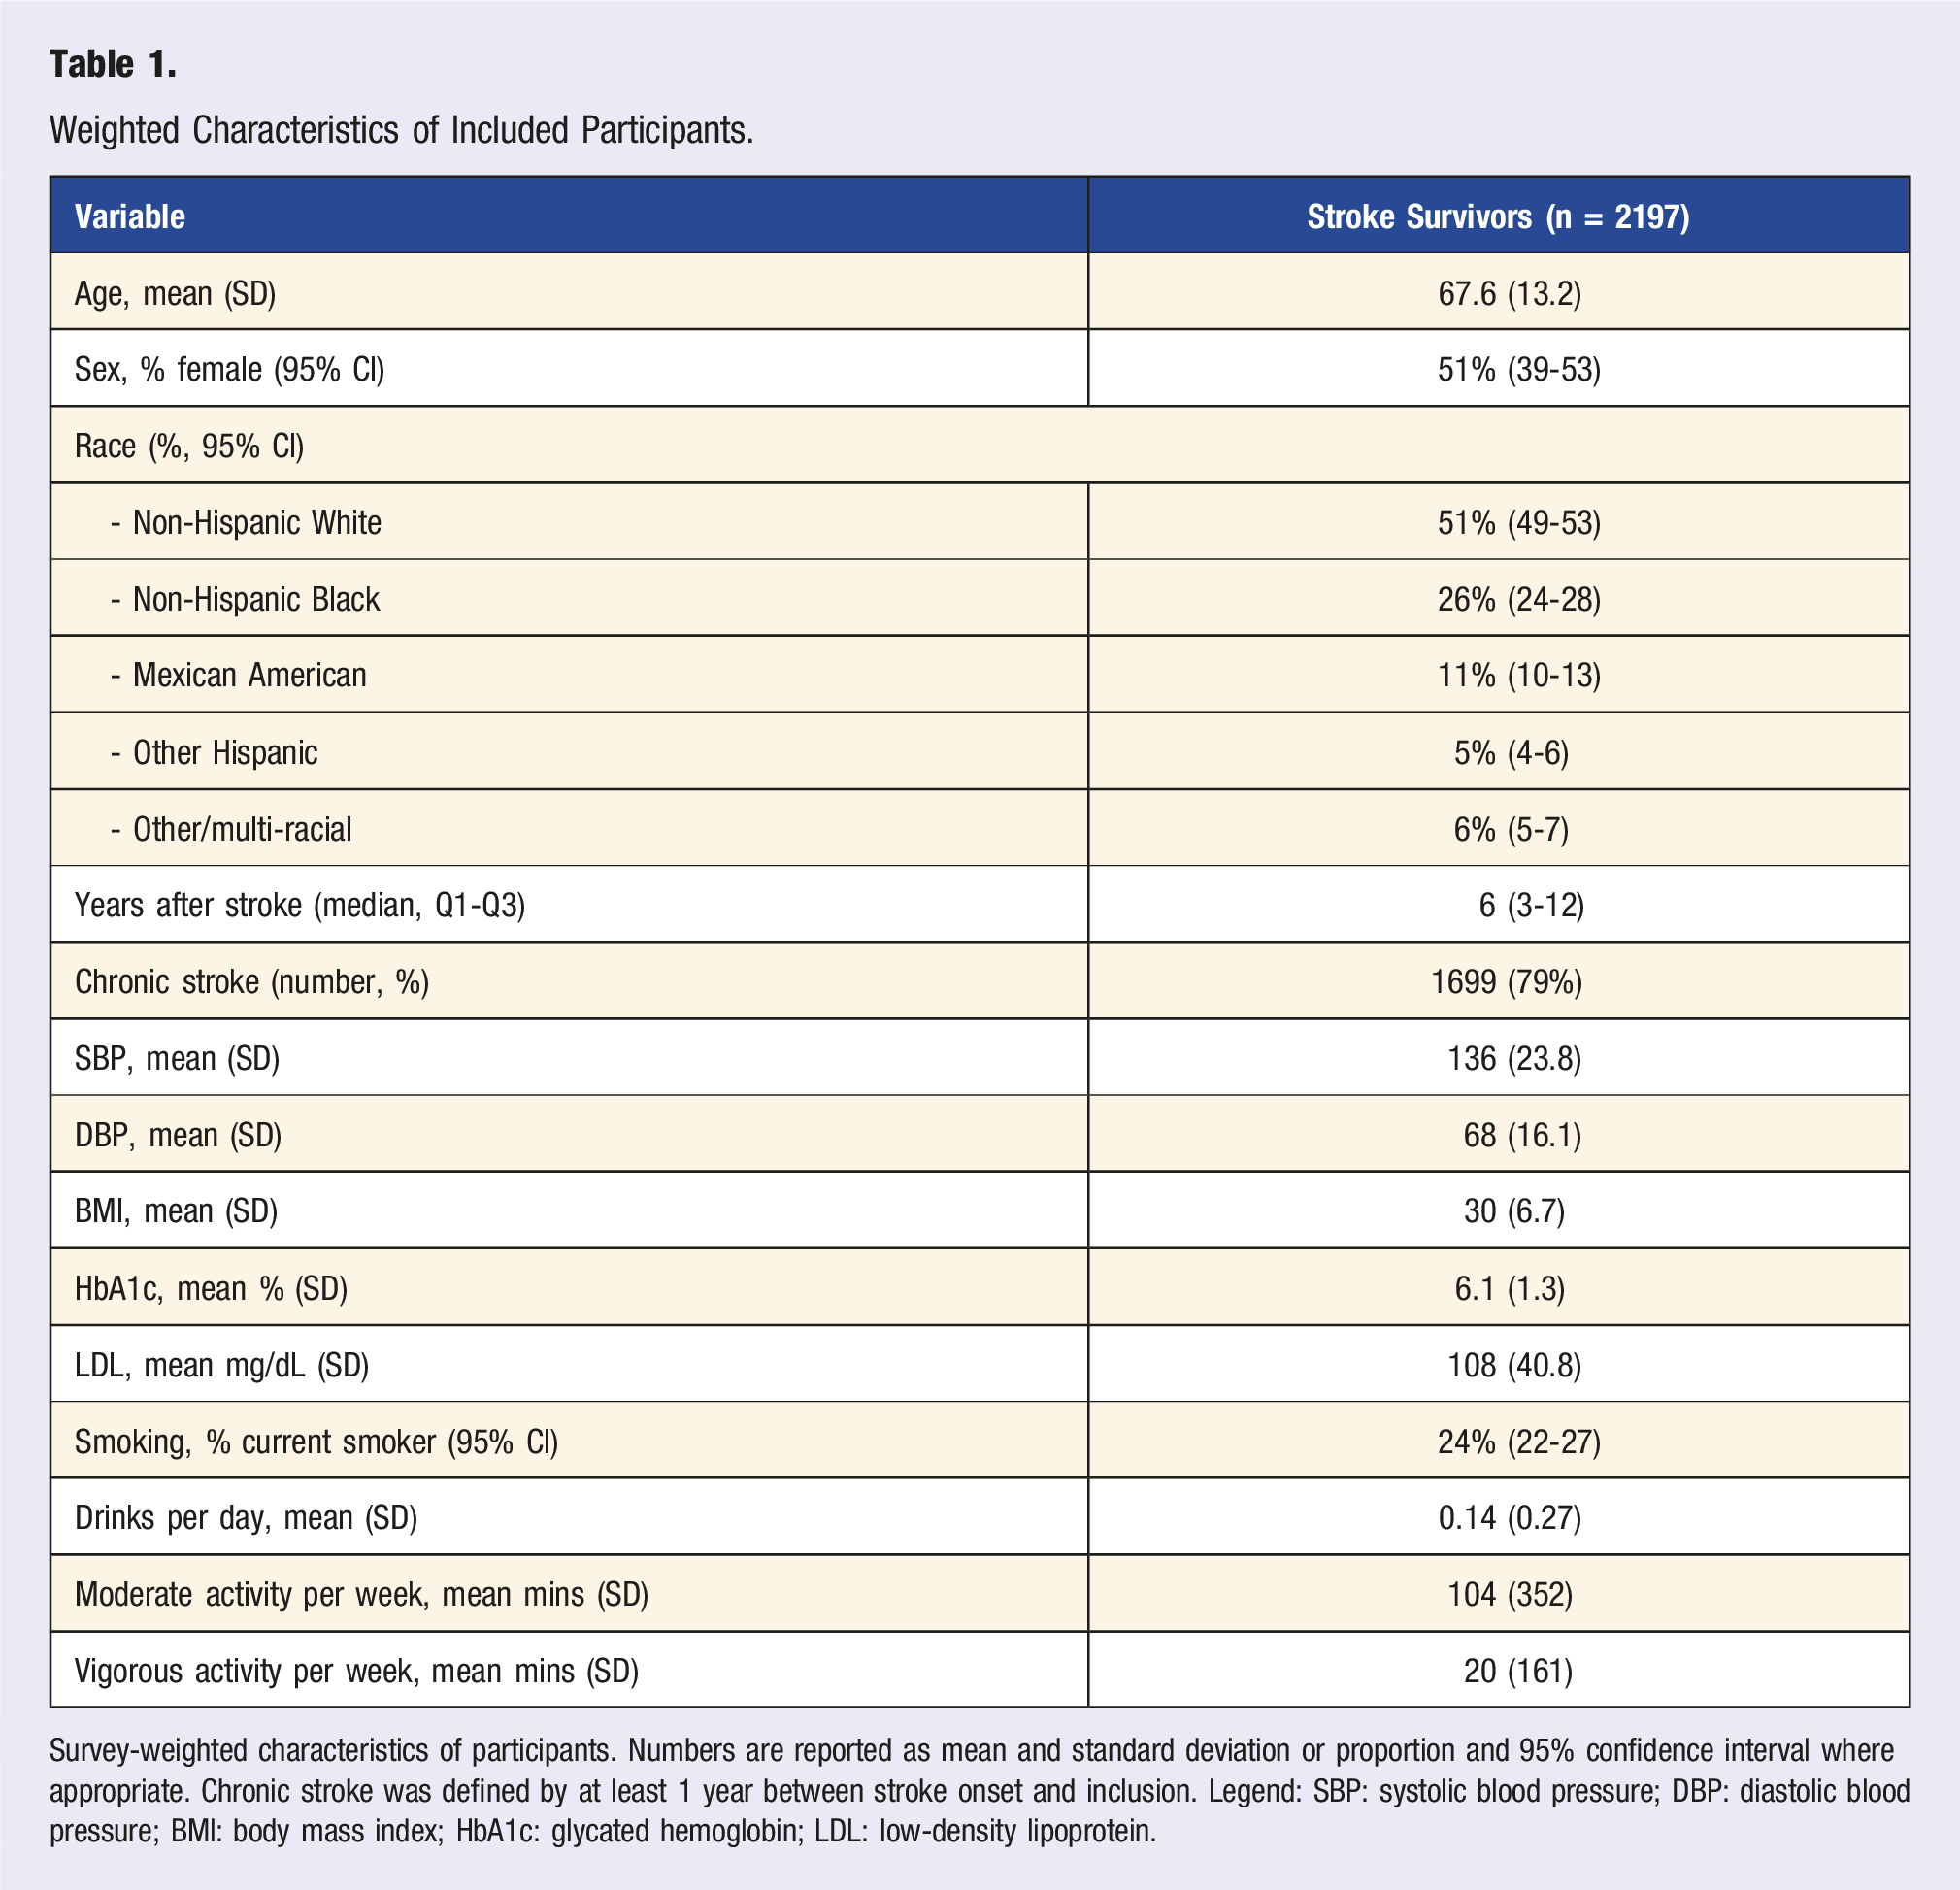
Survey-weighted characteristics of participants. Numbers are reported as mean and standard deviation or proportion and 95% confidence interval where appropriate. Chronic stroke was defined by at least 1 year between stroke onset and inclusion. Legend: SBP: systolic blood pressure; DBP: diastolic blood pressure; BMI: body mass index; HbA1c: glycated hemoglobin; LDL: low-density lipoprotein.
Trends in Meeting Guideline Recommendations
Proportion of Stroke Survivors That Meet Guideline Recommendations.
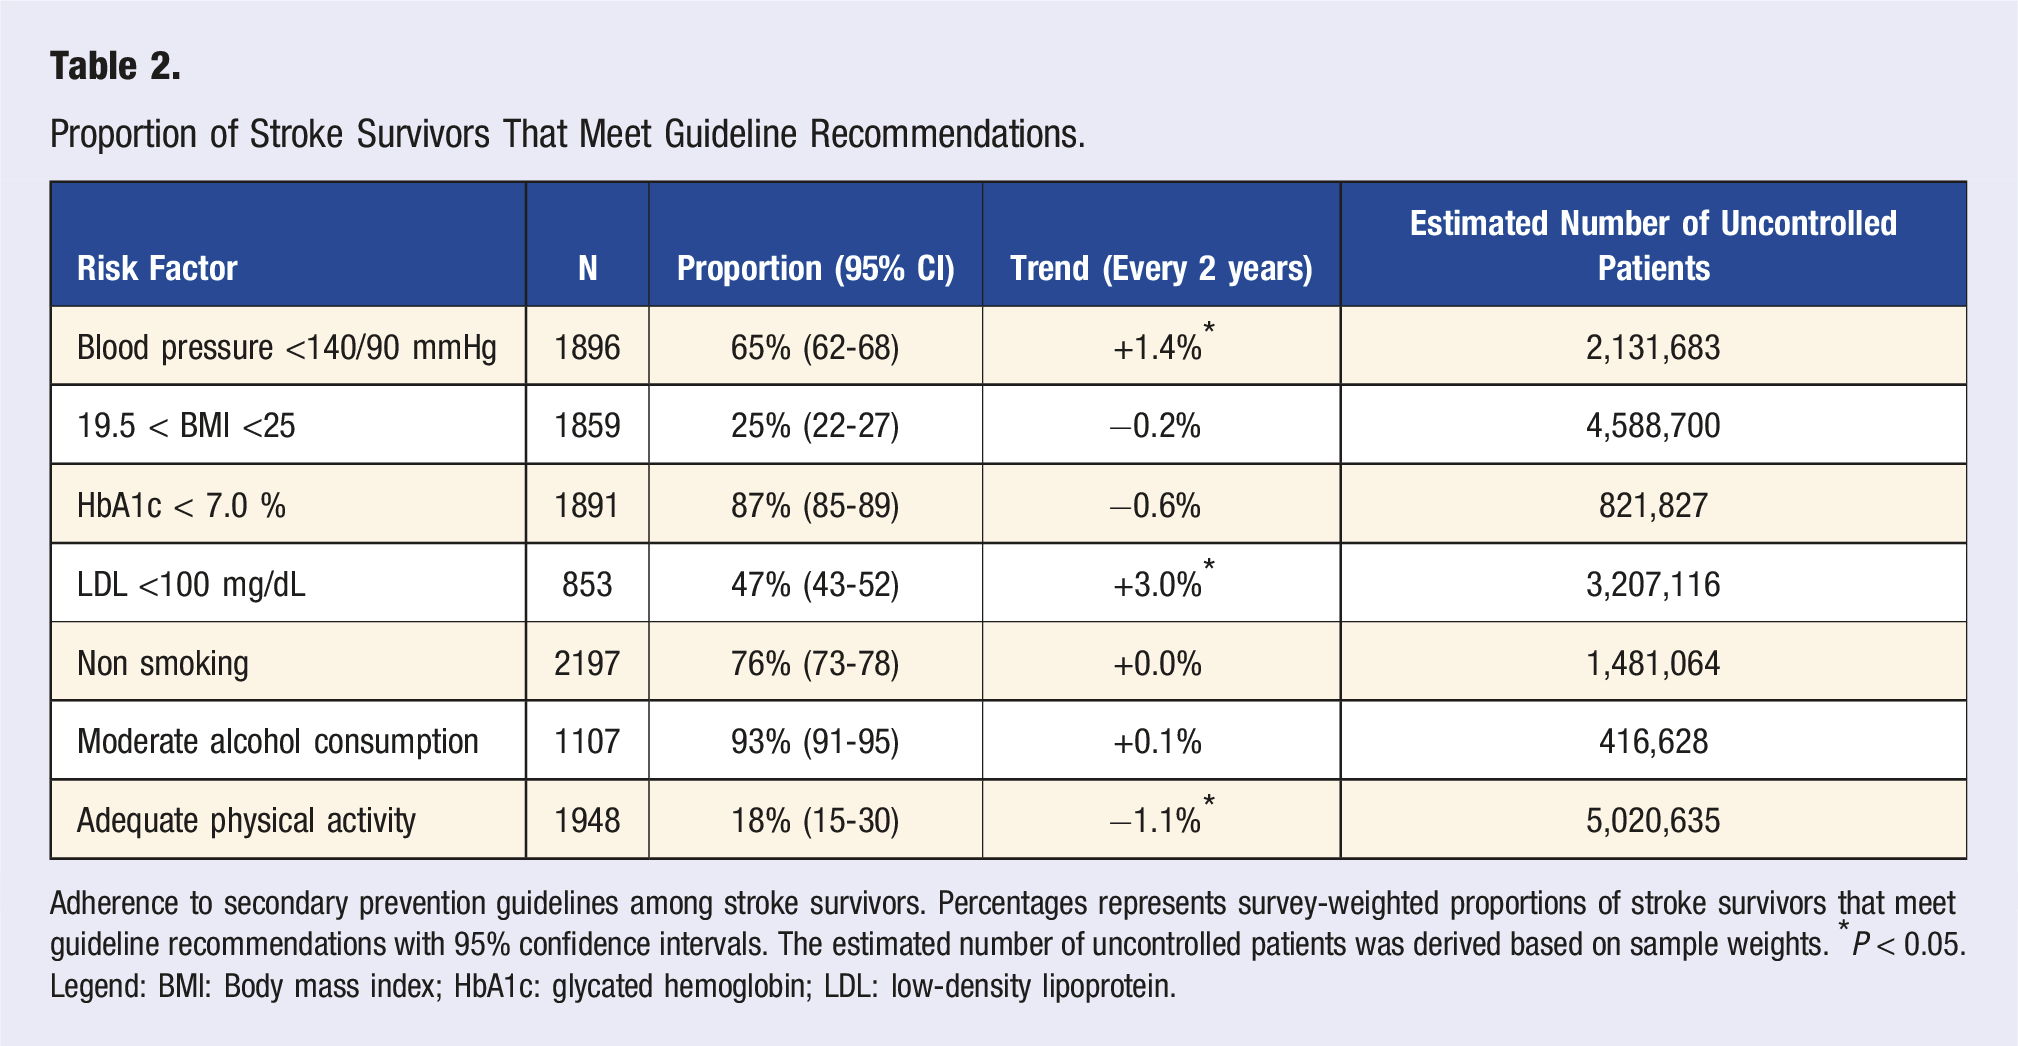
Adherence to secondary prevention guidelines among stroke survivors. Percentages represents survey-weighted proportions of stroke survivors that meet guideline recommendations with 95% confidence intervals. The estimated number of uncontrolled patients was derived based on sample weights. *P < 0.05. Legend: BMI: Body mass index; HbA1c: glycated hemoglobin; LDL: low-density lipoprotein.
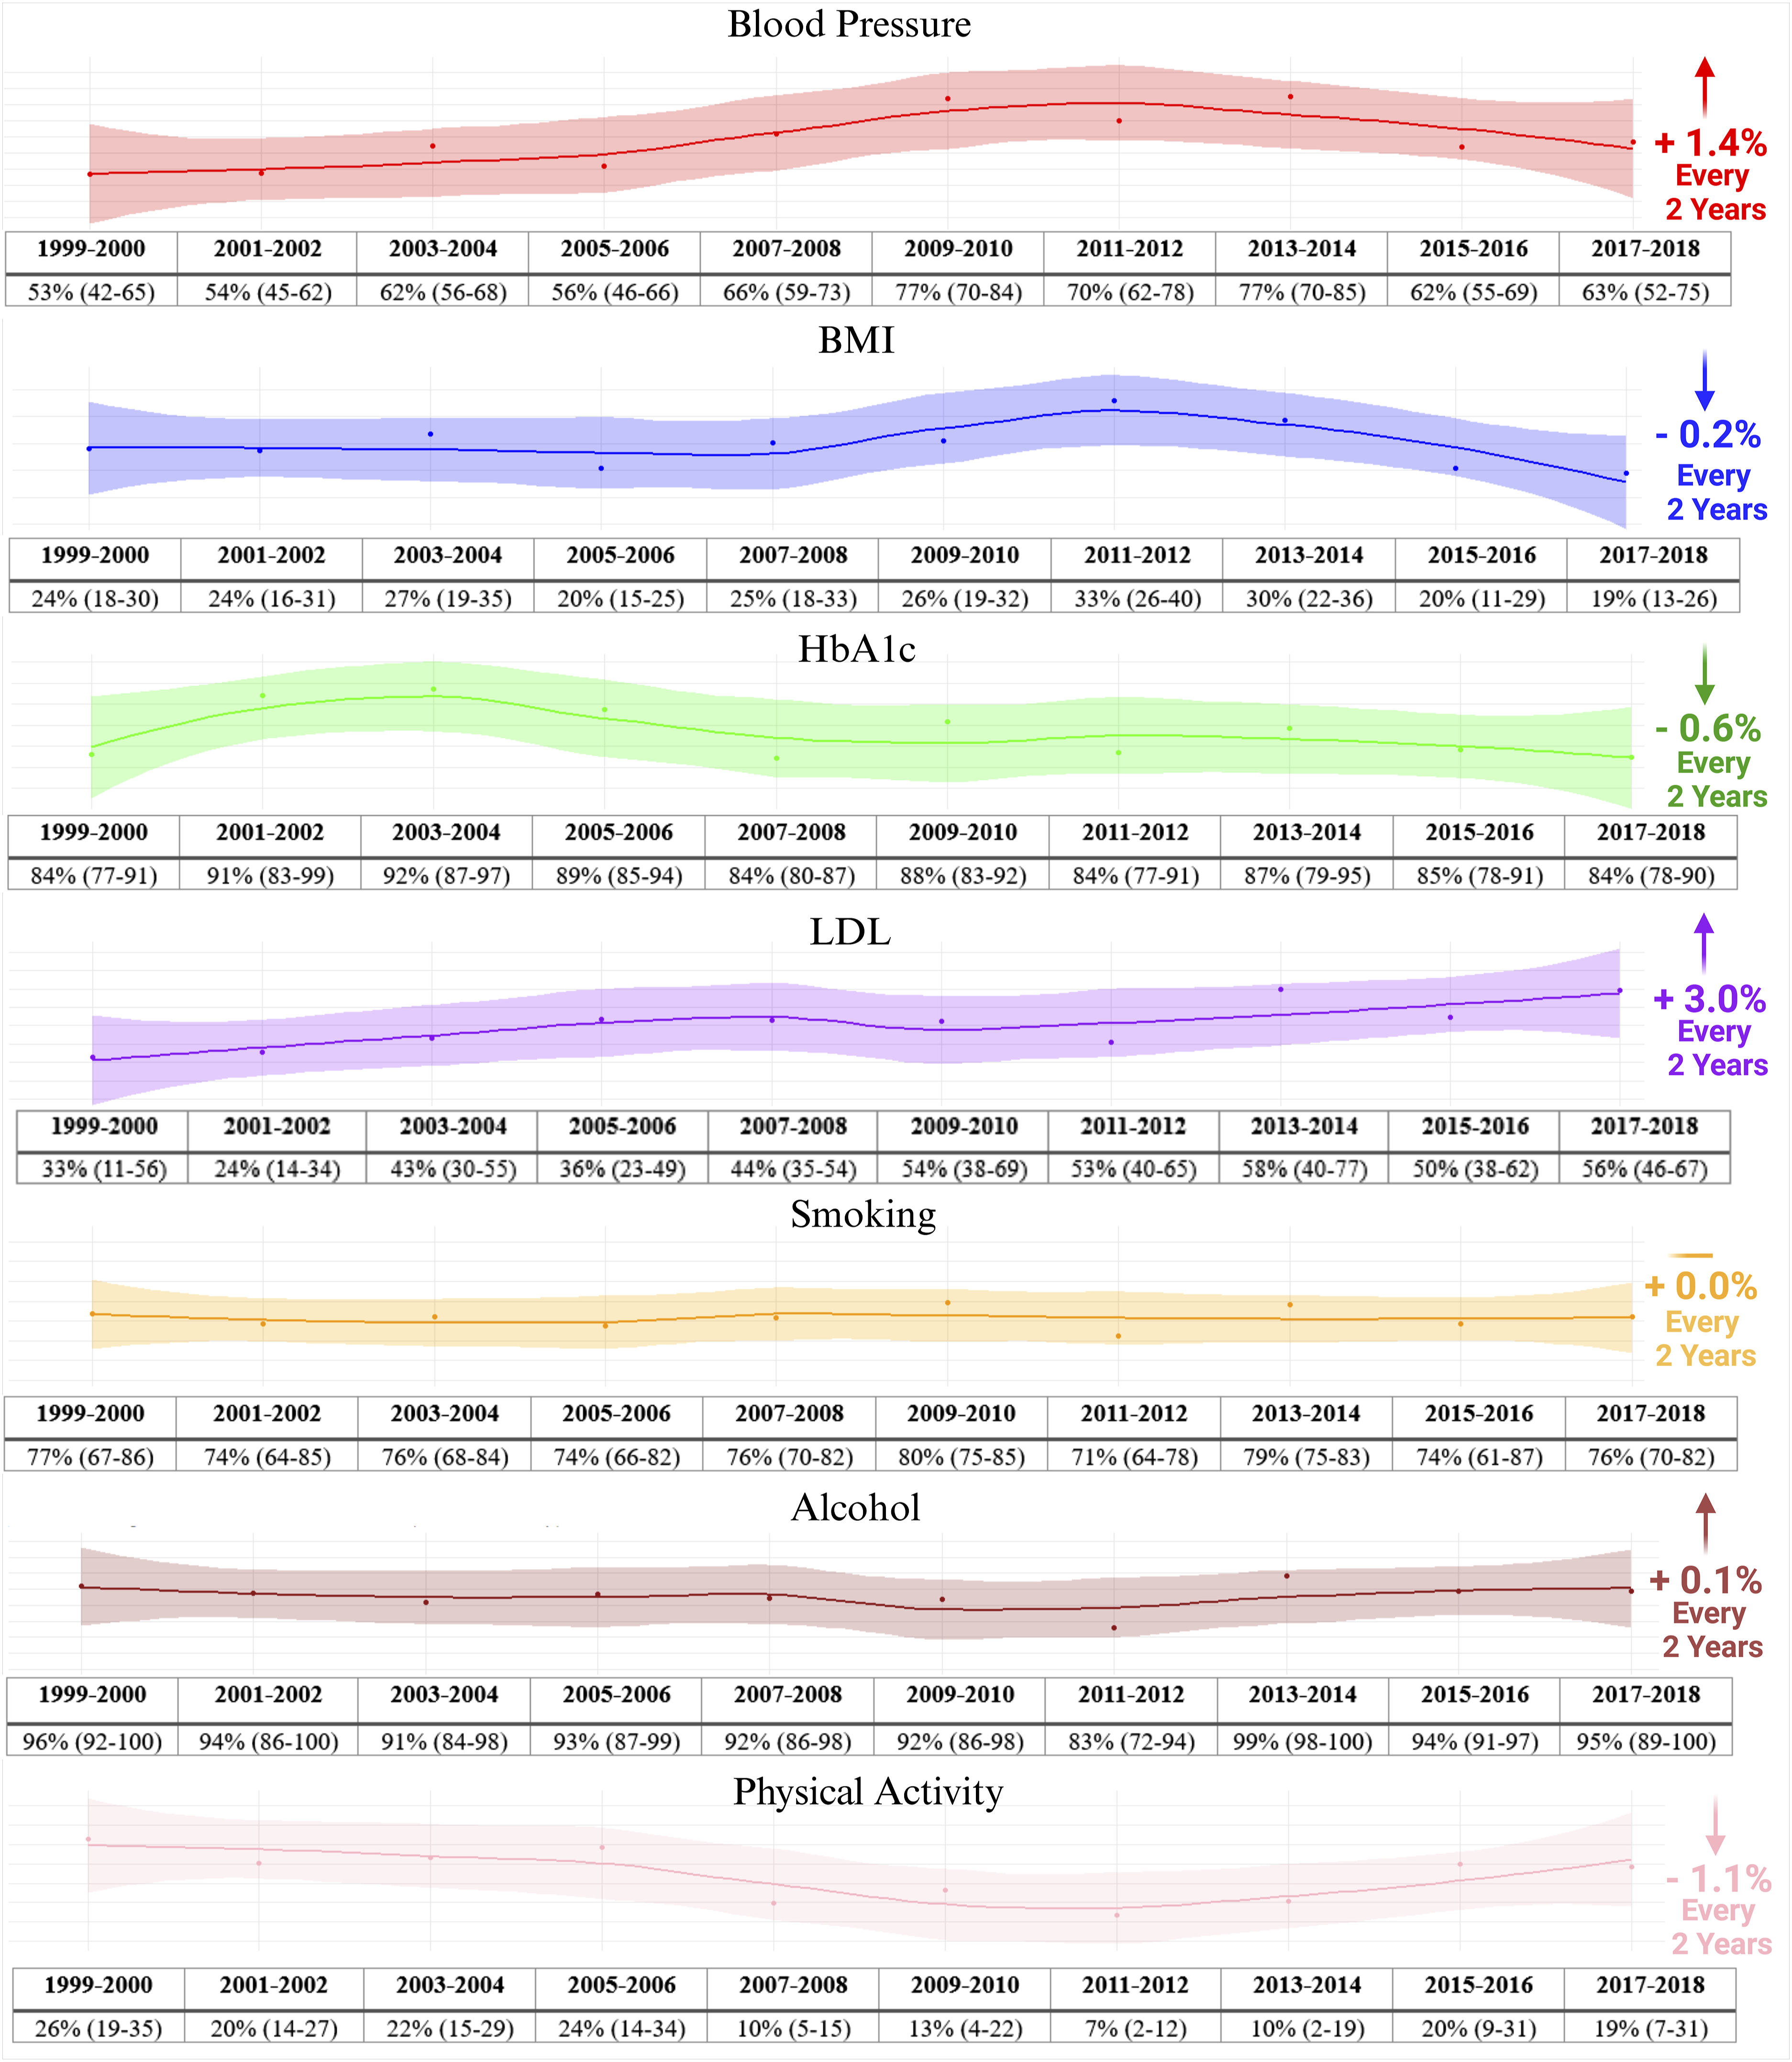
Trends in meeting guideline recommendations among stroke survivors Trends in the proportion of stroke survivors that meet secondary prevention guideline recommendations. Shown are survey-weighted proportions with 95% confidence intervals. Trend (right) represents average increment in proportion of adherence per 2-year iteration. Legend: BMI: Body Mass Index; LDL: Low-Density Lipoprotein; HbA1c: Glycated Hemoglobin A1c.
Trends in Medication Use and Risk Factor Control
Trends in Medication Use and Risk Factor Control Among Stroke Survivors.
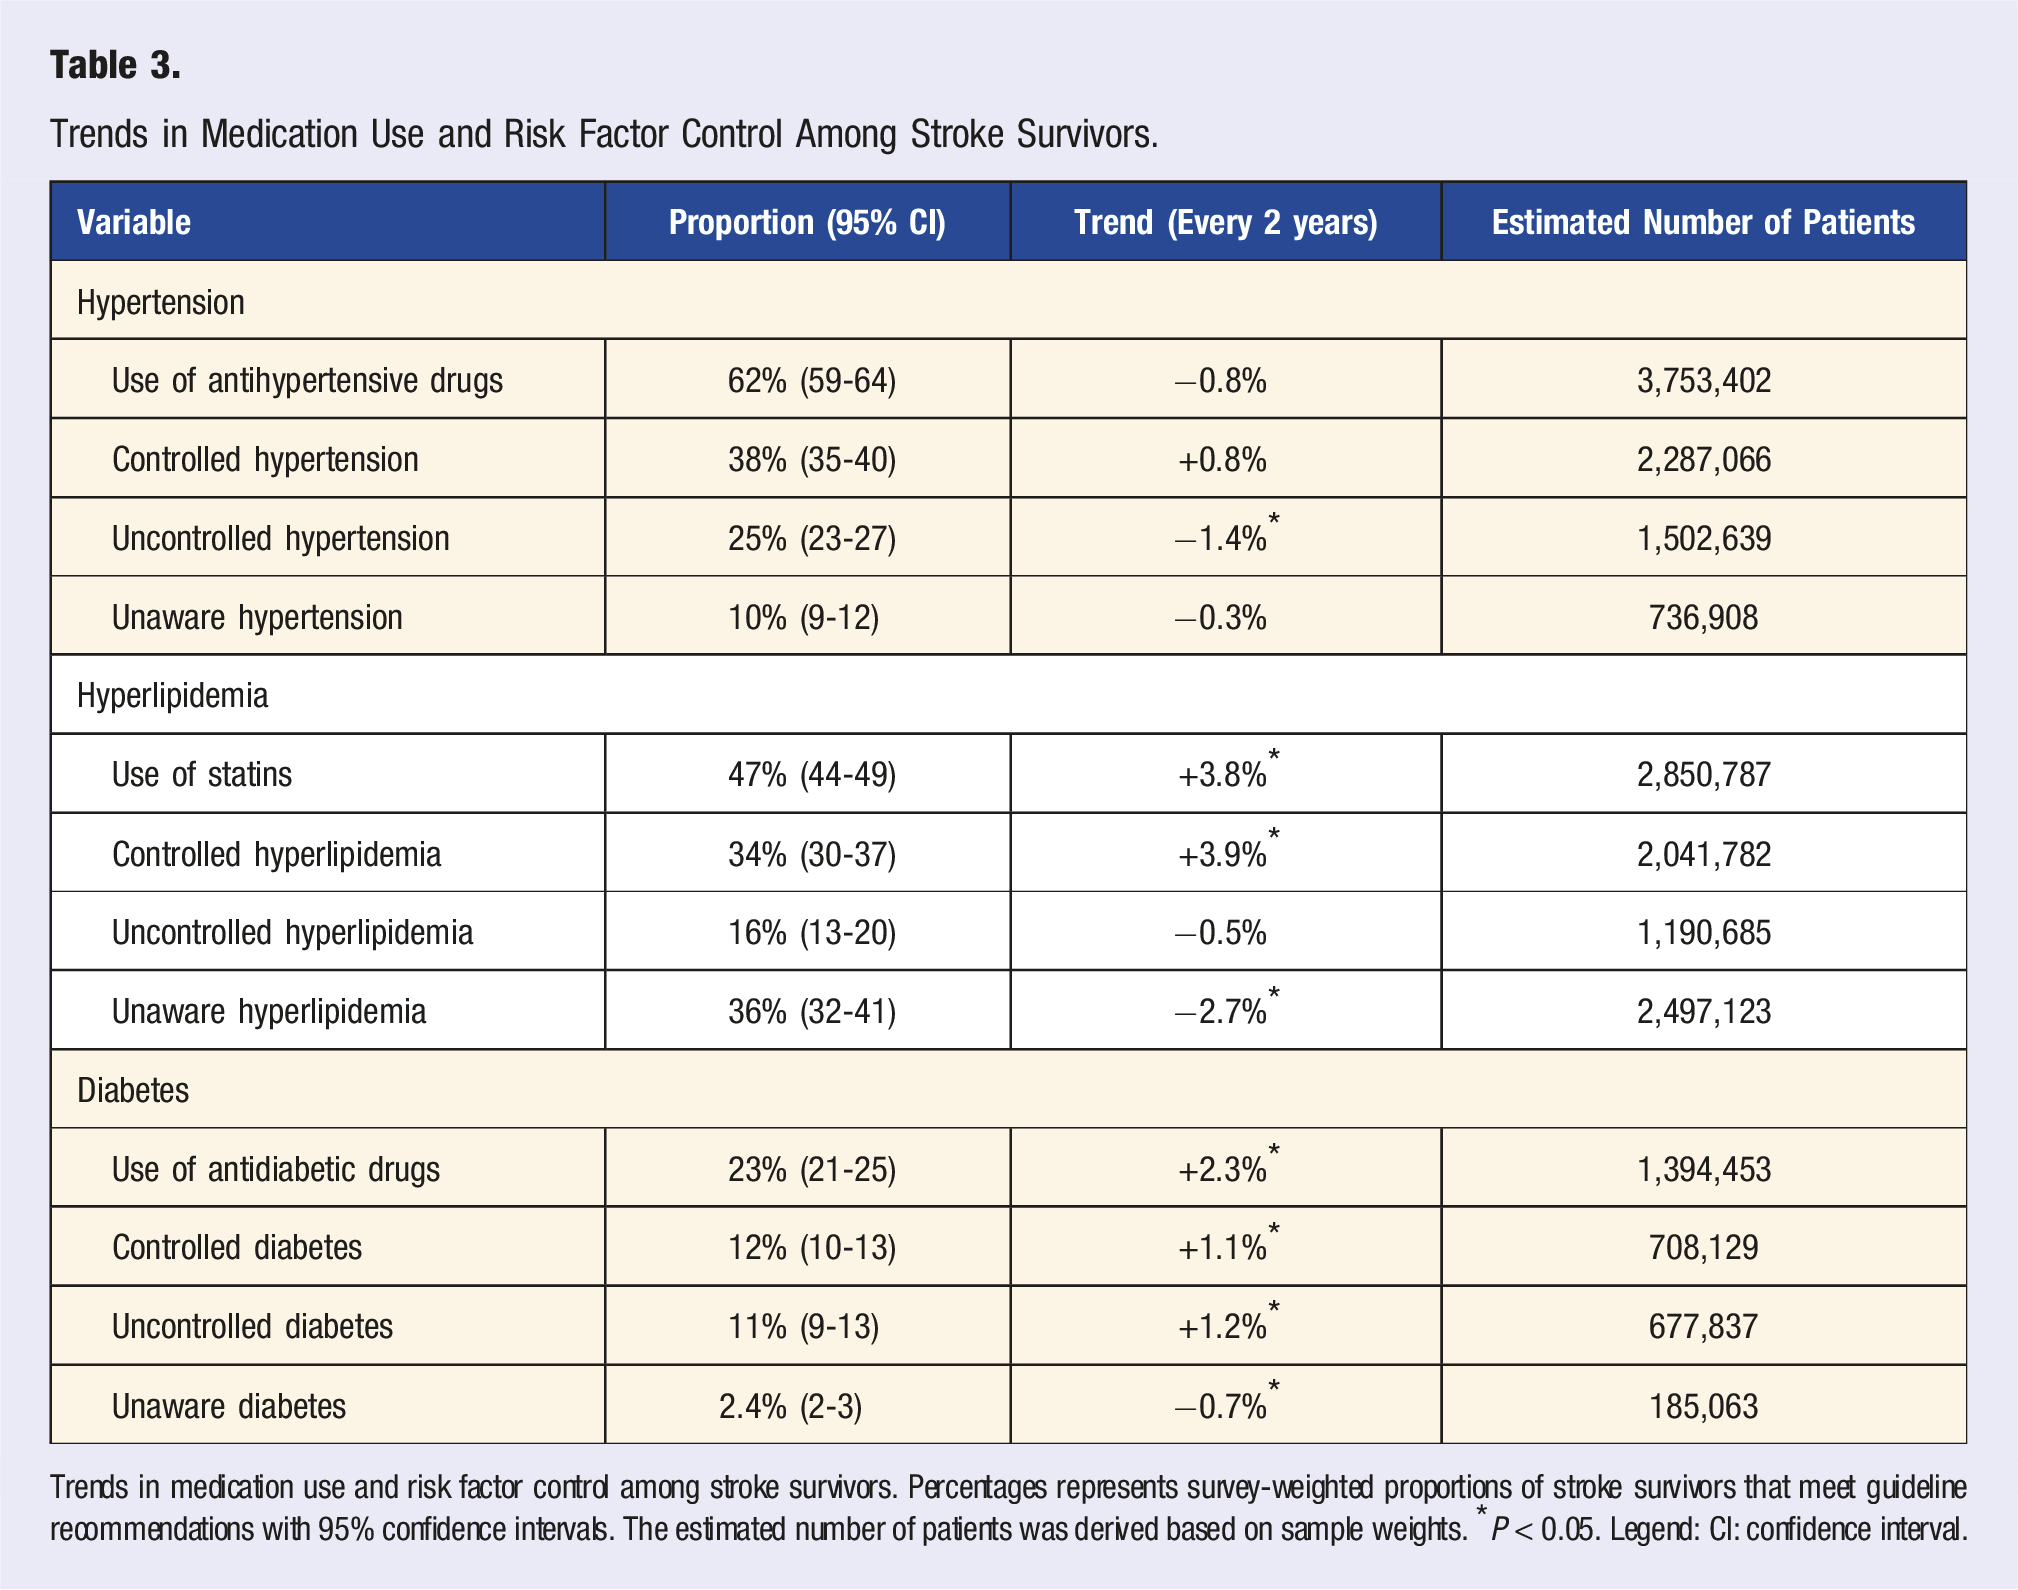
Trends in medication use and risk factor control among stroke survivors. Percentages represents survey-weighted proportions of stroke survivors that meet guideline recommendations with 95% confidence intervals. The estimated number of patients was derived based on sample weights. *P < 0.05. Legend: CI: confidence interval.
Meeting Guideline Recommendations and Risk of Mortality
Risk of Mortality Among Stroke Survivors Stratified by Meeting Guideline Recommendations.
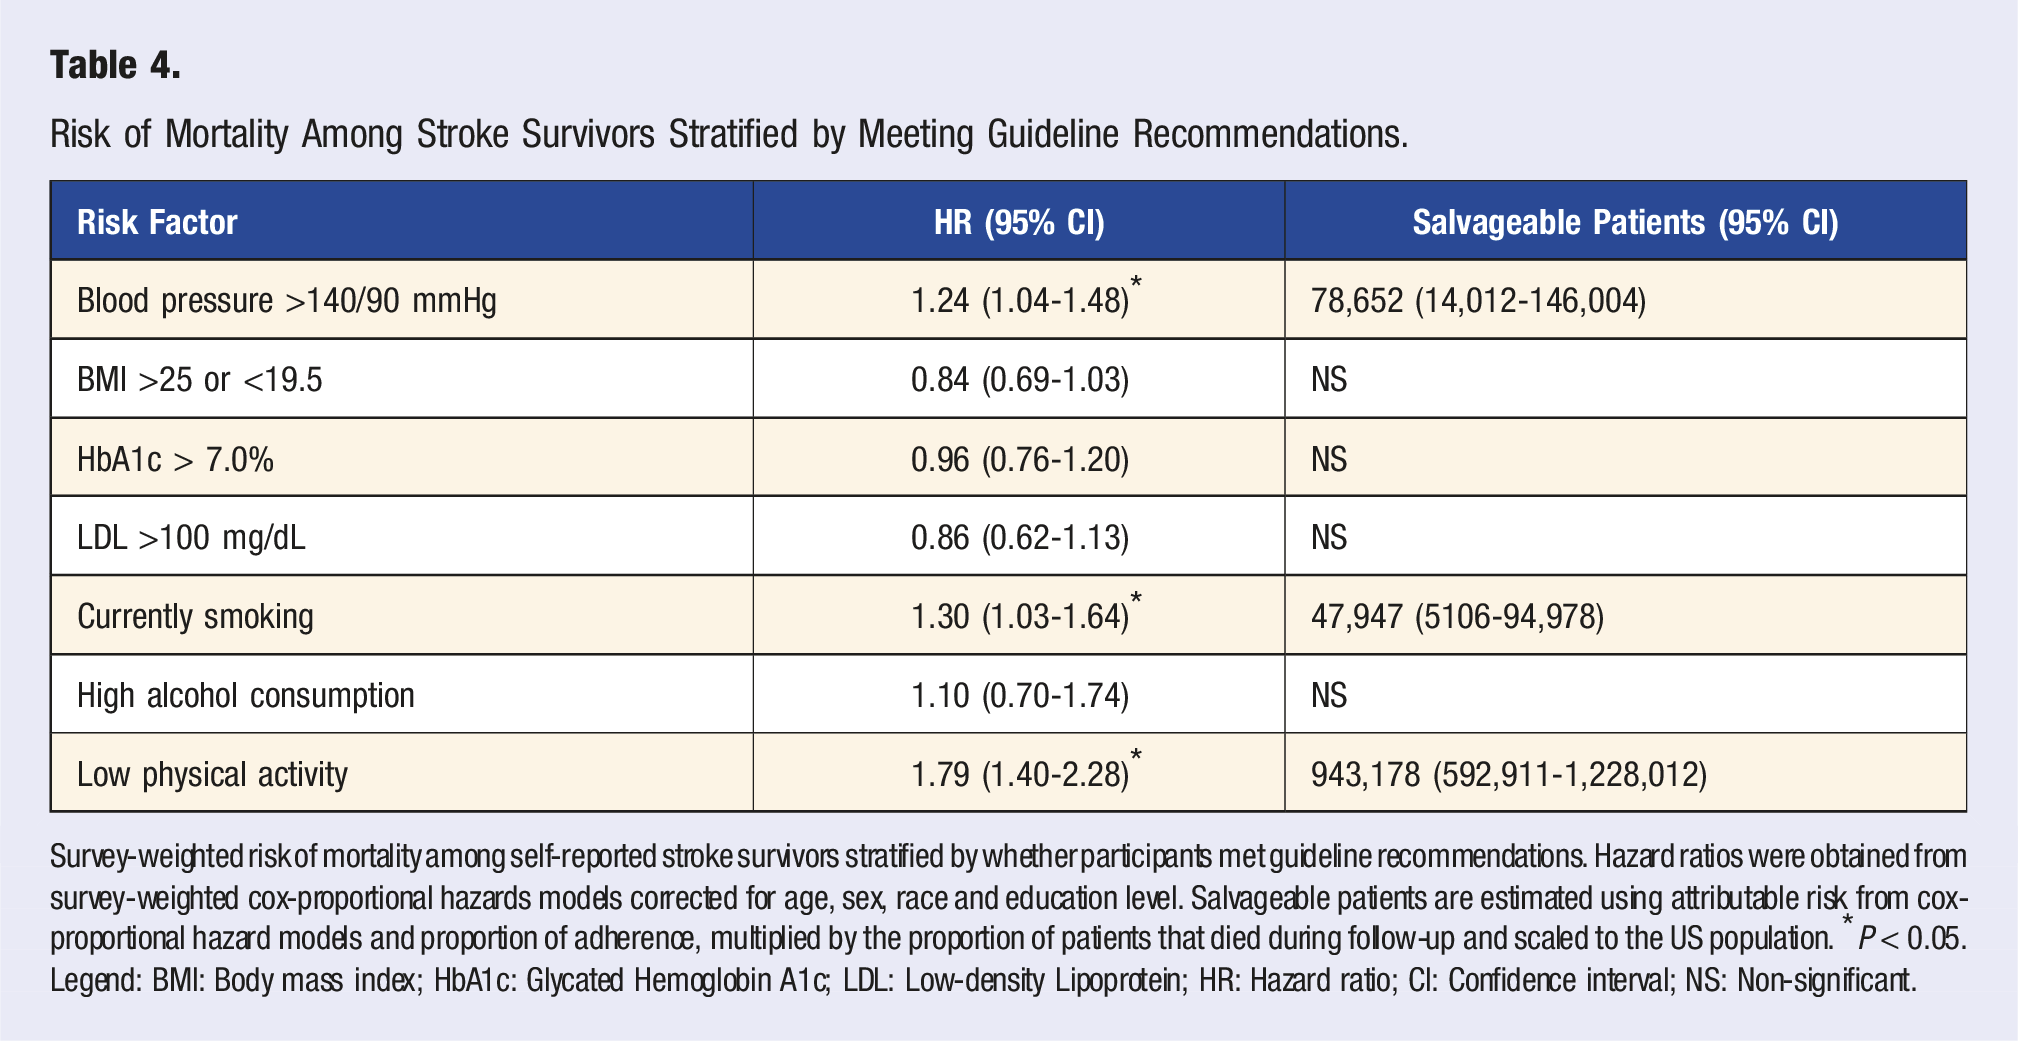
Survey-weighted risk of mortality among self-reported stroke survivors stratified by whether participants met guideline recommendations. Hazard ratios were obtained from survey-weighted cox-proportional hazards models corrected for age, sex, race and education level. Salvageable patients are estimated using attributable risk from cox-proportional hazard models and proportion of adherence, multiplied by the proportion of patients that died during follow-up and scaled to the US population. *P < 0.05. Legend: BMI: Body mass index; HbA1c: Glycated Hemoglobin A1c; LDL: Low-density Lipoprotein; HR: Hazard ratio; CI: Confidence interval; NS: Non-significant.
Discussion
Our results show that the proportion of self-reported stroke survivors that meet the thresholds set by secondary prevention guidelines is limited, despite improvements over time in blood pressure and LDL management. Stroke survivors struggled to meet physical activity and BMI guidelines, and to a lesser extent LDL guidelines. Use of lipid-lowering and glucose-lowering medication increased, while use of blood pressure-lowering drugs remained constant.
Previous work has also shown that approximately 24% of stroke survivors remain smoking, and 20% have high blood sugar, similar to our results.12,13 Furthermore, stroke survivors are more likely to be overweight compared to controls, and spend a large proportion of their time sedentary, which is reflected by the low percentage of patients that met the BMI or physical activity recommendations.14,15 Previous studies using large annual measurements or primary-care cohorts found similar results regarding blood pressure, showing that 1 out of every 3 stroke survivors does not meet the target blood pressure of 140/90 mmHg. 16 In our NHANES cohort, inappropriate blood pressure management was associated with a higher risk of all-cause mortality, replicating previous observations from the International Society of Hypertension and emphasizing the need for adequate blood pressure management strategies in this population. 17 Our results show that 25% of patients do not reach blood pressure goals despite use of medication, and 10% have hypertension and are not on medication. Despite this, our analyses suggest an overall positive trend, with an additional 1.4% of survivors meeting guideline recommendations every 2 years, which was mainly due to a decrease in the proportion of patients with uncontrolled hypertension.
Although fewer than half of the stroke survivors in the NHANES cohorts met the LDL recommendation of <100 mg/dL, we observed a strong positive trend between 1999-2018, which was mirrored by a substantial increase in statin usage. A potential explanation for this observation might be that it represents clinician behaviors driving towards the more aggressive LDL goal <70 mg/dL that took effect in 2021. Indeed, while initial trials in the early 2000s such as HPS and SPARCL were not designed to evaluate LDL lowering beyond 100 mg/dL, results suggested that more aggressive LDL lowering might further improve outcomes in stroke survivors. This information might have influenced treating clinicians or patients themselves in advance of the 2021 guideline change.18,19
Another potential explanation for the positive trends in blood pressure and cholesterol management we observed is the effect of implementation programs. A strong example is the Get with the Guidelines (GWTG) program initiative, launched by the American Heart Association in 2001, which aims at improving the quality of care for stroke patients. 20 This program includes specific recommendations regarding blood pressure and LDL management, and actively monitors performance metrics among participating hospitals, which might be reflected in the positive trend for these risk factors in the current study. However, while GWTG includes recommendations and examples of interventions regarding adherence to physical activity and smoking guidelines, these risk factors require ongoing training and engagement beyond the index stroke hospitalization, which may not be sufficiently addressed in current programs as patients transition back to the primary-care environment. 21 Future research is necessary to determine which approach is most effective in improving adherence to physical activity and smoking guidelines, among which self-management tools and eHealth based personalized approaches are currently under investigation. 22
Some limitations need to be addressed when interpreting our results. First, we included all self-reported stroke survivors, which includes both ischemic and hemorrhagic stroke, despite differences in secondary prevention guidelines. Second, both history of stroke as well as physical activity, smoking and alcohol consumption are derived by self-report from NHANES participants, which may be subject to case misclassification and/or reporting bias. Third, we observed a moderate proportion of missing data in our analyses. However, given the design of the NHANES questionnaire and measurement subsets and our use of the provided survey weights, we submit that it is appropriate to assume missingness is at random and accounted for by survey-weighting all included analyses. Finally, our analyses were performed in the NHANES, which reflects a cohort representative of the US population, and might not be directly comparable to other populations. Strengths of this study are the representativeness of the NHANES population, the consistency of the standardized questionnaires and measurements over time, and the linkage with death records.
Our study has several implications. While the proportion of stroke survivors that met guideline recommendations increased over time, there remains a need to improve risk factor management among stroke survivors, particularly regarding physical activity, BMI, LDL levels and blood pressure. Future work is necessary to determine why certain recommendations are not met, and which management strategies are most effective in achieving appropriate risk factor management.
Conclusion
More than half of stroke survivors do not meet recommendations set by secondary prevention guidelines on BMI, physical activity and LDL, and a third doesn’t meet blood pressure recommendations. Between 1999 and 2018, there was a positive trend towards improved blood pressure and LDL management among stroke survivors. This data may be useful in prioritizing risk factor selection for targeted initiatives to improve adherence.
Footnotes
Author Contribution
Declaration of Conflicting Interests
The author(s) declared no potential conflicts of interest with respect to the research, authorship, and/or publication of this article.
Funding
The author(s) received no financial support for the research, authorship, and/or publication of this article.
Author Note
Anderson receives sponsored research support from Bayer AG and Massachusetts General Hospital and has consulted for ApoPharma.
Data Availability Statement
All data used in this study is openly available through the National Health and Nutrition Examination Survey.