
Abstract
“Diet quality correlated with greater sleep hours, lower stress levels, lower anxiety levels, lower depression severity, and greater academic achievement.”
Introduction
Diet is an integral component of a healthy lifestyle. According to The Global Burden of Diseases, Injuries, and Risk Factors Study (2017), diet is directly linked to morbidity and mortality. 1 In this regard, diets with increased quantities of fruits, vegetables, whole grains, and calcium were correlated with prolonged lives, as well as low lifestyle disease incidence. 1 Similarly, an increased consumption of processed/fatty meats, trans-fats, sodium, and sugar-sweetened beverages was correlated with health complications and diminished longevity. 1 College students must be wary of these circumstances when selecting appropriate food options and cooking meals. Tomova et al. (2019) further explored the notion of diet diversity and overall digestive health. 2 Varied consumption of diverse fruits and vegetables can contribute to the maintenance and improvement of our microbiota, which is essential for the prevention of inflammatory reactions. 2 These modifications to diet can be essential to maintaining a healthy lifestyle,1,2 something that college students should be particularly mindful of.
College students can improve their overall health and prevent future health complications by formulating good dietary habits early in life. However, there are some students who suffer from limited food options either due to medical limitations (e.g., allergies), cultural practices (e.g., religious observances), financial constraints (e.g., food insecurity), or lifestyle choices (e.g., vegetarianism/veganism). According to Ganson et al. (2021), the limitation of food intake can present concerns, since a deficiency in nutrients and calories can result in adverse mental health outcomes, such as depression and anxiety. 3 Therefore, individuals need to be conscious of how their dietary restrictions impact the access to nutrient rich and calorically dense food. For the purposes of the current study, dietary restrictions refers to the avoidance of particular foods/food types due to medical limitations, cultural practices, financial constraints, or lifestyle choices.
Healthy diets can be impacted by circumstances other than lifestyle choices or health limitations. The management of a healthy diet can be unachievable if insufficient access to proper nutrition (e.g., food insecurity) is also experienced. Van Woerden et al. (2019) found that college students are at a higher risk for food insecurity (33-51%) than the average American adult (11.8%). 4 Furthermore, research conducted by Martinez et al. (2020) determined a relationship between food insecurity, poor mental health, and academic performance. 5 Students who were food insecure were more likely to experience poor mental health and poor academic performance. 5 Therefore, food insecurity among college students represents a substantial factor for consideration in university campuses, since students experience food insecurity at a disproportionate rate. 4 The limiting of college student nutrition can represent a concern for this population since their bodies are still growing and developing both mentally and physically.
Beyond adequate access to food, the attainment of sufficient sleep has become a prevailing issue among college students, as it impacts multiple aspects of their health. Tasali et al. (2022) determined that those who had fewer sleep hours had greater food intake, 6 which indicates that insufficient sleep could negatively impact nutritional health. Also, Chaput et al. (2018) states that total hours of sleep must be maintained within age-appropriate ranges (7-9 hours for young adults) and deviation from this range is directly related to mental and physical health disturbances. 7 Therefore, the demanding and time-consuming lifestyles of college students might result in negative health disruptions caused by insufficient sleep. According to Schlarb et al. (2017), many college students experienced disturbed sleep, with about 60% reporting poor sleep and 7.7% meeting the criteria for insomnia. 8 Additionally, it was found that individuals with insufficient or disturbed sleep reported lower grade point averages than students who had normal sleep patterns. 8 In this regard, lack of adequate sleep can impact all aspects of the college student lifestyle by unhealthy overconsumption of food, impaired ability to maintain adequate mental health, and diminished academic achievement. Furthermore, Silvani et al. (2022) analyzed the effects of blue light exposure on sleep quality and sleep duration. 9 Blue light exposure was demonstrated to have negative impact on both parameters of sleep with one-fifth of participants having diminished sleep quality and one-third of participants having decreased sleep duration. 9 College students tend to experience prolonged exposure to blue light through their academic courses and associated work, thereby presenting a concern for poor sleep quality in this population.
College students’ lives are multifaceted, encompassing both their diets and sleep, but also the appropriate management of their mental health. Research conducted by Vidal et al. (2018), determined a positive correlation between high fat diets and perceived stress in a sample of medical students, 10 while Ersig et al. (2021) concluded a positive correlation between the presence of a food allergy and levels of perceived stress. 11 This relationship was especially prevalent in college students who reported high stress related to avoiding an allergic reaction. 11 This implies that dietary restrictions can contribute to and exacerbate the already stressful college environment. Francis et al. (2019) demonstrated a relationship between improved overall diet and decreased symptoms of depression. 12 This research determined that the introduction of the Mediterranean diet, a primarily plant-based diet, on a college campus and the researchers’ dissemination of educational material and counseling by a licensed dietician diminished the severity of participants’ depression. 12 The ability to manage students’ mental health through diet modifications indicates a possibility of beneficial health intervention in this population. Furthermore, Perotta et al. (2021) also demonstrated a relationship between lower academic performance and poor sleep, as well as a higher incidence of depression and anxiety in medical students with poor sleep patterns. 13 Mental health of students is intrinsically connected to other aspects of lifestyle, as it can be modified through changes in diet and sleep.
College students are at a higher risk for negative dietary trends (eg, poor diet, dietary restrictions, food insecurity),4,5 which can have wide reaching impacts on sleep, mental health, and academic performance.6,10-12 However, the specific impact of dietary restrictions and food insecurity on mental health, sleep, and academic performance in a college environment is relatively unknown. To better understand how to improve the lives of college students, a thorough analysis of the risks and consequences of diet quality, dietary restrictions, food insecurity, and mental health metrics is necessary.
Participants were recruited from a large university to collect information regarding college students’ lifestyles. These individuals were subjected to a cross-sectional electronic survey that assessed diet, restrictions on diet, food insecurity, sleep, mental health, and academic performance. If certain dietary patterns and food insecurity are shown to impact sleep, mental health metrics, or academic performance, then appropriate dietary interventions that positively impact college students’ lifestyles can be determined.
Methods
The Institutional Review Board of a large university in upstate New York approved this study protocol in accordance with the Declaration of Helsinki. Qualtrics was used to collect survey responses. This cross-sectional electronic survey was administered to students who attended the host university and met the eligibility criteria (between the ages of 18 and 26 and were enrolled in the host university’s undergraduate program). The survey was conducted in three iterations across three academic semesters from October 26, 2022 until January 1, 2024 (n = 98,104,90). The three study iterations differed slightly in their content (e.g., removal of depression questions) and slight alterations to the language of questions occurred, which prevented the creation of a single unified data set of respondents. Survey questions focused on examining students’ diet, food insecurity, mental health, sleep, and academic performance. To ensure voluntariness, every question had a “prefer not to say” option. The questionnaire was advertised using university email services, social media, and in-person flier distribution. It was also directed towards student organizations, particularly those that had a religious or cultural focus, to promote a diverse sample.
“Diet Target Score”
The quality of diet was assessed based on the risk or benefit that particular food groups pose to future health outcomes. The current study’s diet questions were based on a worldwide study of the association between specific dietary consumption and mortality rates. 1 Fourteen Likert scale questions were selected to assess all aspects of the participant’s diet quality based on their nutritional value: cow’s milk, vegetables, fruits, whole grains, legumes, fiber, red meat, nuts and seeds, polyunsaturated fatty acids, sugar-sweetened beverages, sodium, processed meat, calcium, and seafood omega 3-fatty acids. 1 Participants then indicated whether they were meeting target amounts of each food, which were determined experimentally in the aforementioned longitudinal study. 1 For food categories that reduce the risk of death, responses of “not enough” or “less than enough” were denoted by scores of −2 and −1, while consuming “more” or “much more than enough” were denoted by scores of 1 and 2. The point values were inverted for food categories that increase the risk of death. A response of “enough” was scored as a 0, regardless of the food group. However, questions regarding intake of polyunsaturated fatty acids and seafood omega 3-fatty acids were demonstrated to be beyond the scope of participants’ knowledge since it generated a majority of responses of “prefer not to say” and “I don’t know.” To reduce the exclusion of these respondents, answers of “prefer not to say” and “I don’t know” were scored as 0. After phase 1 of data collection, the verbiage of the Likert questions was modified slightly for clarity, but the content and scoring of the questions remained unchanged. A higher score indicates a healthier diet, where 0 represents the average diet according to the recommendations (Range = -28-28).
“Diet Variety Score”
Healthy diets incorporate diverse fruits and vegetables, which promote the digestive microbiota and provide anti-inflammatory benefits. 2 The diversity of the participant’s diet was measured using a numerical assessment of the quantity of unique fruits and vegetables consumed in a typical week. These two reported values were computed into a cumulative score with a higher score indicating greater variety in the respondent’s diet (Range = 0-60).
“Diet Quality Score”
Diet target and diet variety scores were combined into a cumulative diet quality score to assess participants’ overall diets (Range = -28-88).
“Dietary Restriction Level”
Dietary restrictiveness was defined by an indication of gluten intolerance, lactose intolerance/dairy sensitivity, religious dietary observance, at least one food allergy, and pescatarian, vegetarian, and vegan lifestyles, where participants could select multiple responses. During data analysis, each food restriction received a score of 1 (0-8). Then, respondents were able to assess the extent to which their dietary habits interfered with their intake of nutritious meals. A modified Likert scale was used to score this question, where a response of “never” represented a minimum score of 0 and a response of “often” represented a maximum score of 3. These scores were added to each other to compute a cumulative dietary restriction level (Range = 0-10). A higher score denoted a greater barrier to obtaining proper nutrition.
“Food Insecurity Score”
Food insecurity was defined as worry about financial status, frequency of food inadequacy, and qualification for the federally subsidized lunch program. The individual’s worry about their financial status was assessed by a modified Likert scale, where the response of “never” represented a minimum score of 0 and a response of “often” represented a maximum score of 3. The frequency of inadequate access to food was defined by seven distinct time frames: “never,” “once a month,” “2-3 days a month,” “once a week,” “2-3 times a week,” “4-5 times a week,” and “almost every or every day” (0-6). Finally, the qualification for subsidized lunch programs was assigned a value of 0 for “no” or “I don’t know” and 1 for “yes.” These three parameters were tabulated into a cumulative food insecurity score (Range = 0-10).
“Sleep Hours”
The assessment of participants’ sleep was determined by tabulating the cumulative number of hours slept during a single day. Respondents provided a numerical answer about how many hours they sleep and nap, on average, per day. This cumulation of both sleeping and naptime hours allowed for an assessment of their rest time (Range = 0-24).
“Sleep Quality”
The assessment of participants’ sleep quality was determined by self-reporting. The individual’s perceived sleep quality was assessed by a modified Likert scale, where responses of “very poor” or “poor” were denoted by scores of −2 and −1, while “good” or “excellent” were denoted by scores of 1 and 2. A response of “fair” was scored as a 0. The question regarding sleep quality was removed from the second and third iteration of the survey to diminish respondent attrition due to survey length.
“Mental Health Metrics”
Evaluating individualized portions of participants’ mental health was a complex task, and therefore required multiple variables to evaluate. The Perceived Stress Scale Assessment (Stress) was used to quantify participants’ stress levels (Range = 0-40), 14 the Generalized Anxiety Disorder scale (Anxiety) was used to quantify participants’ anxiety (Range = 0-21), 15 and the Patient Health Questionnaire (Depression) was used to quantify the severity of participants’ depression (Range = 0-27). 16
“Academic Performance”
The academic performance of participants was quantified by self-reporting of grade point average (GPA) from the previous academic semester on a four-point scale rounded to the nearest hundredth decimal place (Range = 0.00-4.00). Alternatively, respondents could indicate that it was their first semester, implying that they did not have a GPA. High school and other universities’ GPAs were not accepted since this metric is not standardized across institutions.
“Statistical Analysis”
Statistical analyses were performed using the IBM SPSS Statistics v28 software (alpha = 0.05). To assess the distribution of the data, tests of kurtosis were performed. All key variables were normally distributed with the exception of anxiety score and GPA which displayed leptokurtosis and dietary restriction level which displayed platykurtosis. A Spearman rho correlation was used to assess a relationship between nonparametric variables and a Pearson r correlation was utilized to assess a relationship between parametric variables. Mann Whitney U and Kruskal-Wallis tests were used to assess nonparametric independent samples.
The results from the surveys were validated by removing individuals who indicated responses of “prefer not to say” on questions (except regarding polyunsaturated fats and omega 3-fatty acids) or who failed to complete the entire survey. The initial samples of consenting respondents (n = 138;136;119) were reduced to validated datasets (n = 98;104;90). Descriptive statistics were generated for each iteration of the survey using the respective validated dataset.
Results
Demographic Information.
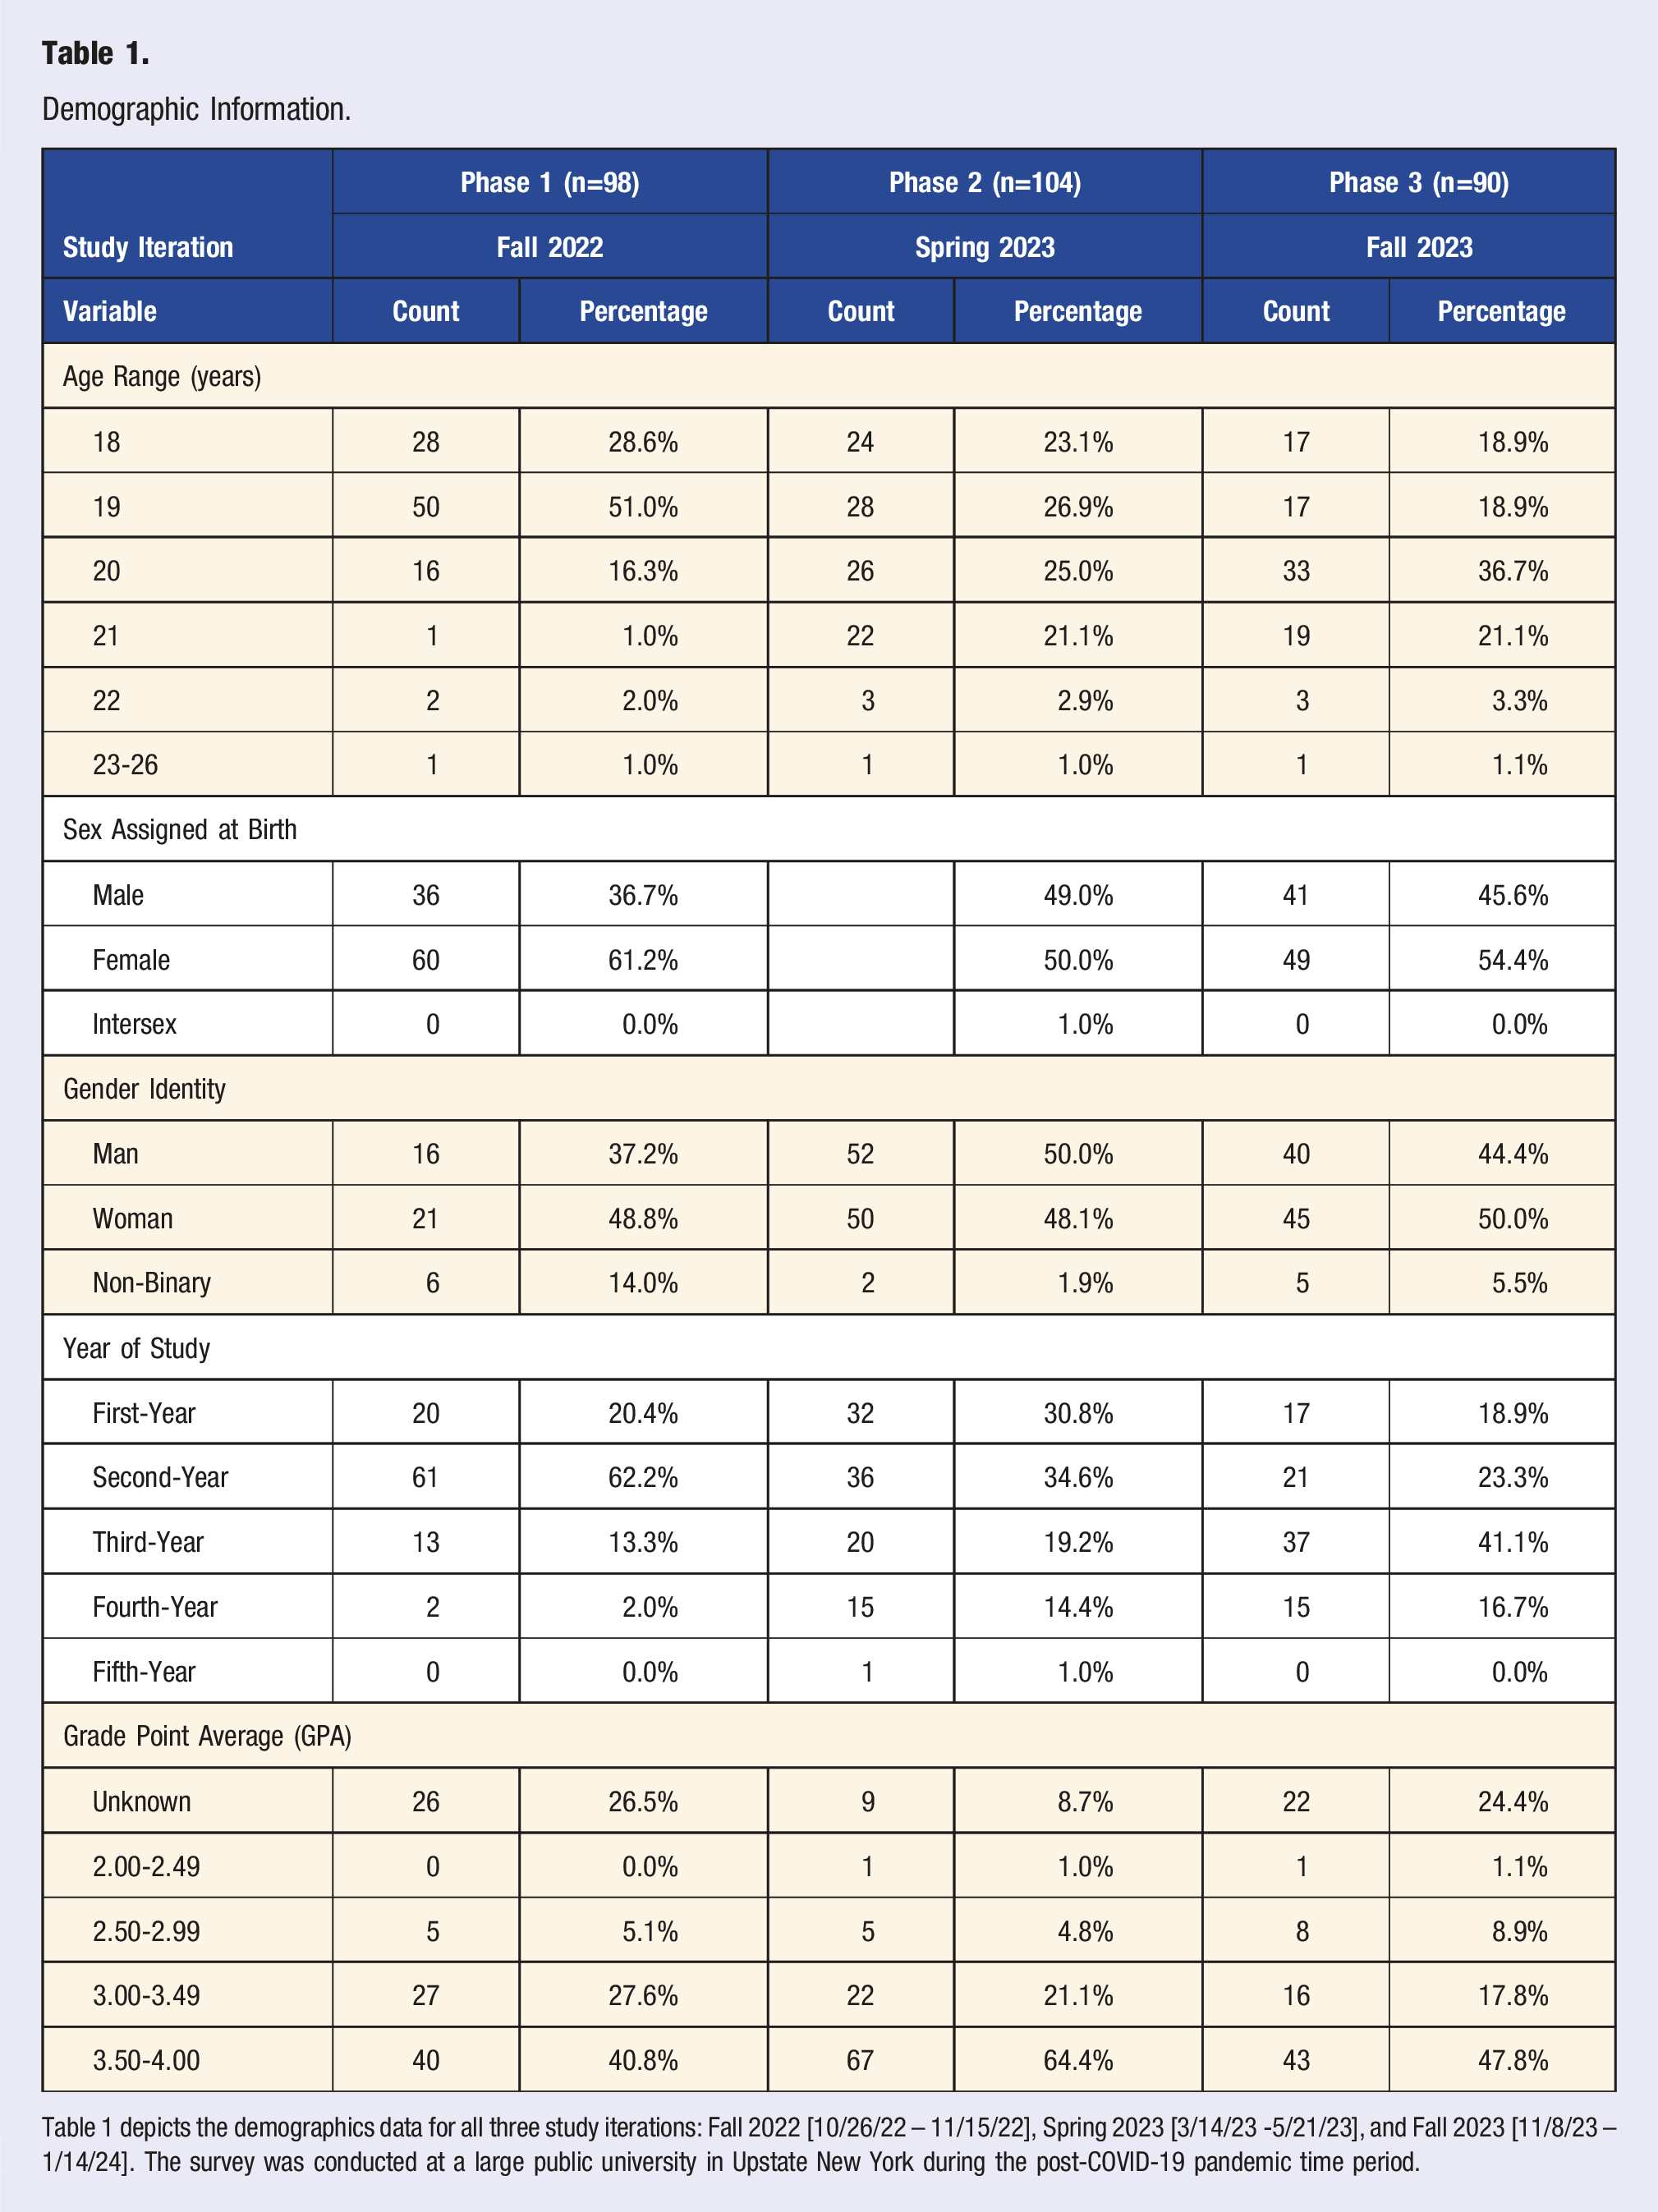
Table 1 depicts the demographics data for all three study iterations: Fall 2022 [10/26/22 – 11/15/22], Spring 2023 [3/14/23 -5/21/23], and Fall 2023 [11/8/23 – 1/14/24]. The survey was conducted at a large public university in Upstate New York during the post-COVID-19 pandemic time period.
Across all three semesters, no differences in diet quality score were detected by gender (Rho = 0.002, P = 0.935; Rho = 0.070, P = 0.129; Rho = 0.130, P = 0.756) or sex assigned at birth (Rho = 0.017, P = 0.683; Rho = 0.970, P = 0.106; Rho = 0.0.132, P = 0.349). However, females were more food insecure than males (Rho = 0.329, P = 0.001) and non-binary individuals were more restricted than women (Rho = 0.325, P = 0.007). Furthermore, non-binary individuals showed greater variance in their food insecurity scores (refer to Figure 1 for complete statistical data). Distribution of Participant's Gender and Food Insecurity Score (n = 73). Figure 1 indicates the relationship between food insecurity score and participant’s gender in phase 3 [11/8/23-1/14/24] of the study. This analysis excluded participants who did not indicate a gender identity. The figure indicates that non-binary and female participants demonstrate similar variability in their self-reported food insecurity score, but non-binary individuals experienced more severe food insecurity. The significance value for this correlation was 0.007, meaning that the results represent a statistically significant relationship.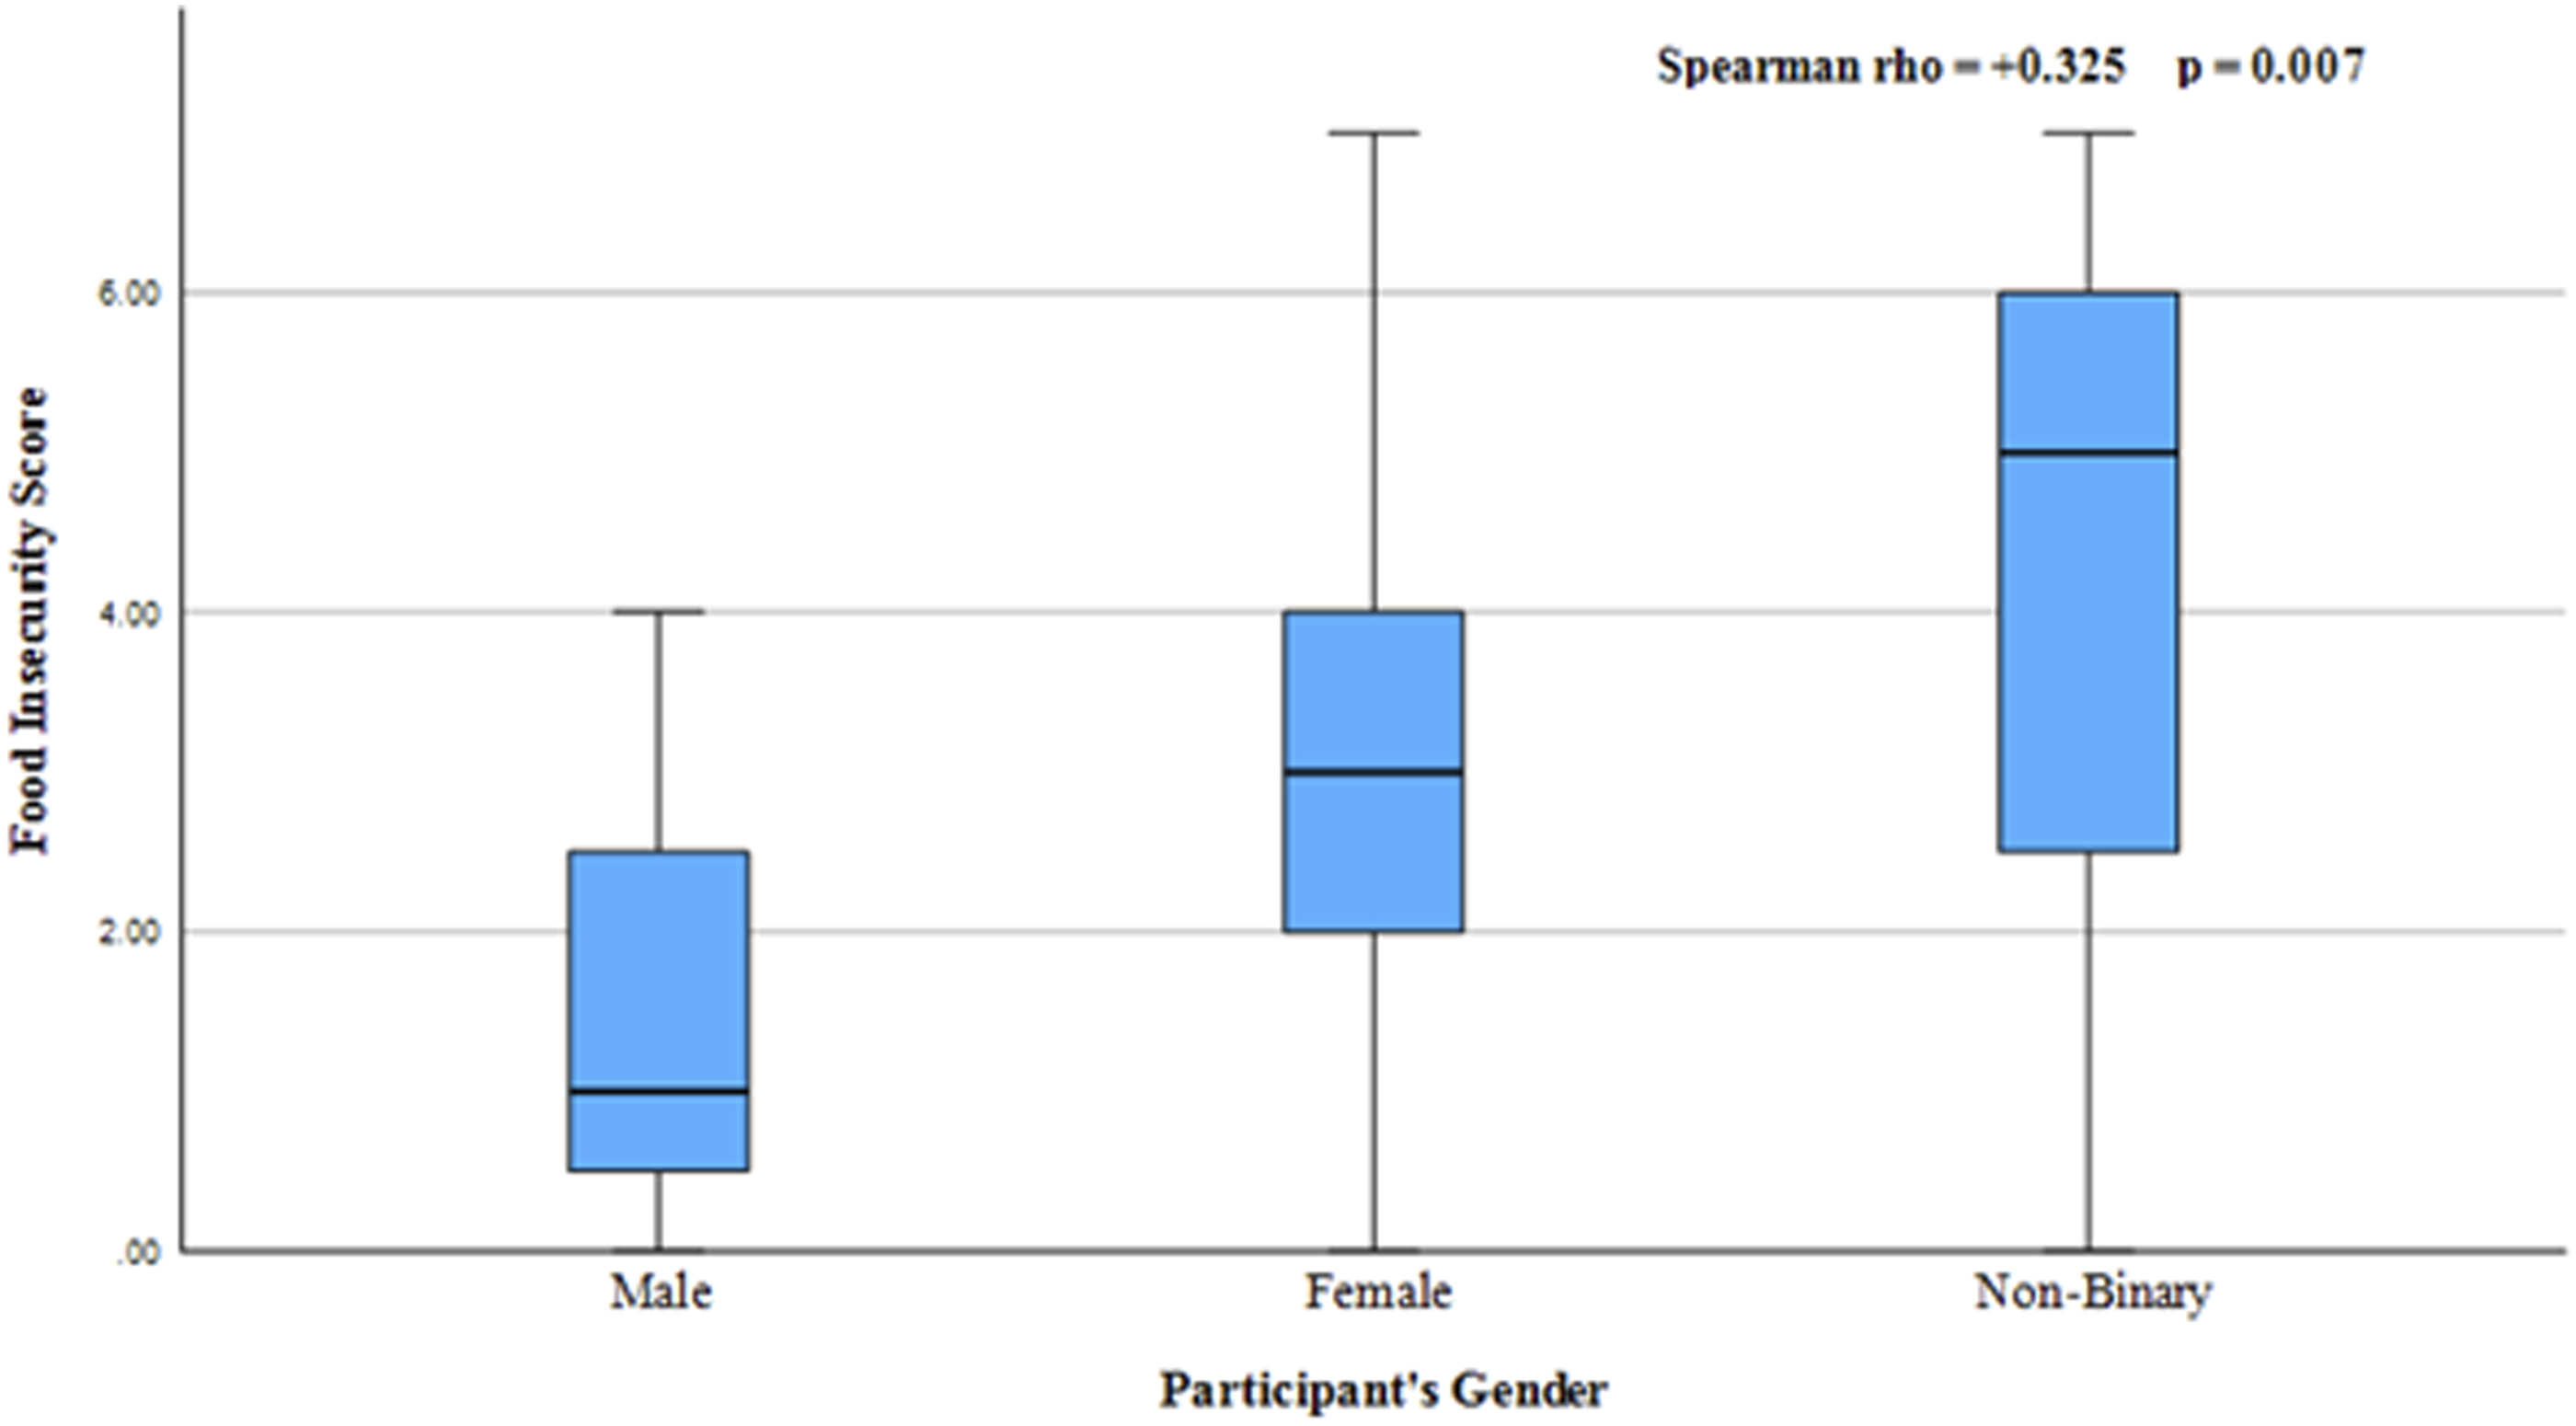
Descriptive Statistics of Independent Variables.
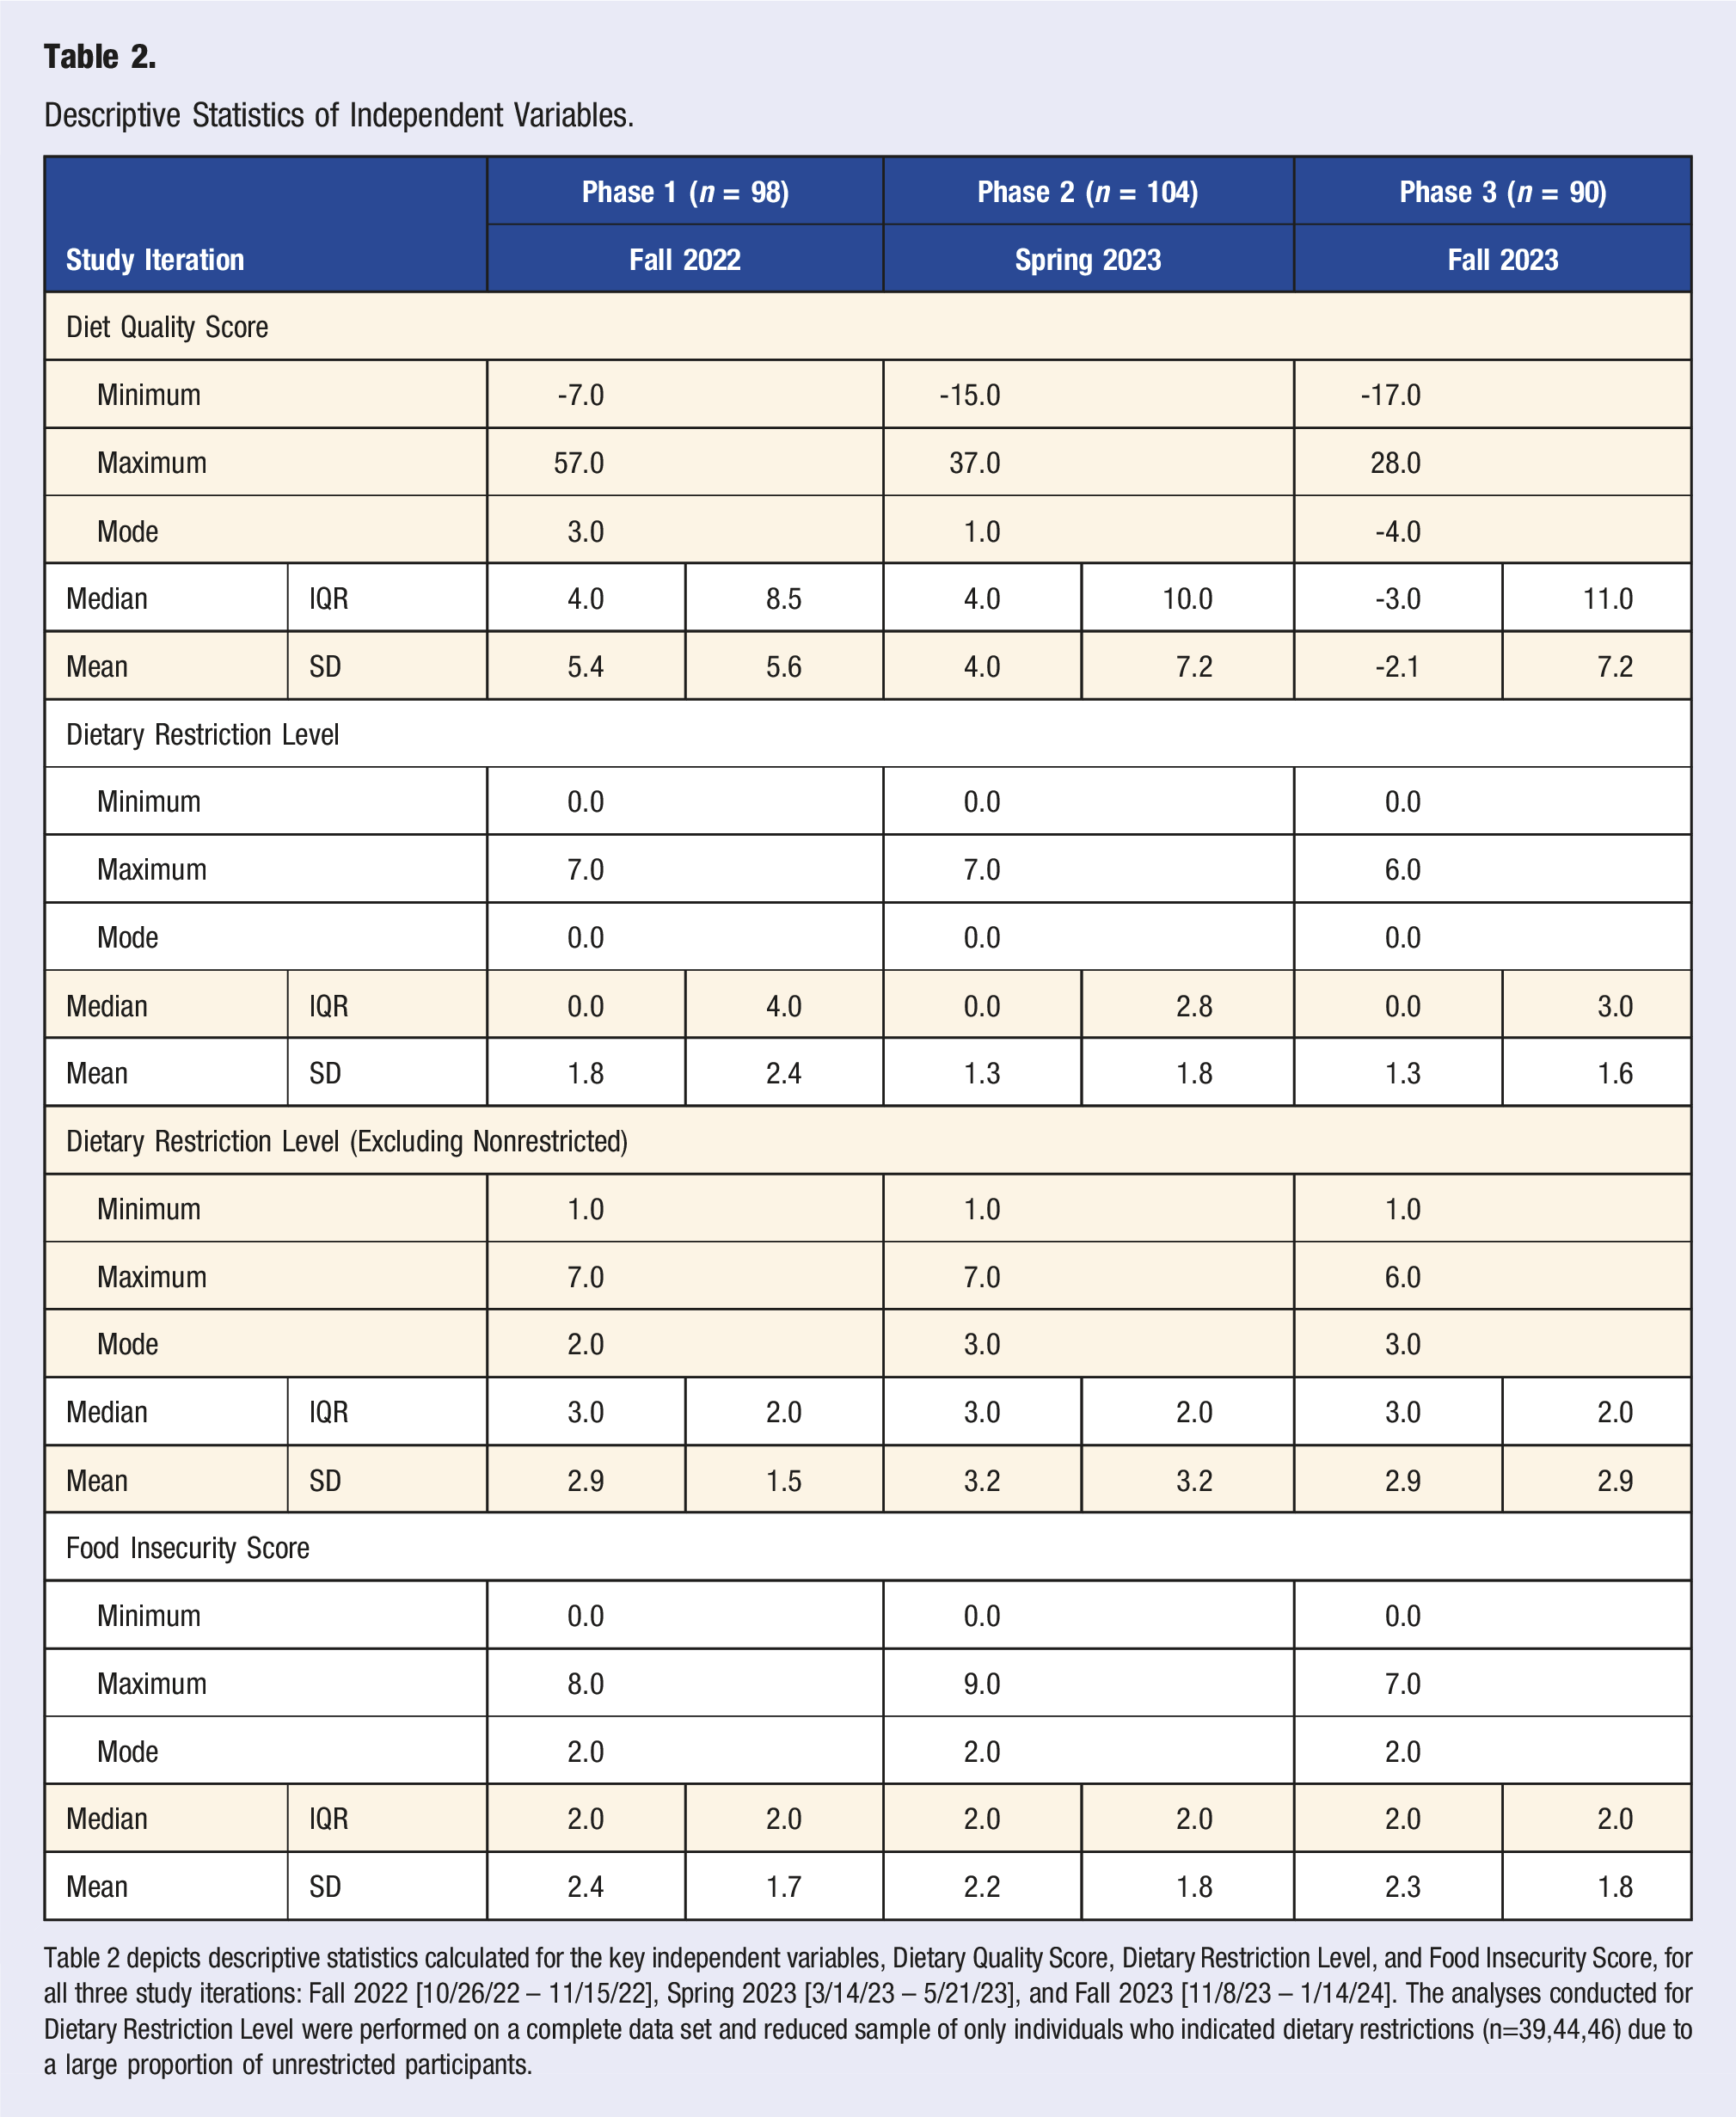
Table 2 depicts descriptive statistics calculated for the key independent variables, Dietary Quality Score, Dietary Restriction Level, and Food Insecurity Score, for all three study iterations: Fall 2022 [10/26/22 – 11/15/22], Spring 2023 [3/14/23 – 5/21/23], and Fall 2023 [11/8/23 – 1/14/24]. The analyses conducted for Dietary Restriction Level were performed on a complete data set and reduced sample of only individuals who indicated dietary restrictions (n=39,44,46) due to a large proportion of unrestricted participants.
A significant negative correlation was detected between diet quality score and stress (r = −0.225, P = 0.027) and anxiety (Rho = −0.300, P = 0.003) in phase 2 but trended negatively in phase 1 (r = −0.003, P = 0.974; Rho = −0.108, P = 0.282) and phase 3 (r = −0.104, P = 0.360; Rho = −0.044, P = 0.695). A significant negative correlation was detected between diet quality score and depression in phase 1 (r = −0.434, P = 0.032) but trended weakly negative in phase 3 (r = −0.042, P = 0.715). Data regarding depression was not collected for phase 2.
A significant positive correlation was detected between diet quality and dietary restriction level in phase 1 (Rho = 0.498, P = 0.036) (refer to Figure 2 for complete correlational data) but positively trended towards a correlation in phase 2 and 3 (Rho = 0.065, P = 0.516; Rho = 0.123, P = 0.268). There was also a significant positive correlation between diet quality and sleep hours in phase 1 and 2 (r = 0.284, P = 0.036; r = 0.405, P = 0.022), but no trend was detected in phase 3 (r = 0.017, P = 0.885). Across the three study iterations, there was considerable variability between diet quality score and other dependent variables (refer to Table 3 for complete correlational data). Distribution of Dietary Restriction Score and Diet Score in Phase 1 (n = 18). Figure 2 indicates the relationship between dietary restrictions and overall diet in phase #1 [10/26/22-11/15/22]. This analysis excluded participants who did not indicate dietary restrictions, which reduced the sample size from the initial population of consenting respondents (n = 98) to a population excluding individuals who have no dietary restrictions (n = 18). The figure indicates that as individuals become more restricted in their food intake, their diet improves overall. The significance value for this correlation was 0.036, meaning that the results represent a statistically significant relationship. Correlations of Independent and Dependent Variables. Table 3 depicts the Pearson r and Spearman rho correlations for each of the independent and dependent variables for all three study iterations: Fall 2022 [10/26/22 – 11/15/22], Spring 2023 [3/14/23 -5/21/23], and Fall 2023 [11/8/23 – 1/14/24]. Key: * = P < 0.05; ** = P < 0.01; *** = P < 0.001.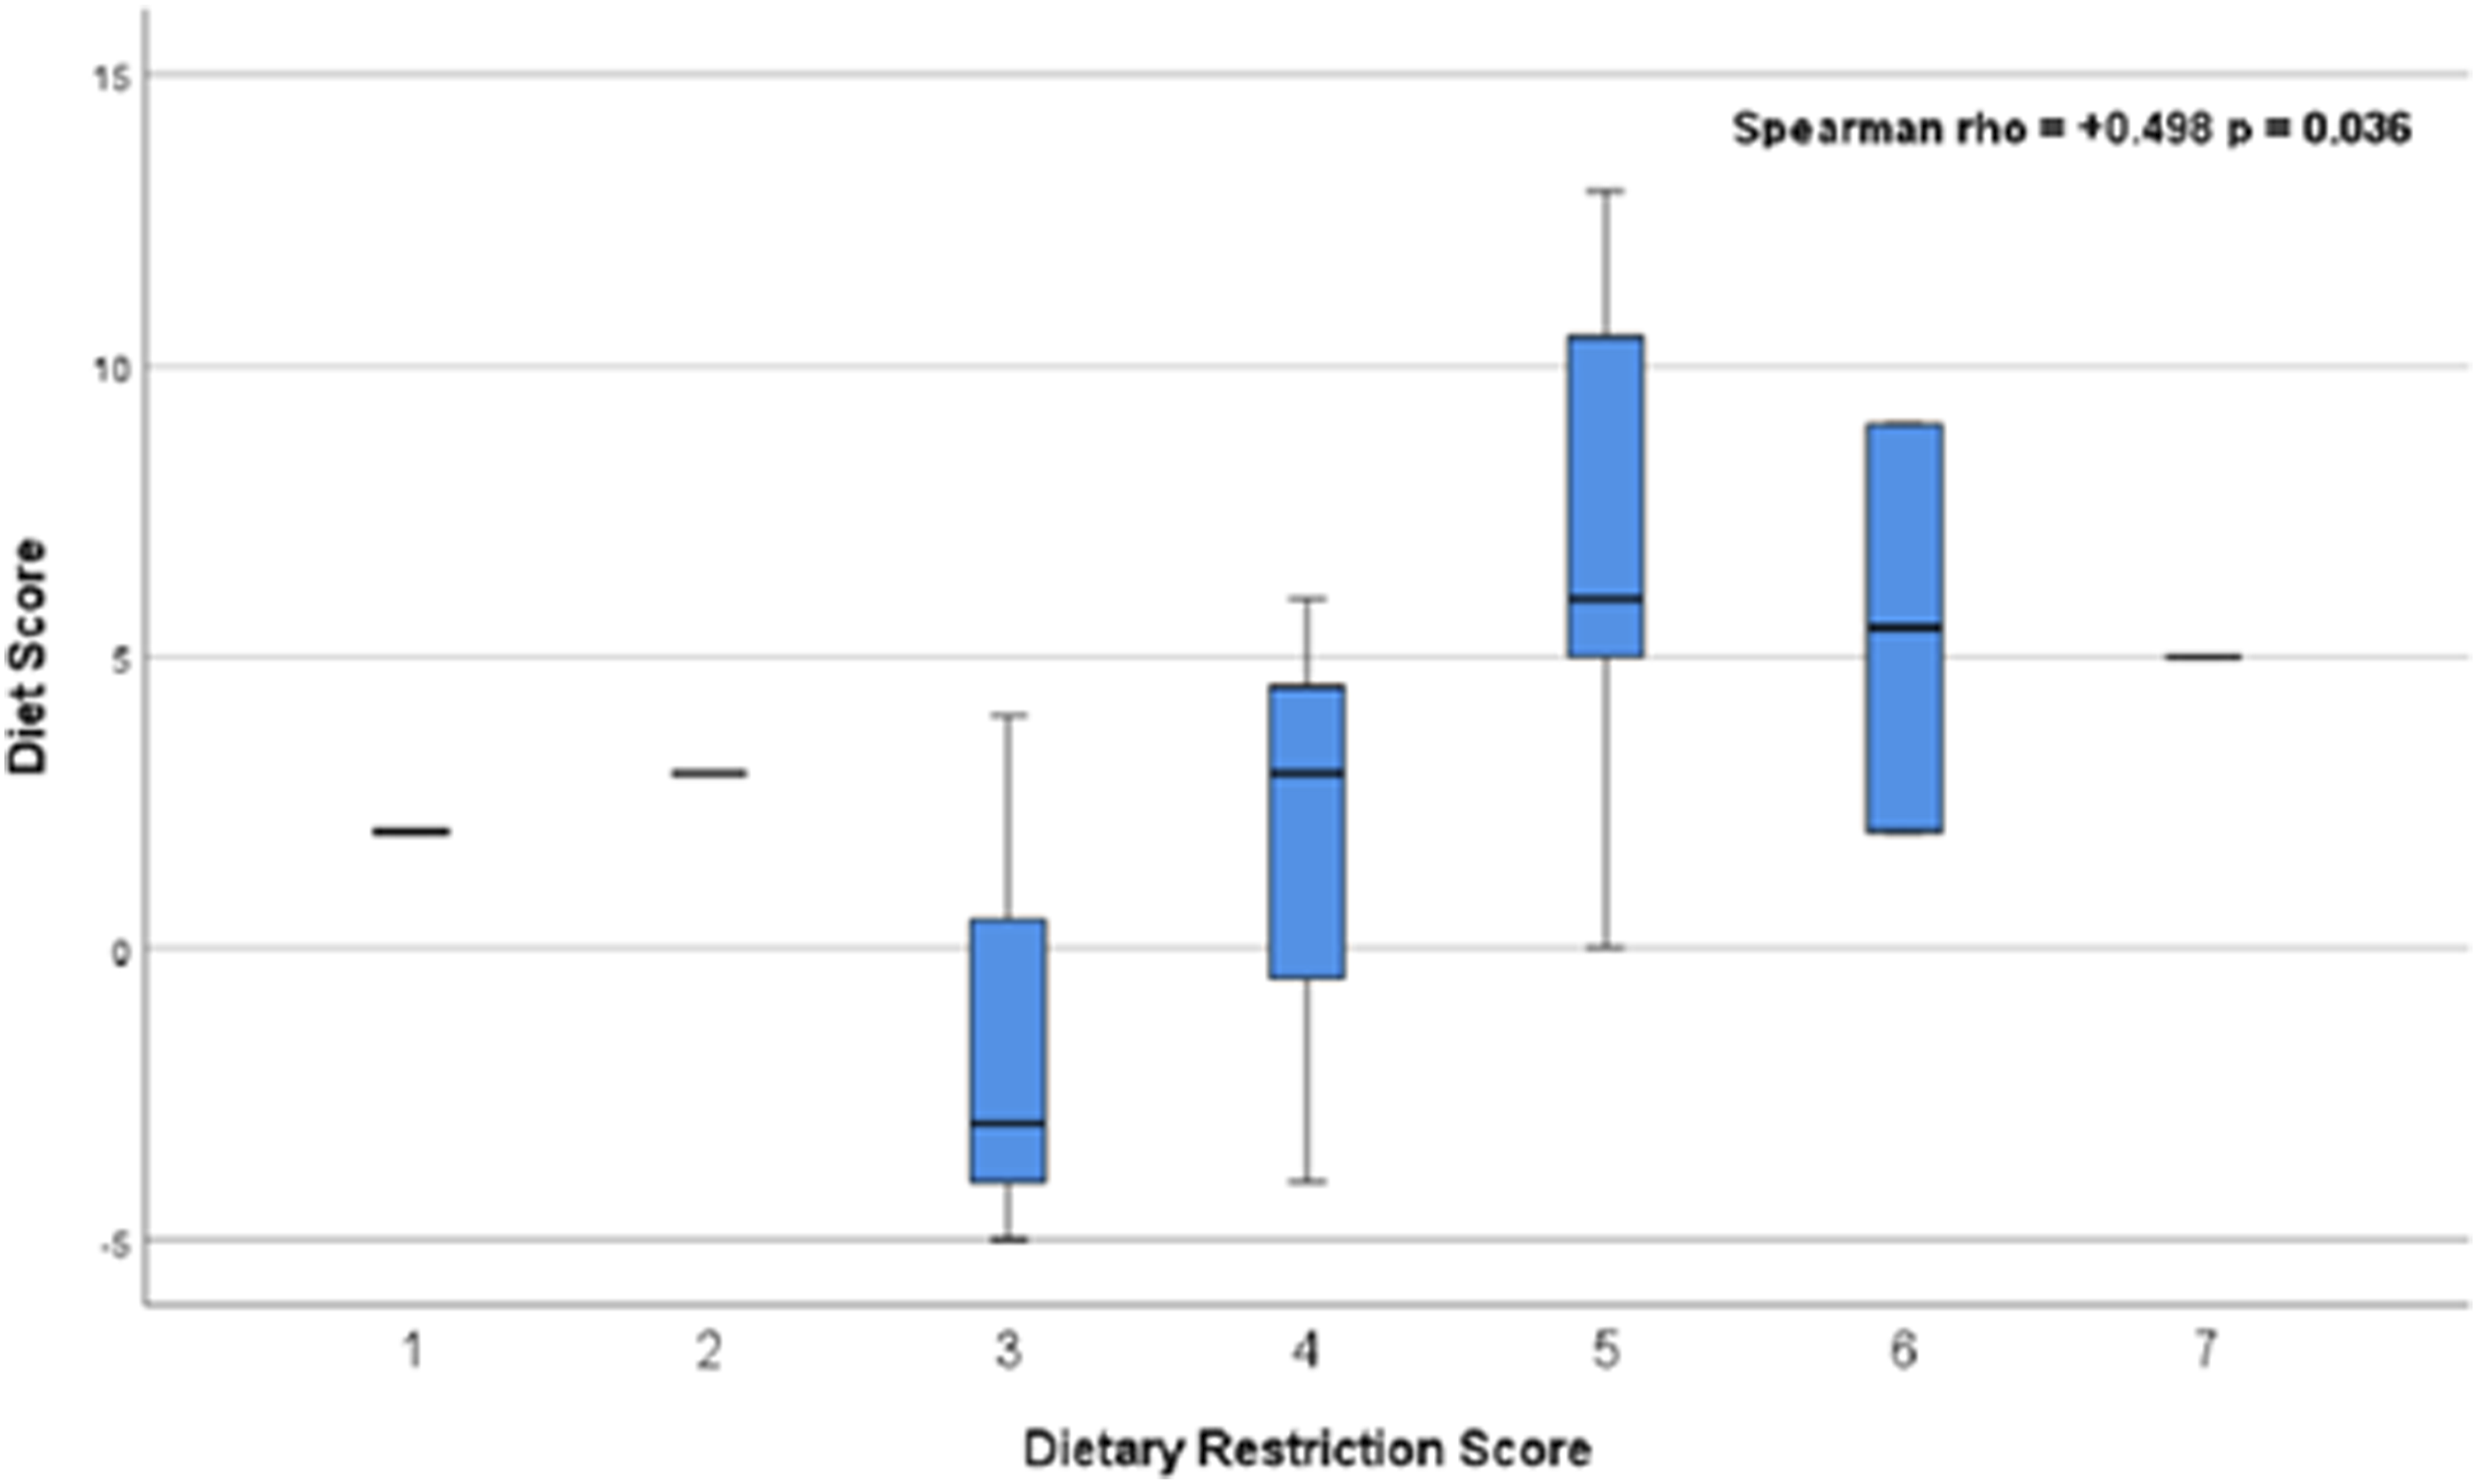
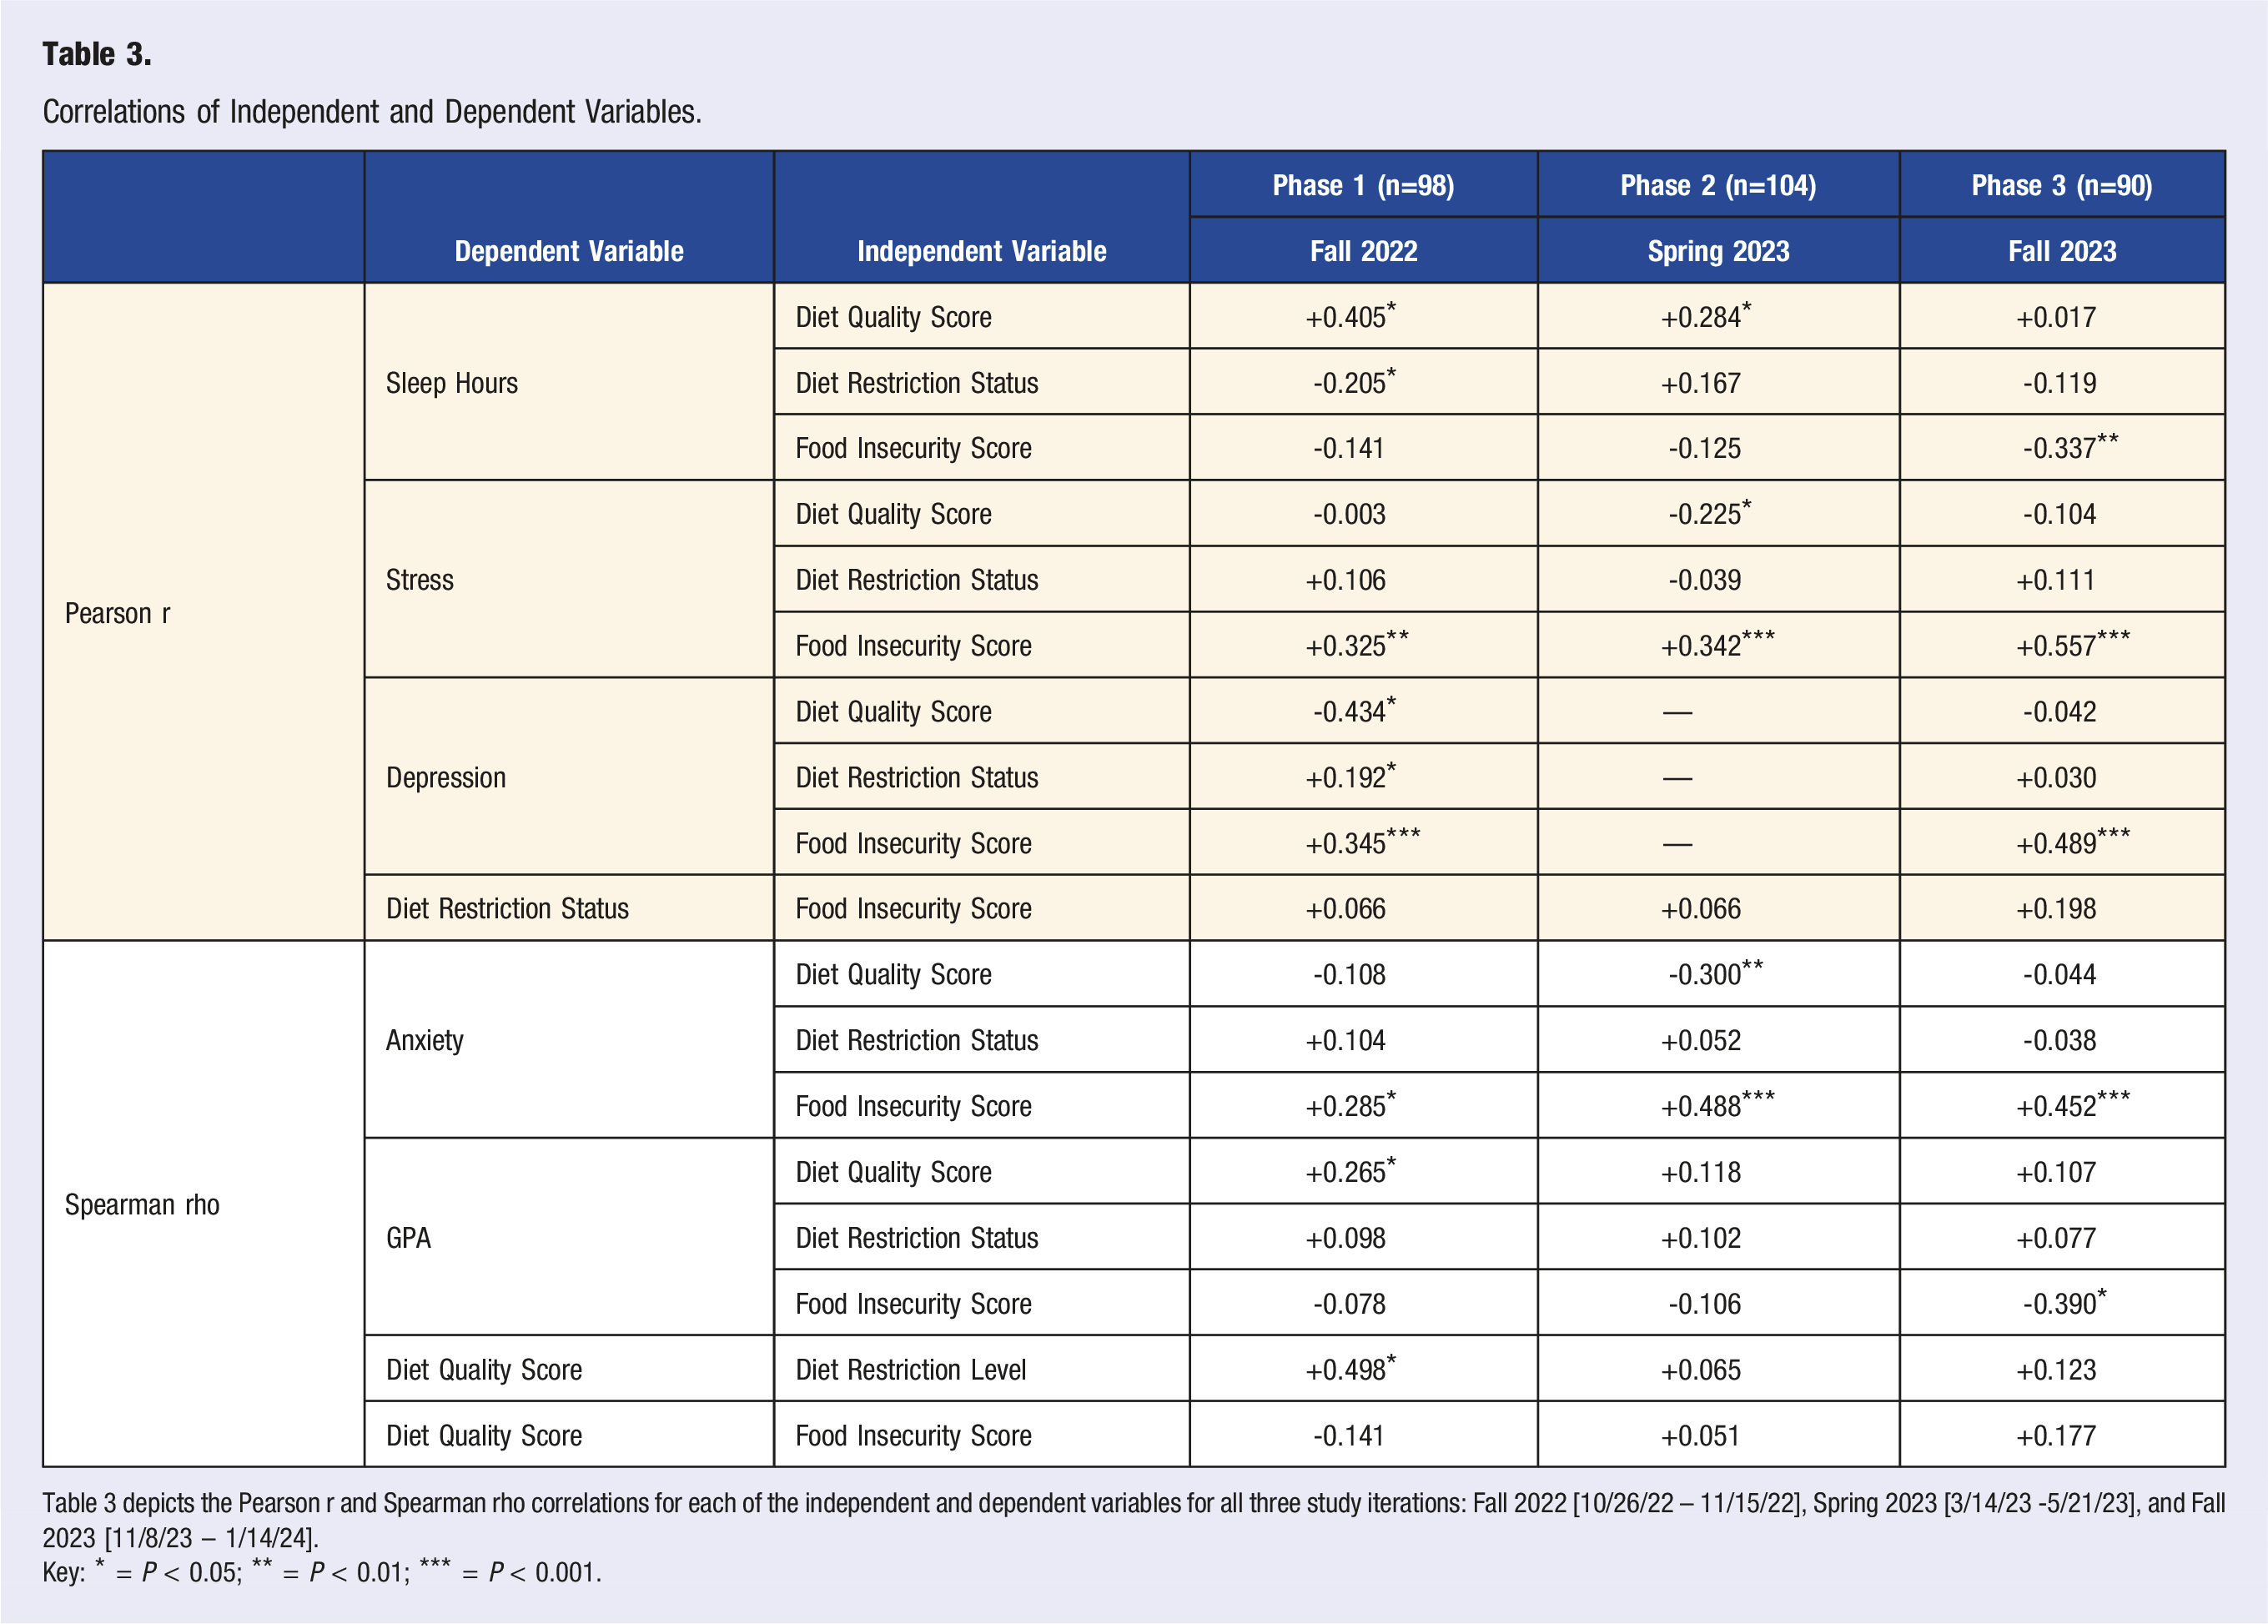
Across all three semesters, food insecurity score correlated positively with stress (r = 0.325-0.557, P < 0.002) and anxiety (Rho = 0.285-0.557, P < 0.05). Food insecurity score correlated with depression in phase 1 and 3 (r = 0.345, P < 0.001; r = 0.489, P < 0.001); data regarding depression was not collected in phase 2. Furthermore, a significant negative correlation was detected between food insecurity score and sleep hours in phase 3 (r = −0.337, P = 0.007), but trends towards negative correlations were weaker in phase 1 and 2 (r = −0.141, P = 0.153; r = −0.125, P = 0.231). Another significant negative correlation was detected between food insecurity score and GPA in phase 3 (Rho = −0.390, P = 0.030), but trended towards a negative correlation in phase 1 and 2 (Rho = −0.078, P = 0.523; Rho = −0.106, P = 0.313).
Dietary restriction status had a significant, positive correlation with depression in phase 1 (r = 0.192, P = 0.049), but no trend was detected in phase 3 (r = 0.030, P = 0.793); depression was not collected in phase 2. A significant negative correlation was detected between dietary restriction status and sleep hours in phase 1 (r = 0.205, P = 0.036) but trended towards a positive correlation in phase 2 (r = 0.167, P = 0.102) and towards a negative correlation in phase 3 (r = −0.119, P = 0.296). No correlations were detected between dietary restriction status, stress, anxiety, academic achievement, or food insecurity score (refer to Table 3 for complete correlational data).
Subsample Analysis of Sleep Quality and Dependent Variables.
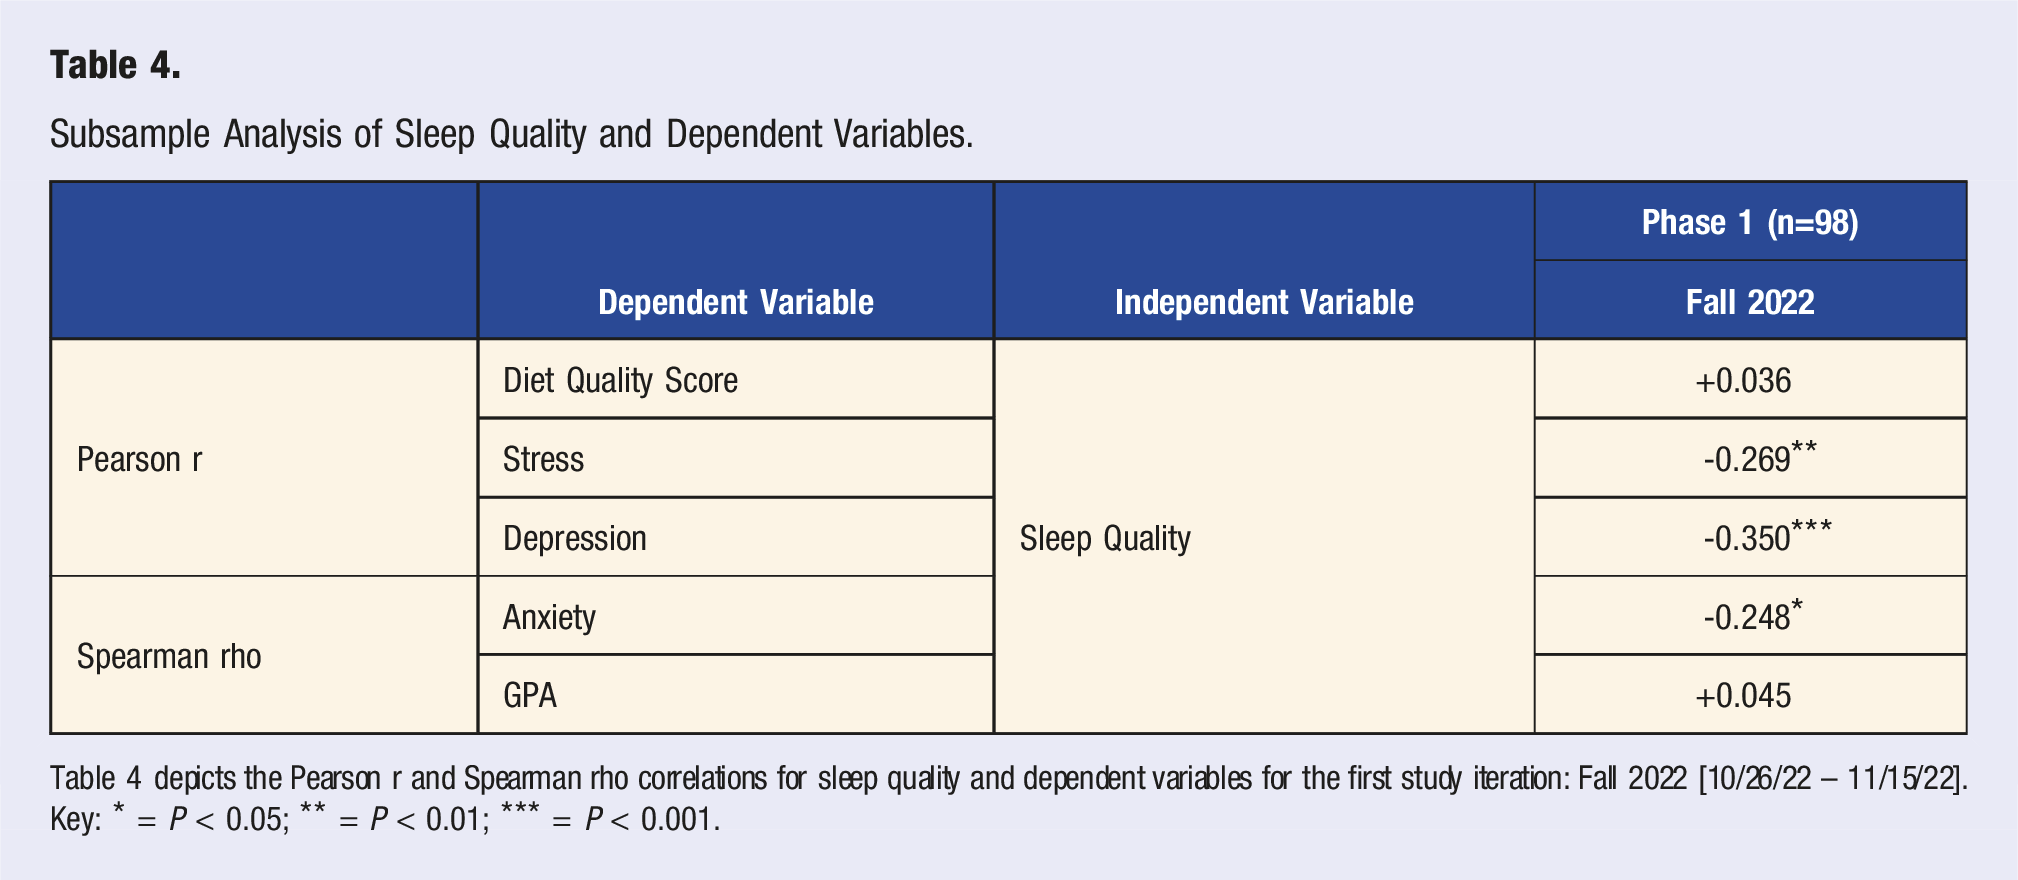
Table 4 depicts the Pearson r and Spearman rho correlations for sleep quality and dependent variables for the first study iteration: Fall 2022 [10/26/22 – 11/15/22].
Key: * = P < 0.05; ** = P < 0.01; *** = P < 0.001.
Overall, diet quality correlated with greater sleep hours, lower stress levels, lower anxiety levels, lower depression severity, and greater academic achievement. Additionally, the presence of dietary restrictions correlated with lower sleep hours, higher depression severity, and better diet quality. Furthermore, food insecurity correlated with lower sleep hours, higher stress levels, higher anxiety levels, higher depression severity, and lower academic achievement.
Discussion
The negative correlation between diet quality score and poor mental health metrics indicates a mechanism to improve overall health, since nutritious diets are associated with decreased prevalence of stress, anxiety, and depression, which tend to be exacerbated in college student populations.10-13 Furthermore, the positive correlation between food insecurity score and negative mental health metrics demonstrates the impact of extenuating circumstances on mental health, since food insecurity is a circumstance of one’s environment and socioeconomic status. Data collected regarding sleep hours was comparable to prior studies, implying that the recent COVID-19 pandemic has not had an impact on college students’ sleep. 8
Prior analysis conducted by van Woerden et al. (2019) examined the relationship between mental health and food consumption related to food insecurity. 4 This research demonstrated that food insecurity could not be mitigated by meal plan offerings since food insecure students underutilized dining dollars regardless of initial meal plan balance. Furthermore, these food insecure students experienced a higher incidence of depression and lower GPAs. 4 The current study supported these findings and expanded on this notion by also focusing on stress and anxiety in addition to depression. This expansion allowed for the determination that stress and anxiety also correlate positively with food insecurity. However, the current study did not analyze meal plan consumption since the host university utilized an “à la carte allocation,” meaning that each food item is marketed for individual sale. Furthermore, students receive the same budget allocation and spending is not based on the number of dining hall visits. This meal plan budgeting differs from the plan offered in the van Woerden et al. (2019) study, which was unlimited spending based on the number of buffet visits. 4
Further research conducted by Vidal et al. (2012) found a similar relationship between poor diet and mental health in medical students. 10 The study concluded that consumption of high fat foods was correlated with an increase in mental disturbances. 10 However, their analysis did not account for the confounding nature of food insecurity, dietary restrictions, and anxiety. The current study addressed these circumstances by analyzing diet in a more holistic manner and accounting for multiple manifestations of poor mental health in college students. Similarly, the current research found that students with poorer diet quality had worse mental health outcomes.
Although the study design was effective in determining key relationships between variables, it was hindered by a small sample size and a skewed demographic distribution. The participants surveyed were similar in their sex assigned at birth, with a female majority. Furthermore, the diet target score questions had to be modified to prevent the exclusion of participants who indicated “prefer not to say” or “I do not know” for questions regarding the intake of polyunsaturated fatty acids and omega 3-fatty acids. The inclusion of these responses assumed that the participants did not understand the question and therefore did not track these specific food metrics. However, this introduced a slight negative skew to the diet quality score’s distribution. Additionally, the depression screening tool was removed from the second study iteration to reduce survey duration, which prevented complete generalizability between the three sets of data. The perceived sleep quality question was removed from the second and third study iteration to further reduce survey duration and prevent respondent attrition. For this reason, only a subsample analysis was able to be conducted to determine correlations with key dependent variables. Furthermore, the anonymity of the participants and the sequential data collections across the three academic semesters imply that the measurements cannot be determined to be entirely independent or dependent since participants could have had repeated participation in the study.
Subsequent research should assess participants again in terms of their current health behaviors (e.g., nutritional intake, food insecurity, and mental health) to determine appropriate health interventions. Furthermore, a more in-depth analysis of student eating patterns could be obtained through food journals. This expanded methodology would allow for a comparison of actual dietary patterns with aspects of lifestyle rather than using a set of Likert questions to evaluate dietary habits. The current study design provided some context for the manner in which college students live in a large university environment, which can be leveraged to improve health outcomes.
Overall, the college environment influences many aspects of a students’ overall health. The relationship established between overall diet and dietary restrictions had a surprising positive correlation, which implies that students with restrictions on their diet are more selective about their food intake and eat healthier as a result. This outcome demonstrates that dietarily restricted students may not need dietary interventions, but rather those without restrictions would benefit more from modifications to their lifestyles. Furthermore, the improvement of these individuals’ diets will lead to better sleep, mental health outcomes, and academic achievement. The relationships between diet quality, food insecurity, sleep, and mental health metrics demonstrate that there is a need for dietary interventions to improve college students’ lives. Therefore, there is an opportunity to establish healthy habits during college, which can prevent the incidence of future health complications 1 and ensure the improvement of overall societal health.
Footnotes
Author Contributions
S. Budnick designed and directed the data collection with guidance from M. Peters and J. Dowthwaite. S. Budnick also performed the analysis of the collected data and drafted the article with critical feedback from M. Peters and J. Dowthwaite.
Declaration of Conflicting Interests
The author(s) declared no potential conflicts of interest with respect to the research, authorship, and/or publication of this article.
Funding
The author(s) disclosed receipt of the following financial support for the research, authorship, and/or publication of this article: This work was supported by the Binghamton University First-Year Research Immersion Program.