
Abstract
‘Our findings reveal a significant correlation between lifestyle choices and income’.
Introduction
Smartphone-based applications (apps) have become an integral part of our daily lives, oftentimes by influencing our lifestyle habits. A smartphone’s operating system (OS) may play a significant role in shaping these habits.
Over 99% of the market share of operating systems is primarily divided between iOS and Android. 1 Thus, this paper investigates the differences in lifestyle habits between iOS and Android users. Health-promoting apps are offered on both smartphone operating systems, covering topics ranging from mental health to smoking cessation.2,3 Both platforms offer many of the same apps, as well as others developed specifically for Android or iOS.
Differences in user profiles of Android- and iOS-powered smartphones – based on factors such as income, socioeconomic status, and age – have been suggested in several publicly available consumer polls. For example, iOS users based in the United States tend to consist of young adults who earn high incomes. 4 Other polls have suggested that the behaviour patterns of iOS and Android users may also differ in terms of app usage, purchasing habits, brand loyalty, and social behaviour.5,6 However, the relationship between smartphone OS and lifestyle habits remains largely unexplored. Differences in adherence to smartphone-based smoking cessation interventions have previously been reported 7 ; however, relevant differences in personality types have not been found in another study. 8
Researchers must be aware of potential differences in lifestyle habits and user preferences for health-promotion interventions. It is important to understand if smartphone OS is associated with differences in users’ daily health habits because this information can help to create tailored apps that can optimise the effectiveness of health interventions and improve user adherence.
The main goal of this study is to determine whether the use of an iOS- or Android-powered smartphone has any association with differences in daily health habits. We conducted an online survey using the Healthy Lifestyle and Personal Control Questionnaire (HLPCQ) to explore differences in dietary habits, physical activity, sleep quality, and social and mental well-being based on the OS that the participants used. It is possible to explain the association between a person’s preferred smartphone OS and their daily health habits in one of 2 ways. First, it could be due to the ‘selection effect’, whereby people who already have a healthier lifestyle are more likely to choose a certain OS. Alternatively, it could be a result of the ‘treatment effect’, where using a specific OS leads to adopting healthier daily habits.
By understanding the possible association, we can gain insight into how technology affects our daily habits and well-being. Additionally, these findings could inform the design of personalised health interventions delivered through smartphones.
Through this comparative analysis, we aim to contribute to the growing body of research on the intersection of technology and lifestyle habits, providing valuable insights for researchers, policymakers, and app developers in the health and technology sectors.
Methods
Study Design
A cross-sectional study was performed. We used an online survey with participants recruited from the United States. Participants were recruited on the platform CloudResearch® Connect™ and redirected to the survey on Google Forms™. We aimed to include a quota of 50% of participants who primarily used either Android or iOS on their smartphones. All participants were required to be at least 18 years old. We did not have any additional preselection criteria. All participants were compensated with a participation fee (equivalent to an hourly wage of 18 dollars), which was in line with industry standards. Participation in the survey was voluntary, and all data was collected anonymously and remained so throughout the study. At no point was collected data traceable to an individual survey participant. Participants were informed of the purpose of the study and that the results would be published in a peer-reviewed scientific journal. We consulted with the local ethics committee before the study commenced. It was concluded that official ethics approval was not necessary since data was collected anonymously, and it was not to be expected that the participants of the survey would be exposed to psychological or physical stress because of their participation.
Design of the Online Survey
The questionnaire consisted of 2 sections with a total of 32 questions and included a description of the research project provided to participants (see the Supplemental Materials for a copy of the questionnaire/project description). Section 1 asked participants which OS they predominately used and included questions on the sociodemographic profiles of patients with a known association with lifestyle habits. These included questions on age, gender, educational degree, household income (based on categories of income quintiles in the United States in 2021), and employment status. All questions in Section 1 were presented in a multiple-choice format, except for the question on the age of participants, which required a short-written answer. Section 2 included 26 questions from the validated HLPCQ questionnaire that assesses current daily health habits. The HLPCQ was developed by Darviri et al. specifically for the evaluation of lifestyle interventions. 9 The questionnaire uses positively phrased questions and assesses the participants’ health empowerment. It focuses on daily routines related to diet, physical exercise, and mental well-being. It was uniquely designed to assess the effect of health-promotion interventions on participants’ daily activities. The HLPCQ has since been validated in international populations and has been used in several studies to assess daily health habits.10–14 Participants were asked how often they engaged in positive lifestyle habits. All questions in the HLPCQ are answered using a four-point Likert scale (1 – Never or Rarely, 2 – Sometimes, 3 – Mostly, and 4 – Always). The questions in the HLPCQ are organised into 5 subscales: dietary healthy choices (7 items), dietary harm avoidance (4 items), daily routine (8 items), organised physical exercise (2 items), and social and mental balance (5 items). The total score can range from a low of 26 to a high of 104, with higher scores indicating healthier daily routines. Overall, we estimated that the average participant would require approximately 5 minutes to complete the survey based on a test run by an independent researcher. The duration of the survey was advertised to be under 10 minutes. The survey was hosted on Google Forms™. Participants were directed to the survey by URL from the Connect™ Website and were not required to identify or specify any personalised or identifiable data. Answering all questions in the survey was mandatory to receive a completion code at the end of the survey.
Sample Size Calculation and Statistical Analysis
We estimated the necessary sample size up front to detect significant differences between the two means of the HLPCQ total score based on available data from the original validation study. The sample size necessary to detect a difference in the means corresponding to half the expected standard deviation (5.92 points) with a power of 80% and a significance level of 5% (two-sided) was 128 total participants, assuming equal group sizes (64 in each group). Statistical analysis was performed using IBM SPSS Statistics 28.0.1. Conventional statistical methodologies were employed for the data description. The mean values, standard deviations, and percentages were approximated to the nearest tenth. The independent t test was utilised to discern differences in mean values, whereas the chi-squared test was employed for identifying group differences in non-continuous variables. A P value of 0.05 was established as the threshold for statistical significance. Before conducting the statistical analysis, the dataset was examined for duplicate entries.
Results
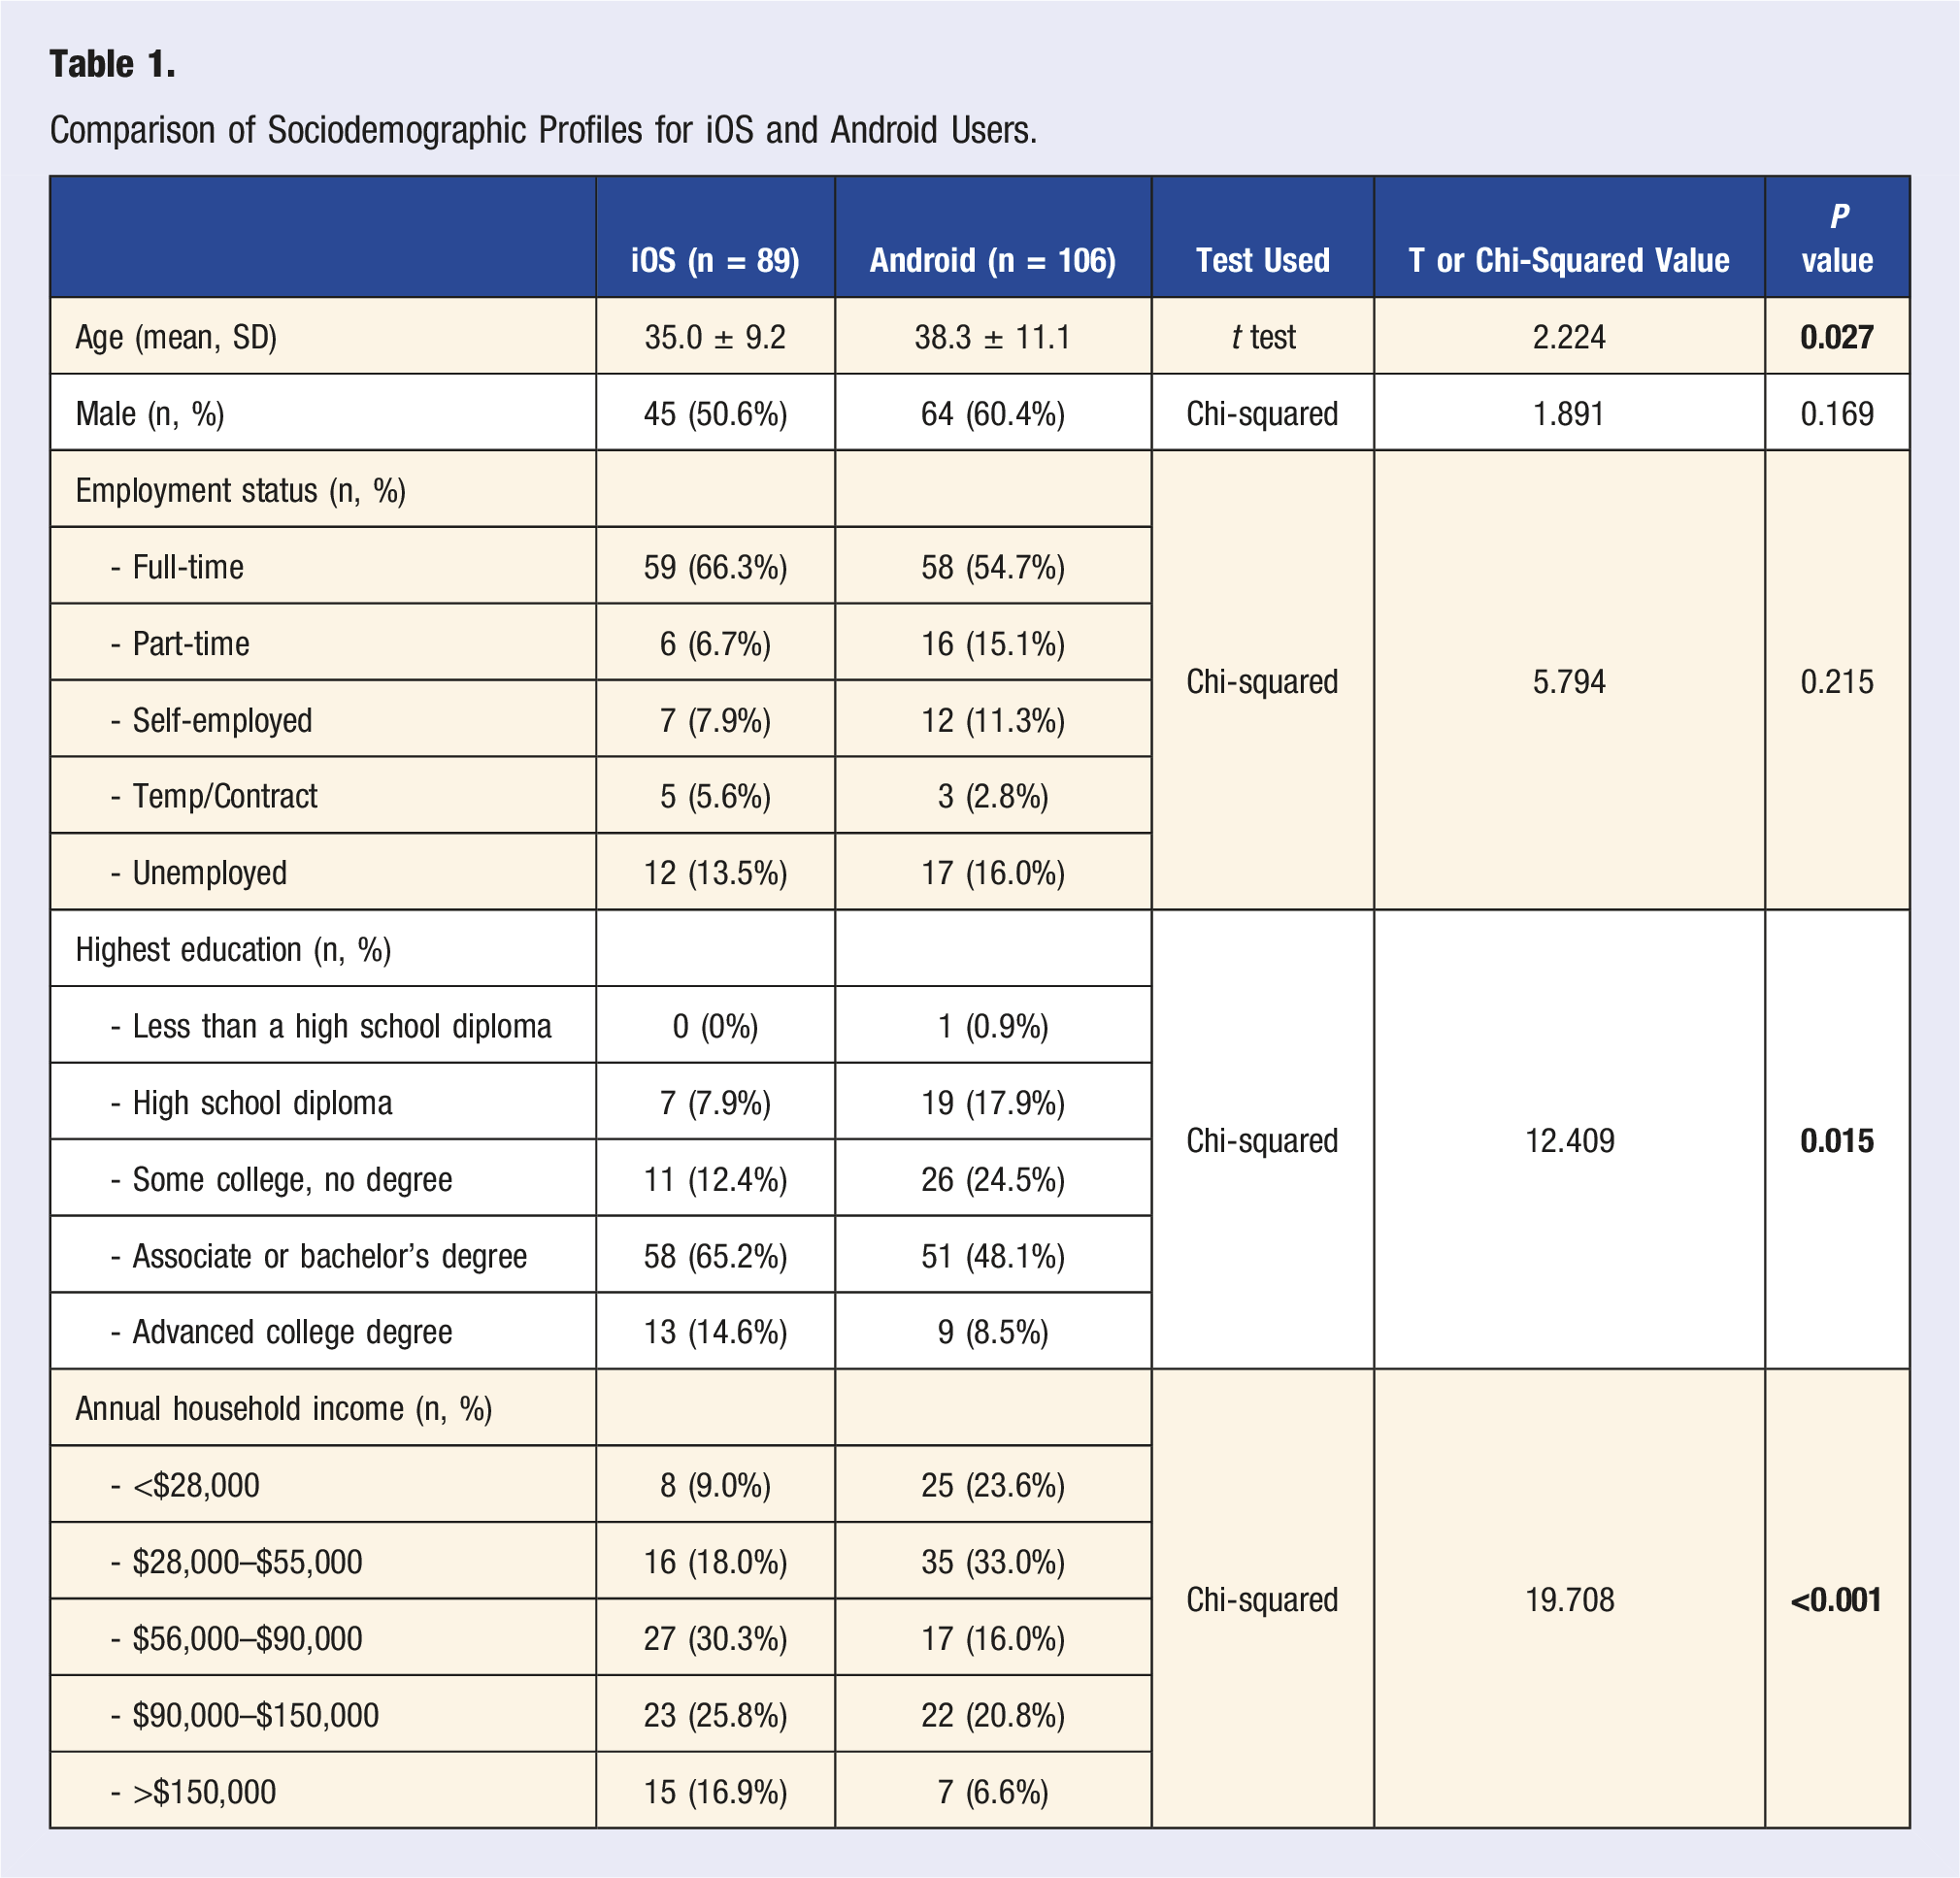
A total of 195 individuals (with 20 people in a pilot study) participated and completed a survey on 3 and 4 January 2024. All survey questions were mandatory, and there were no incomplete responses. After verifying that there were no duplicate entries, we included all the surveys that were submitted in the analysis. Participants took an average of 4 minutes and 58 seconds to complete the survey. In all, 100 participants rated the study with 4.9 out of 5 stars, indicating high satisfaction. The participants’ ages ranged from 19 to 73 years old. The mean age of the participants was 36.8 ± 10.4 (median 36), and 55.9% were male. Most participants worked full-time (60.0%) or part-time (11.3%) were self-employed (9.7%), while 14.9% were unemployed. Most participants (67.2%) had a college degree (associate/bachelor’s degree or higher). The majority of participants were considered ‘middle-class’, with 71.9% earning an estimated annual household income between $28,000 and $150,000, while 16.9% earned less than $28,000 and 11.3% more than $150,000.
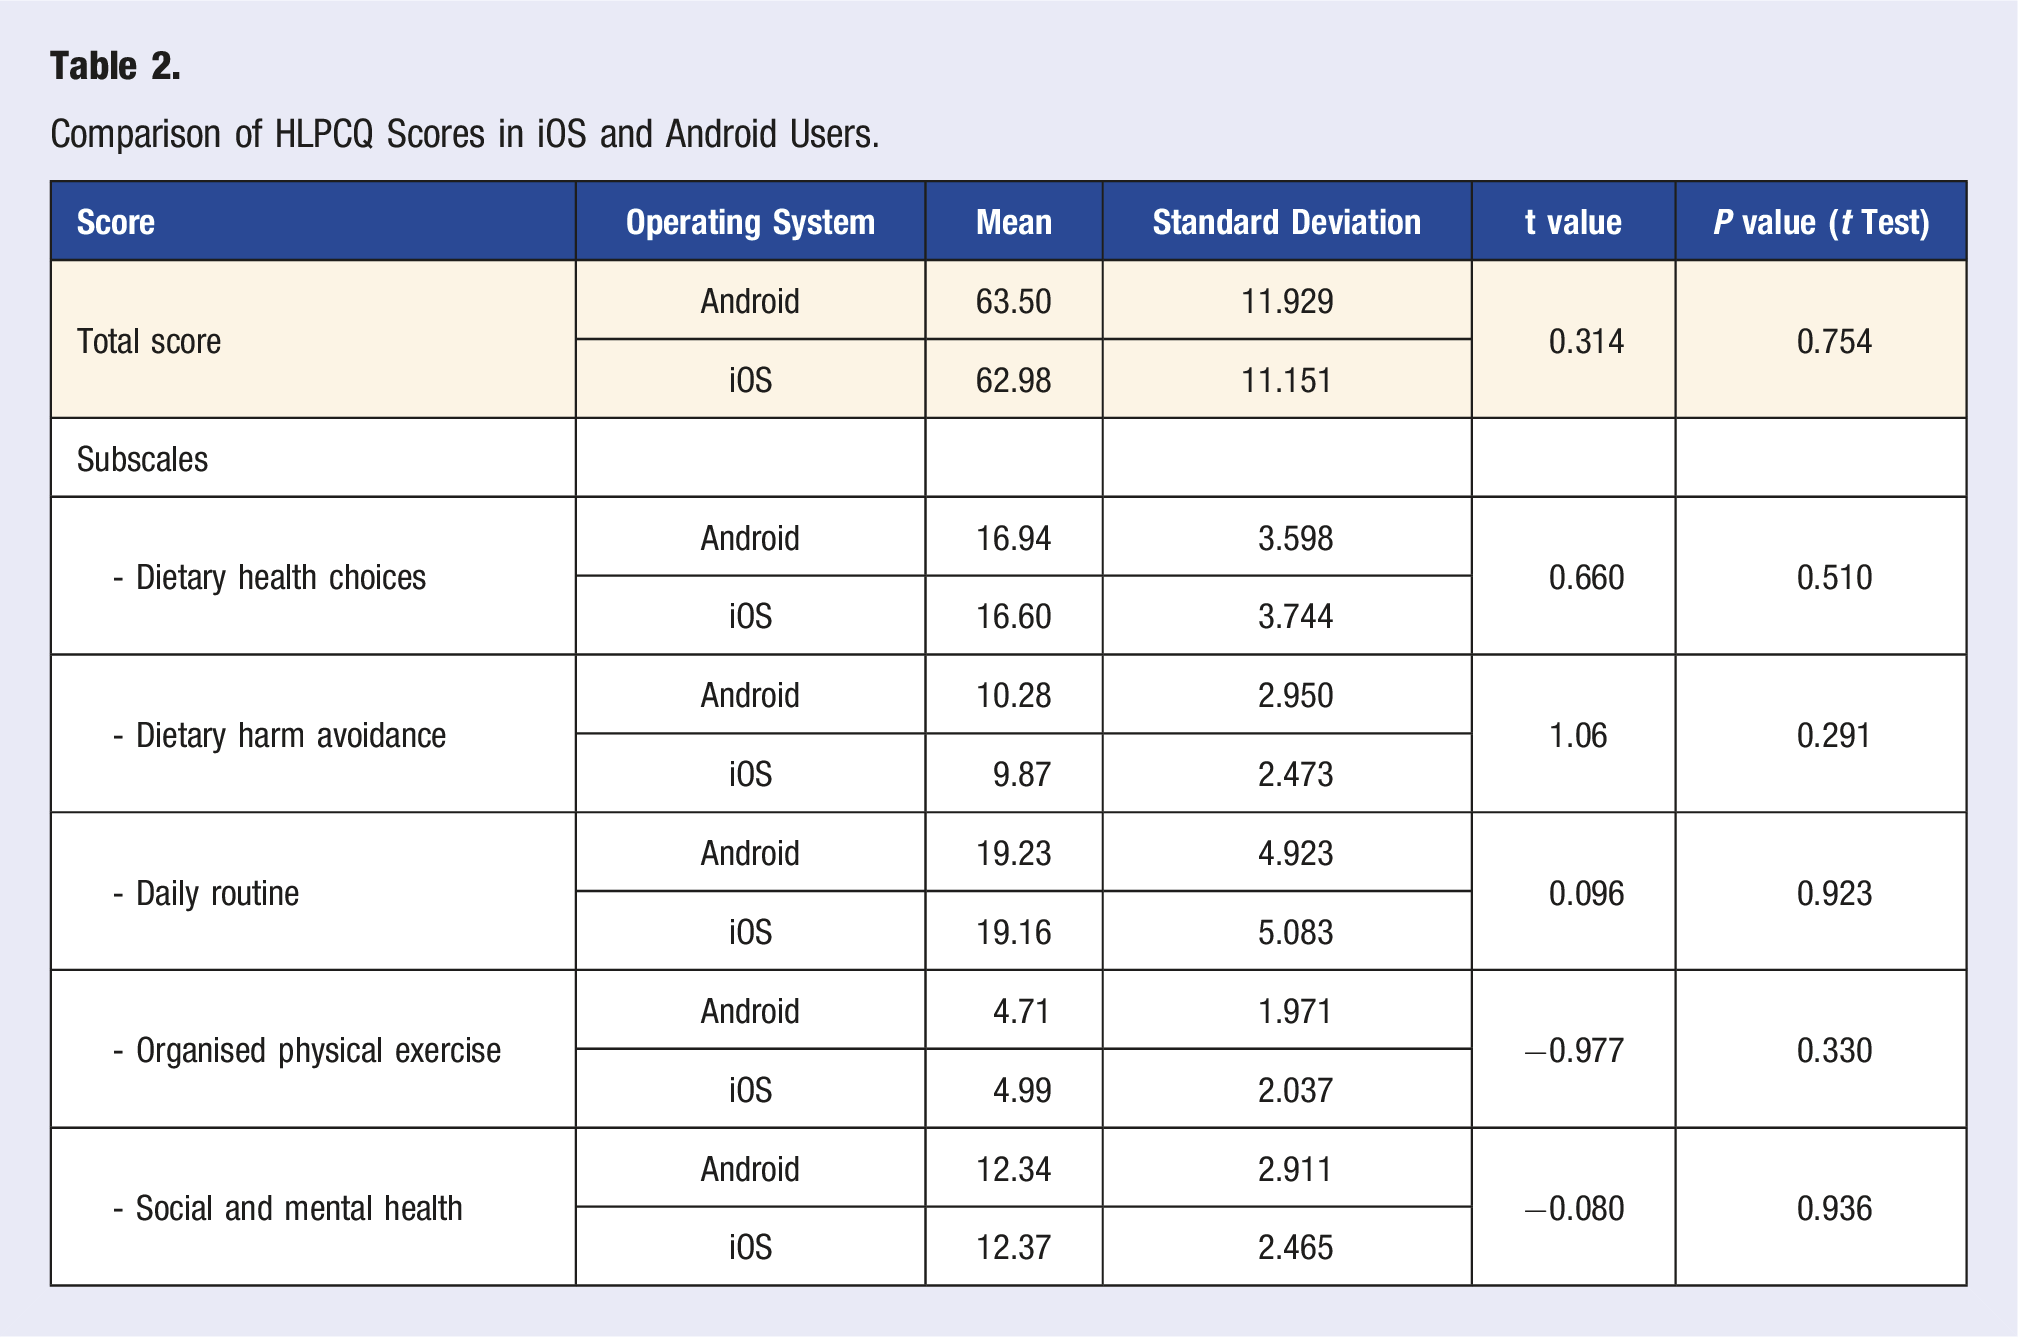
A total of 106 (54.4%) participants were identified as mainly Android users, while 89 (45.6%) used iOS. The mean HLPCQ total score was 63.3 ± 11.6. The mean scores for the HLPCQ subscales were 16.8 ± 3.7 for dietary health choices, 10.1 ± 2.7 for dietary harm avoidance, 19.2 ± 5.0 for daily routine, 4.8 ± 2.0 for organised physical exercise, and 12.4 ± 2.7 for social and mental balance.
Differences Between iOS and Android Users
Comparison of Sociodemographic Profiles for iOS and Android Users.
Comparison of HLPCQ Scores in iOS and Android Users.
Association Between Sociodemographic Profiles and HLPCQ Scores
Determining the Predictive Factors for HLPCQ Total Scores Through Multivariate Linear Regression Analysis.
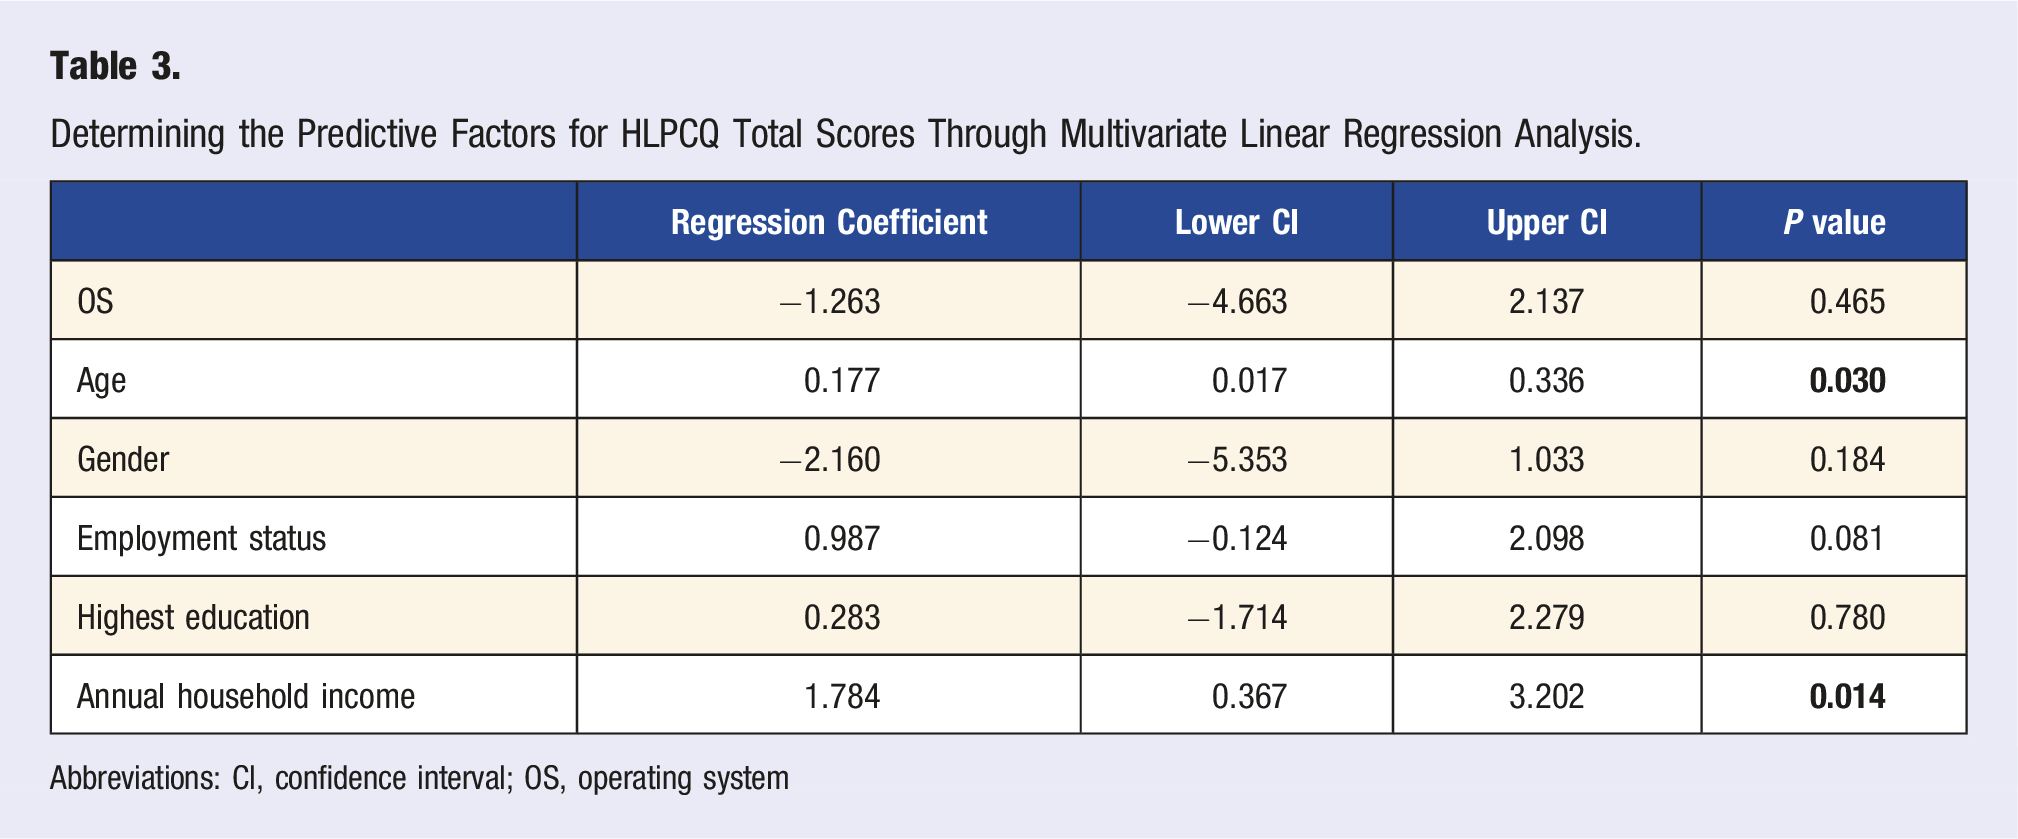
Abbreviations: CI, confidence interval; OS, operating system
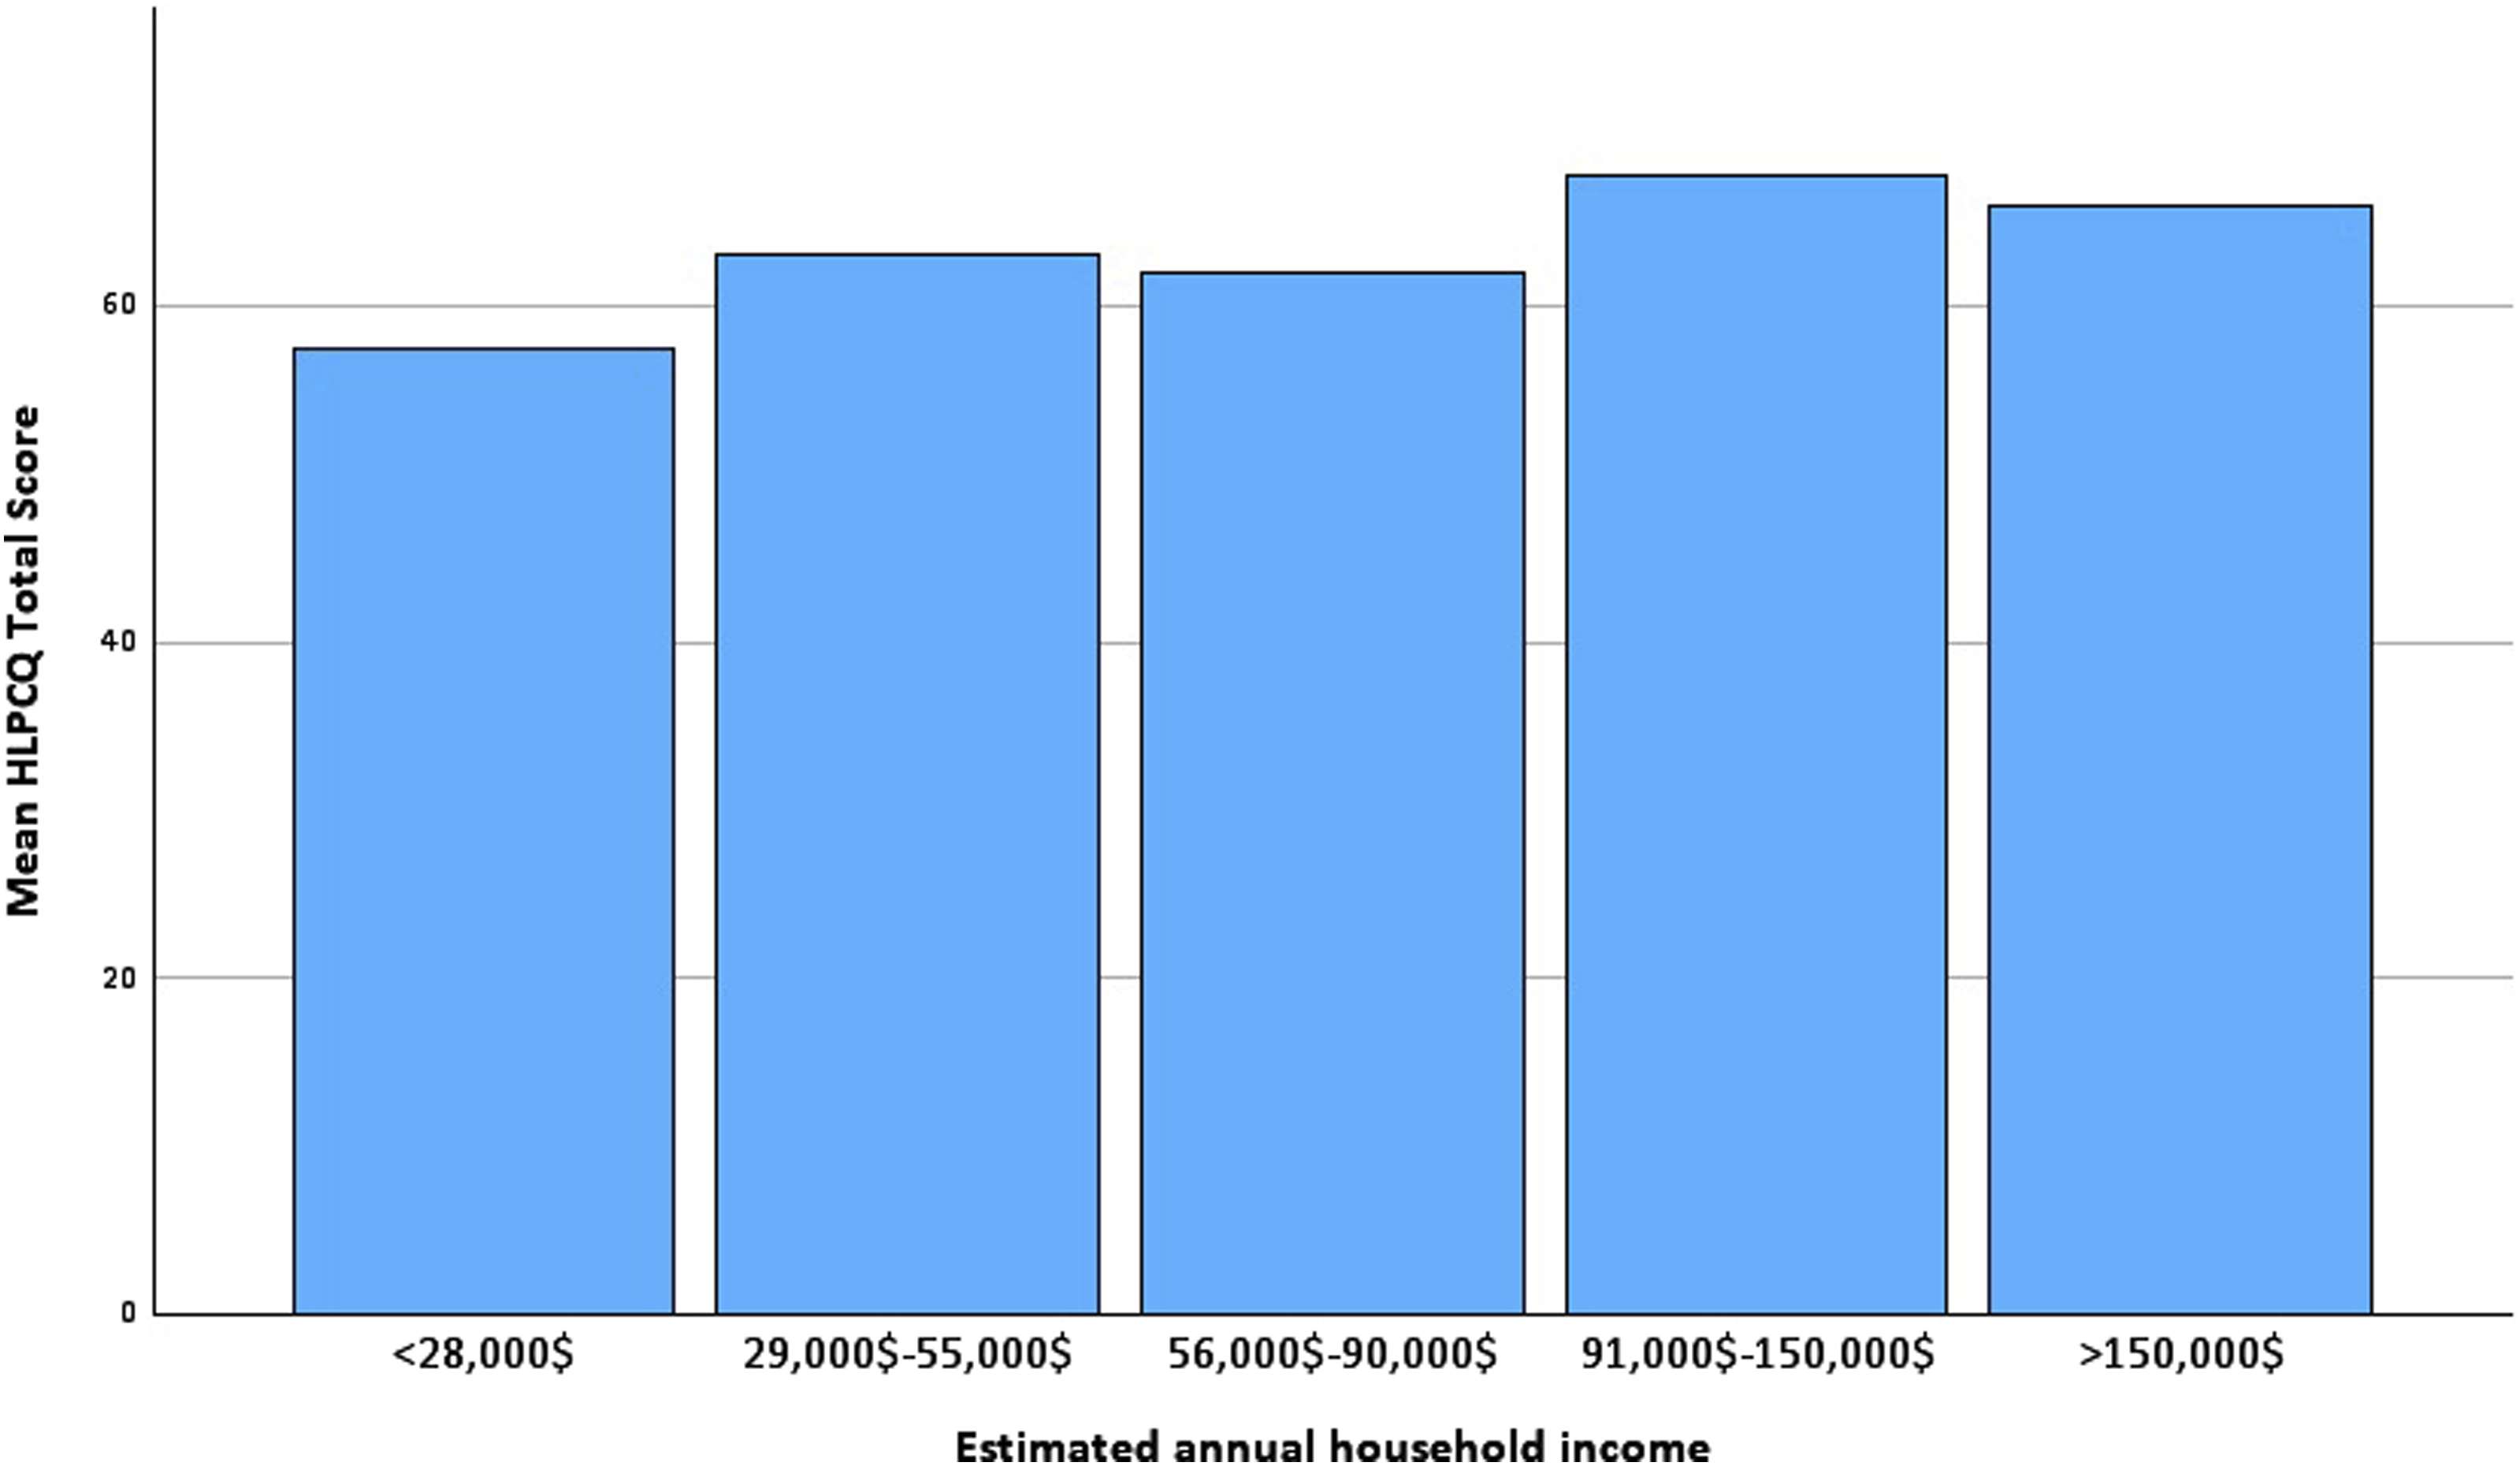
HLPCQ total score by estimated annual household income.
Discussion
Main Findings
1. iOS Users Were Younger, Had a Higher Educational Degree, and Had a Higher Estimated Annual Household Income
Our findings on the sociodemographic profiles of iOS and Android users are in line with previously reported data. Most data available on this subject has been derived from non-scientific consumer surveys. However, our findings align with previously reported data, as the study revealed that iOS users were younger and identified more often as female.5,15,16
2. No Association Between Smartphone OS and HLPCQ Total Score or Any of Its Subscales
We found that the type of smartphone OS was not associated with a higher HLPCQ score in the sample studied. The results consistently showed no association between OS and the subscales of the HLPCQ, leading to the conclusion that there was no direct connection between the OS a person used and their lifestyle habits. Importantly, the results of the study indicate that there is no need to adapt lifestyle apps to a specific OS. Rather, simultaneous development of lifestyle intervention apps is possible for both the Google Play Store and the Apple App Store. However, independent predictors for lifestyle habits (such as estimated annual household income) were associated with HLPCQ scores and smartphone OS, which suggests that associations between OS and lifestyle habits could be found in smaller populations as a confounding effect. Researchers should be aware of this possibility when conducting future smartphone-based lifestyle interventions. Developers of smartphone-based health interventions should consider designing apps specifically for target populations based on their socioeconomic composition.
3. Age, Employment Status, and Estimated Annual Household Income Were Identified as Predictors of the HLPCQ Total Score
We were able to confirm several known socioeconomic characteristics as predictors of daily healthy habits. Age was an important predictor. We found that older age was associated with higher HLPCQ total scores, mainly due to higher scores in the subscales for daily routine and dietary harm avoidance. After dividing the participants into 2 age groups (the cut-off age was 40), we confirmed the same results upon repeating the analysis. Both these aspects of daily habits would be expectedly more prevalent in the older group, who are likely to prioritise regular meals and avoid fast food and soft drinks when compared to younger participants. This is partly because the HLPCQ focuses on daily healthy habits and less on categories such as intensive physical exercise, in which younger individuals are expected to have higher scores. Employment status and estimated annual household income are also known predictors of a healthy lifestyle. As expected, a higher socioeconomic status (i.e. higher household income and working full-time or being self-employed) predicted higher HLPCQ scores. Higher income has been associated with higher rates of regular physical exercise, 17 while income inequality may be detrimental to social well-being. 18 Previous studies have suggested that regular exercise is more common among high-income and full-time employed individuals compared to low-income and part-time employed individuals. 19 Nutrition knowledge and diet are also associated with household income. In developed countries, the knowledge of a healthy diet and healthy shopping behaviour is higher among individuals with better financial status.20,21 Unemployment, in particular, has been associated with poor dietary habits. 22 In our study, we found no significant correlation between household income and the subscales of the HLPCQ related to dietary habits. This could be the case because the HLPCQ does not assess nutrition knowledge or shopping behaviour but rather focuses on habits associated with daily eating routines. Regression analysis suggested a linear progression of HLPCQ scores with increasing household income in our study. However, participants who identified with the above $150,000 annual income group had slightly lower scores than those in the $91,000–$150,000 group, suggesting a ceiling effect in the relationship between household income and HLPCQ scores. It is necessary to conduct additional research to better understand the relationship between income and daily health habits. Our findings reveal a significant correlation between lifestyle choices and income. This information can assist researchers in designing customised smartphone-based interventions, which can effectively target people with lower socioeconomic status. These interventions can serve as an alternative to traditional health apps and can prove to be beneficial for individuals who are harder to reach.
Implications of Our Study
We did not find sufficient evidence that smartphone OS was a predictor of lifestyle habits using the HLPCQ questionnaire. This suggests that the preference for a particular OS may not have influenced lifestyle habits independently, as measured by the HLPCQ questionnaire. However, researchers must be aware that sociodemographic profiles influence lifestyle behaviour independently, which can be relevant when designing apps for targeted intervention studies (and, therefore, adjusting for these factors). It is recommended that researchers determine the socioeconomic profile and preferences of the targeted population before designing an intervention app.
Strengths
After thorough plausibility checks, the data quality appeared satisfactory. The average time taken to complete the survey aligns with our initial estimate based on an independent third-party tester. Notably, the HLPCQ total score in our study was 63.3 ± 11.6, closely mirroring the 64.4 ± 11.8 score in the original validation study of the questionnaire, lending credibility to our results. 9 The study had a participant count that exceeded the required sample size, ensuring sufficient data to effectively address the research question. The parameters we compiled for socioeconomics accurately represent the US population and also challenge a significant selection bias.
Limitations
Several limitations should be considered when interpreting our results. The nature of paid online surveys inherently introduces the potential for self-selection bias, as participation is voluntary. It is important to note that the quick recruitment process and short duration of the study made it unlikely that the participants were preselected. Despite this, it is possible that older seniors who may have unhealthy lifestyle habits were not well represented in our sample group. 23 As our survey was conducted online on a paid platform, our participants were preselected on the basis of only those willing to participate in surveys. Our participant pool was exclusively from the United States, where iOS is more prevalent than Android, which alternatively holds over 70% of the global smartphone market share and is particularly popular in lower-income nations.1,5 Consequently, in regions where iOS usage is predominantly among upper-class households, the choice of operating system could be more strongly linked to socioeconomic status, leading to a greater confounding effect. The survey’s format inherently limited the information we could gather about participants. For example, a more detailed inventory of social influencing factors, such as access to preventative medical measures and insurance status, was not collected and could be examined in future studies on the association between OS and healthy lifestyles. One significant limitation is the sample size. These findings should be confirmed in future larger studies. We also cannot rule out the possibility that the choice of operating system could be linked to more specific lifestyle behaviours that were not all accounted for in this survey, such as more vigorous exercise. Further research could investigate whether certain behaviours (e.g. daily step count or preference for particular physical activities) are associated with smartphone OS. However, the HLPCQ was specifically designed to evaluate lifestyle interventions and to provide a comprehensive and representative assessment of various aspects of daily health habits.
Conclusion
The findings of this study did not identify smartphone operating systems as standalone predictors of daily health habits. As an exploratory study, these results should be validated in future research with larger participant samples. For those conducting smartphone-based lifestyle interventions, it would be beneficial to focus on the established sociodemographic factors linked to lifestyle habits when designing future health-promotion interventions.
Supplemental Material
Supplemental Material - A Comparative Survey on Daily Health Habits Among iOS and Android Smartphone Users
Supplemental Material for A Comparative Survey on Daily Health Habits Among iOS and Android Smartphone Users by Matthias N. Ungerer and Christoph Gumbinger in American Journal of Lifestyle Medicine
Footnotes
Acknowledgements
We would like to express our gratitude to all the participants who took part in our online survey. Without their valuable contributions, this study would not have been possible.
Declaration of Conflicting Interests
The author(s) declared no potential conflicts of interest with respect to the research, authorship, and/or publication of this article.
Funding
The author(s) received no financial support for the research, authorship, and/or publication of this article.
Ethical Statement
Data Availability Statement
Data can be made available upon reasonable request.
Supplemental Material
Supplemental material for this article is available online.
References
Supplementary Material
Please find the following supplemental material available below.
For Open Access articles published under a Creative Commons License, all supplemental material carries the same license as the article it is associated with.
For non-Open Access articles published, all supplemental material carries a non-exclusive license, and permission requests for re-use of supplemental material or any part of supplemental material shall be sent directly to the copyright owner as specified in the copyright notice associated with the article.