
Abstract
Purpose: To assess whether biometric data of participants (i.e., weight, body mass index (BMI), body fat percentage (BFP), heart rate, and blood pressure) would be statistically different from pre- to post-program assessments after completion of a single institution medical fitness referral program. Methods: This is a retrospective analysis of randomly selected participants from August 2015 to December 2022. Analysis of variance was performed for each outcome with groups separated by gender, age, and time period relative to COVID. Results: Analysis included 984 participants, 653 (66%) were female, mean age was 55.5 years (SD = 14.9) with 297 (30%) of participants ≥65, and 747 (76%) completed the program prior to COVID. Significant mean reductions from pre- to post-program were seen for BMI (−.43, SD = 1.16), weight (-2.69 pounds, SD = 7.44), BFP (.44%, SD = 2.35%), systolic blood pressure (3.33 mmHg, SD = 14.58), and diastolic blood pressure (2.18 mmHg, SD = 8.65). Additional significant interactions identified: weight difference for participants less than age 65 (−3.16, SD = 8.31) vs participants ≥65 (−1.60, SD = 4.66), P = .003. Conclusions: In this analysis, participants of the program from August 2015 to December 2022 were seen to have statistically significant reductions in the delineated biometric parameters. However, due to limitations, specific conclusions regarding causation cannot be drawn.
“Though one cannot conclude that the participants’ individual heart rate variability increased after completion of the program, it does suggest that the average participant’s heart rate is expected to fall into a wider range after the program than before the program.”
Introduction
Exercise is medicine® (EIM) is a United States based health initiative co-launched by the American College of Sports Medicine (ACSM) and the American Medical Association (AMA) in 2007 with the aim of making physical activity and the promotion of physical activity a standard in medicine. EIM recommends health care providers to assess every patient’s level of physical activity at every visit, provide counseling regarding promotion of physical activity, and refer the patient to physical activity resources within the organization or in the community. 1 Within this framework, multiple organizations have implemented their version of EIM with different styles and outcomes. Kaiser Permanente of Northern California has implemented their Exercise as a Vital Sign (EVS) program in which medical assistants were trained to ask the following two questions to each patient prior to the physician encounter: (1) How many days a week do you engage in moderate to strenuous exercise (like a brisk walk)? (2) On average, how many minutes per day do you exercise at this level? During a one-year evaluation from 2010 to 2011, EVS implementation resulted in more progress note documentation regarding exercise, patients were more likely to receive physician counseling regarding exercise, and patients experienced a relative greater decline in weight and HbA1c. 2
At our institution (Owensboro Health), all providers have the option to refer patients to an exercise program based off the principles of the Exercise is Medicine® initiative hosted at the institution’s health multiplex Owensboro Health Park, a Medical Fitness Association (MFA) certified facility. 3 This eight-week program begins with a fitness assessment of biometric data such as weight, body mass index (BMI), body fat percentage, heart rate, and blood pressure by a degreed fitness professional from which a tailored exercise plan is created for the participant. Each fitness professional has a 4 year degree in exercise physiology or a related field, and an NCCA (National Center for Certifying Agencies) accredited personal trainer certification. During the program, participants receive weekly check-in phone calls from the fitness professional. To participate, patients were required to submit a $50 deposit which was returned to participants if they document at least 3 exercise session per week for the duration of the program.
In this retrospective study, we analyzed a random selection of participants of this institution’s (Owensboro Health) medical fitness referral program who started the program between August 2015 and December 2022. We sought to assess the hypothesis that the biometric data of participants such as weight, BMI, body fat percentage, heart rate, and blood pressure would be statistically different from the pre-program to the post-program assessments.
Methods
This was a single center retrospective chart review which included participants who started the medical fitness referral program between August 2015 through December 2022. This study was deemed non-human subjects research and received IRB approval to proceed from the University of Louisville IRB, the institution to which the authors are affiliated. This study also received approval from Research Compliance of Owensboro Health Regional Hospital, the entity to which the medical fitness referral program is operating under. The protocol was approved by both the University of Louisville IRB and Research Compliance of Owensboro Health Regional Hospital.
Data was collected by a single study member, ZL, by recording pertinent biometric values (delineated below) from pre- and post-program assessment forms that were provided to ZL by program staff. Information on the collection sheet included name, gender of participant, birthdate of participant, date of pre-program assessment, date of post-program assessment, blood pressure, diastolic blood pressure, resting heart rate, height, weight, BMI, and body fat percentage. Study member, ZL, transcribed data from the collection sheets onto an excel file in which each row represents a unique program completion by a participant. Some participants did complete the program more than one time. Only de-identified data was transcribed. The age (at program commencement) was calculated using a custom excel formula from the date of birth and date of pre-program assessment. The birthdate was not recorded in the final excel data file. For some participant collection sheets from either the pre-program or post-program assessments had missing information such as the gender or date of the assessment. In such case, ZL performed a targeted chart review of the participant in the Owensboro Health Regional Hospital electronic health record to obtain the missing information as the pre-program and post-program assessments were documented as a note in the electronic health record by the program staff. All data collection was performed on a password protected computer owned by Owensboro Health Regional Hospital.
Initially, 1112 exercise participants were entered into an Excel spreadsheet and then imported into SPSS for Windows Version 29.0. These participants were selected randomly from a repository of participant files stored by program staff in either digital or paper records. Participants less than 18 were excluded to eliminate the bias intrinsic to puberty. Participants were also excluded from the database if their length of time in the program was less than 42 days or greater than 70 days to capture participants who completed the entire program without significant interruption. After exclusion, the total sample size was 984 participants. A small number of missing values were present for the outcomes of blood pressure (N = 2) and heart rate (N = 8). For the outcome of body fat percentage, due to error message received from the bio-impedance testing machine or participant declining testing, 138 participants were excluded from the analysis, yielding a total sample size of 846 for the analysis of body fat percentage.
Statistical Methods
Demographics are presented as frequencies, percentage, means and standard deviations. For the pre- and post-program intervention, paired sample t-test were performed on the six outcome measures of BMI, weight in pounds, body fat percentage, diastolic blood pressure, systolic blood pressure, and heart rate. The distributions of pre- and post-differences in all outcomes were assessed and all were deemed normally distributed with no extreme outliers. Age was collapsed into two categories (less than 65 years of age vs greater than 65 years of age), along with the program start date relative to COVID-19 (before February 2020 vs after February 2020). Then three between groups repeated measures analysis of variance were performed on each of the six outcomes. The analysis of variance models included (a) gender, pre-, and post-time period (time) and gender by time interactions (b) age, time, and age by time interaction, and (c) COVID-19 period, time, and COVID-19 period by time interaction being assessed. Test of simple effects were performed regardless of whether interaction effects were found. Means, standard deviations (SD), percent change, and Cohen’s D are presented in tabular form. Cohen’s D is a measure of effect size; Cohen defines an effect of .0 to .20 as negligible, .21 to .50 as small, .51 to .80 as moderate, and greater than .80 as large. Statistical significance was set at convention of P < .05 and all tests were 2-tailed.
Results
Of the 984 participants, 653 (66%) were female, the mean age was 55.5 years (SD = 14.9) at start of the medical fitness referral program with 297 (30%) of participants 65 and older, and 747 (76%) completed the program prior to COVID.
Body Mass Index
Body Mass Index (BMI) by Gender, Age, and COVID Period From Pre to Post Program.
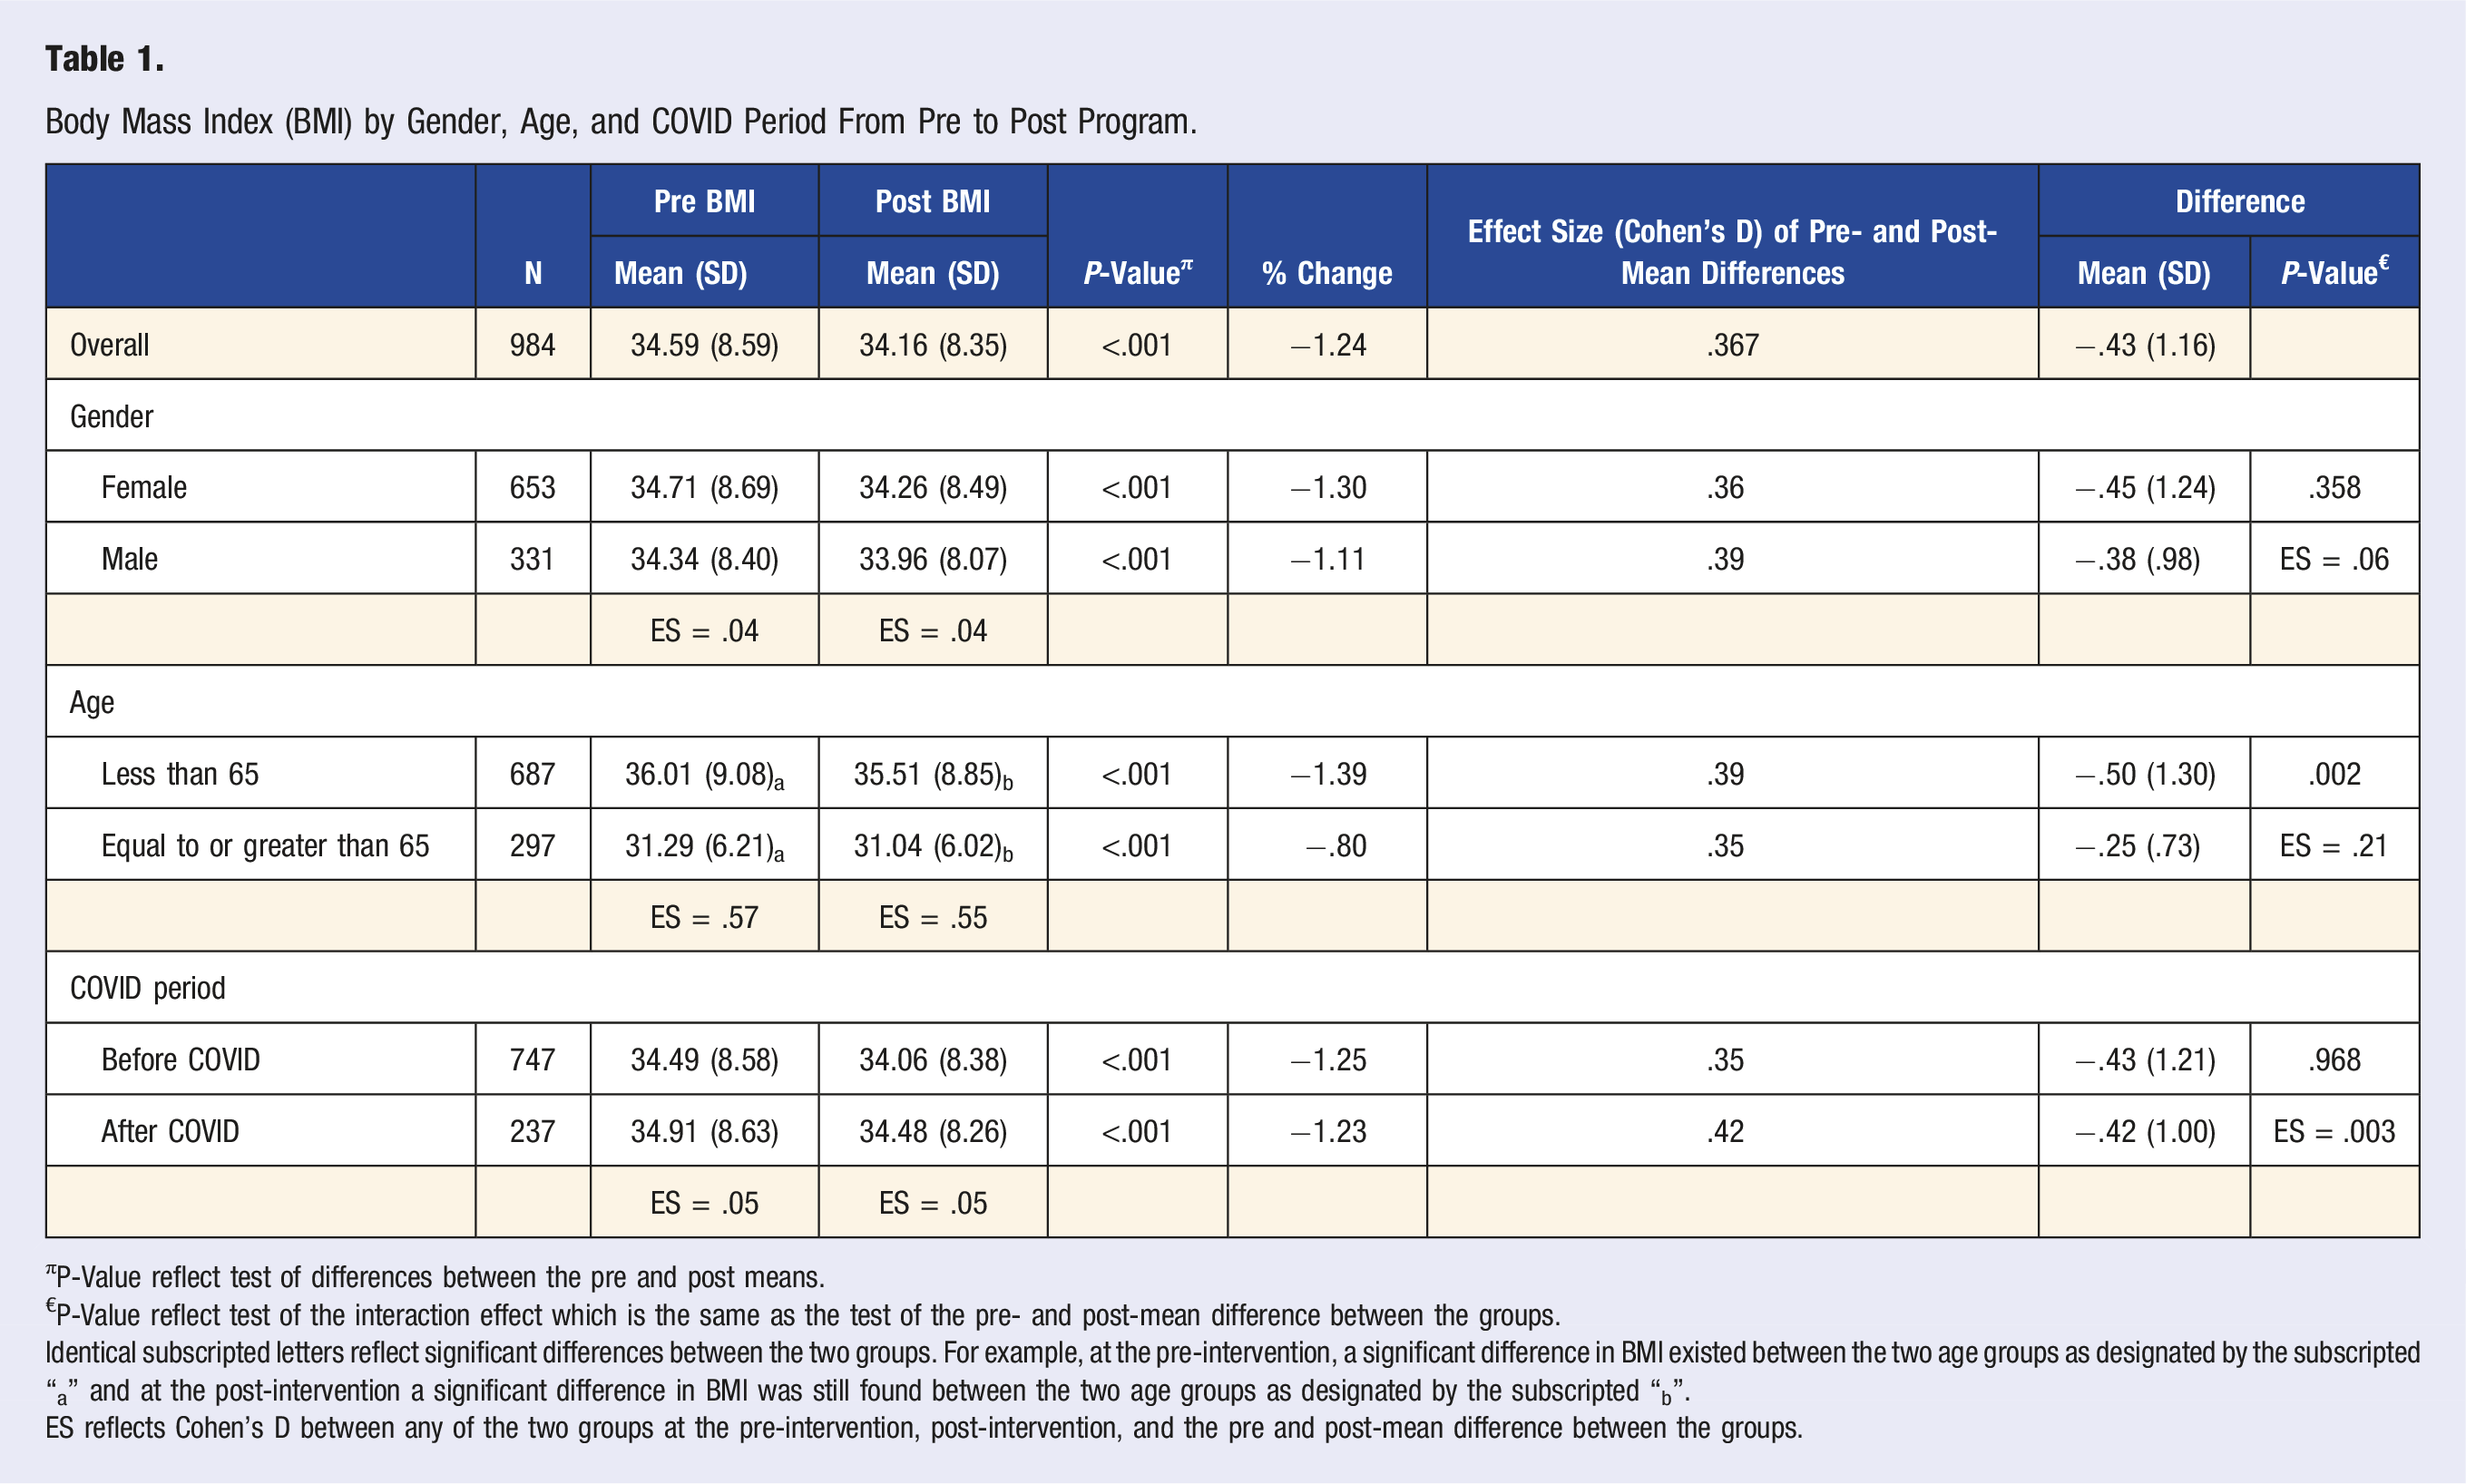
πP-Value reflect test of differences between the pre and post means.
€P-Value reflect test of the interaction effect which is the same as the test of the pre- and post-mean difference between the groups.
Identical subscripted letters reflect significant differences between the two groups. For example, at the pre-intervention, a significant difference in BMI existed between the two age groups as designated by the subscripted “a” and at the post-intervention a significant difference in BMI was still found between the two age groups as designated by the subscripted “b”.
ES reflects Cohen’s D between any of the two groups at the pre-intervention, post-intervention, and the pre and post-mean difference between the groups.
Weight
Weight by Gender, Age, and COVID Period From Pre to Post Program.
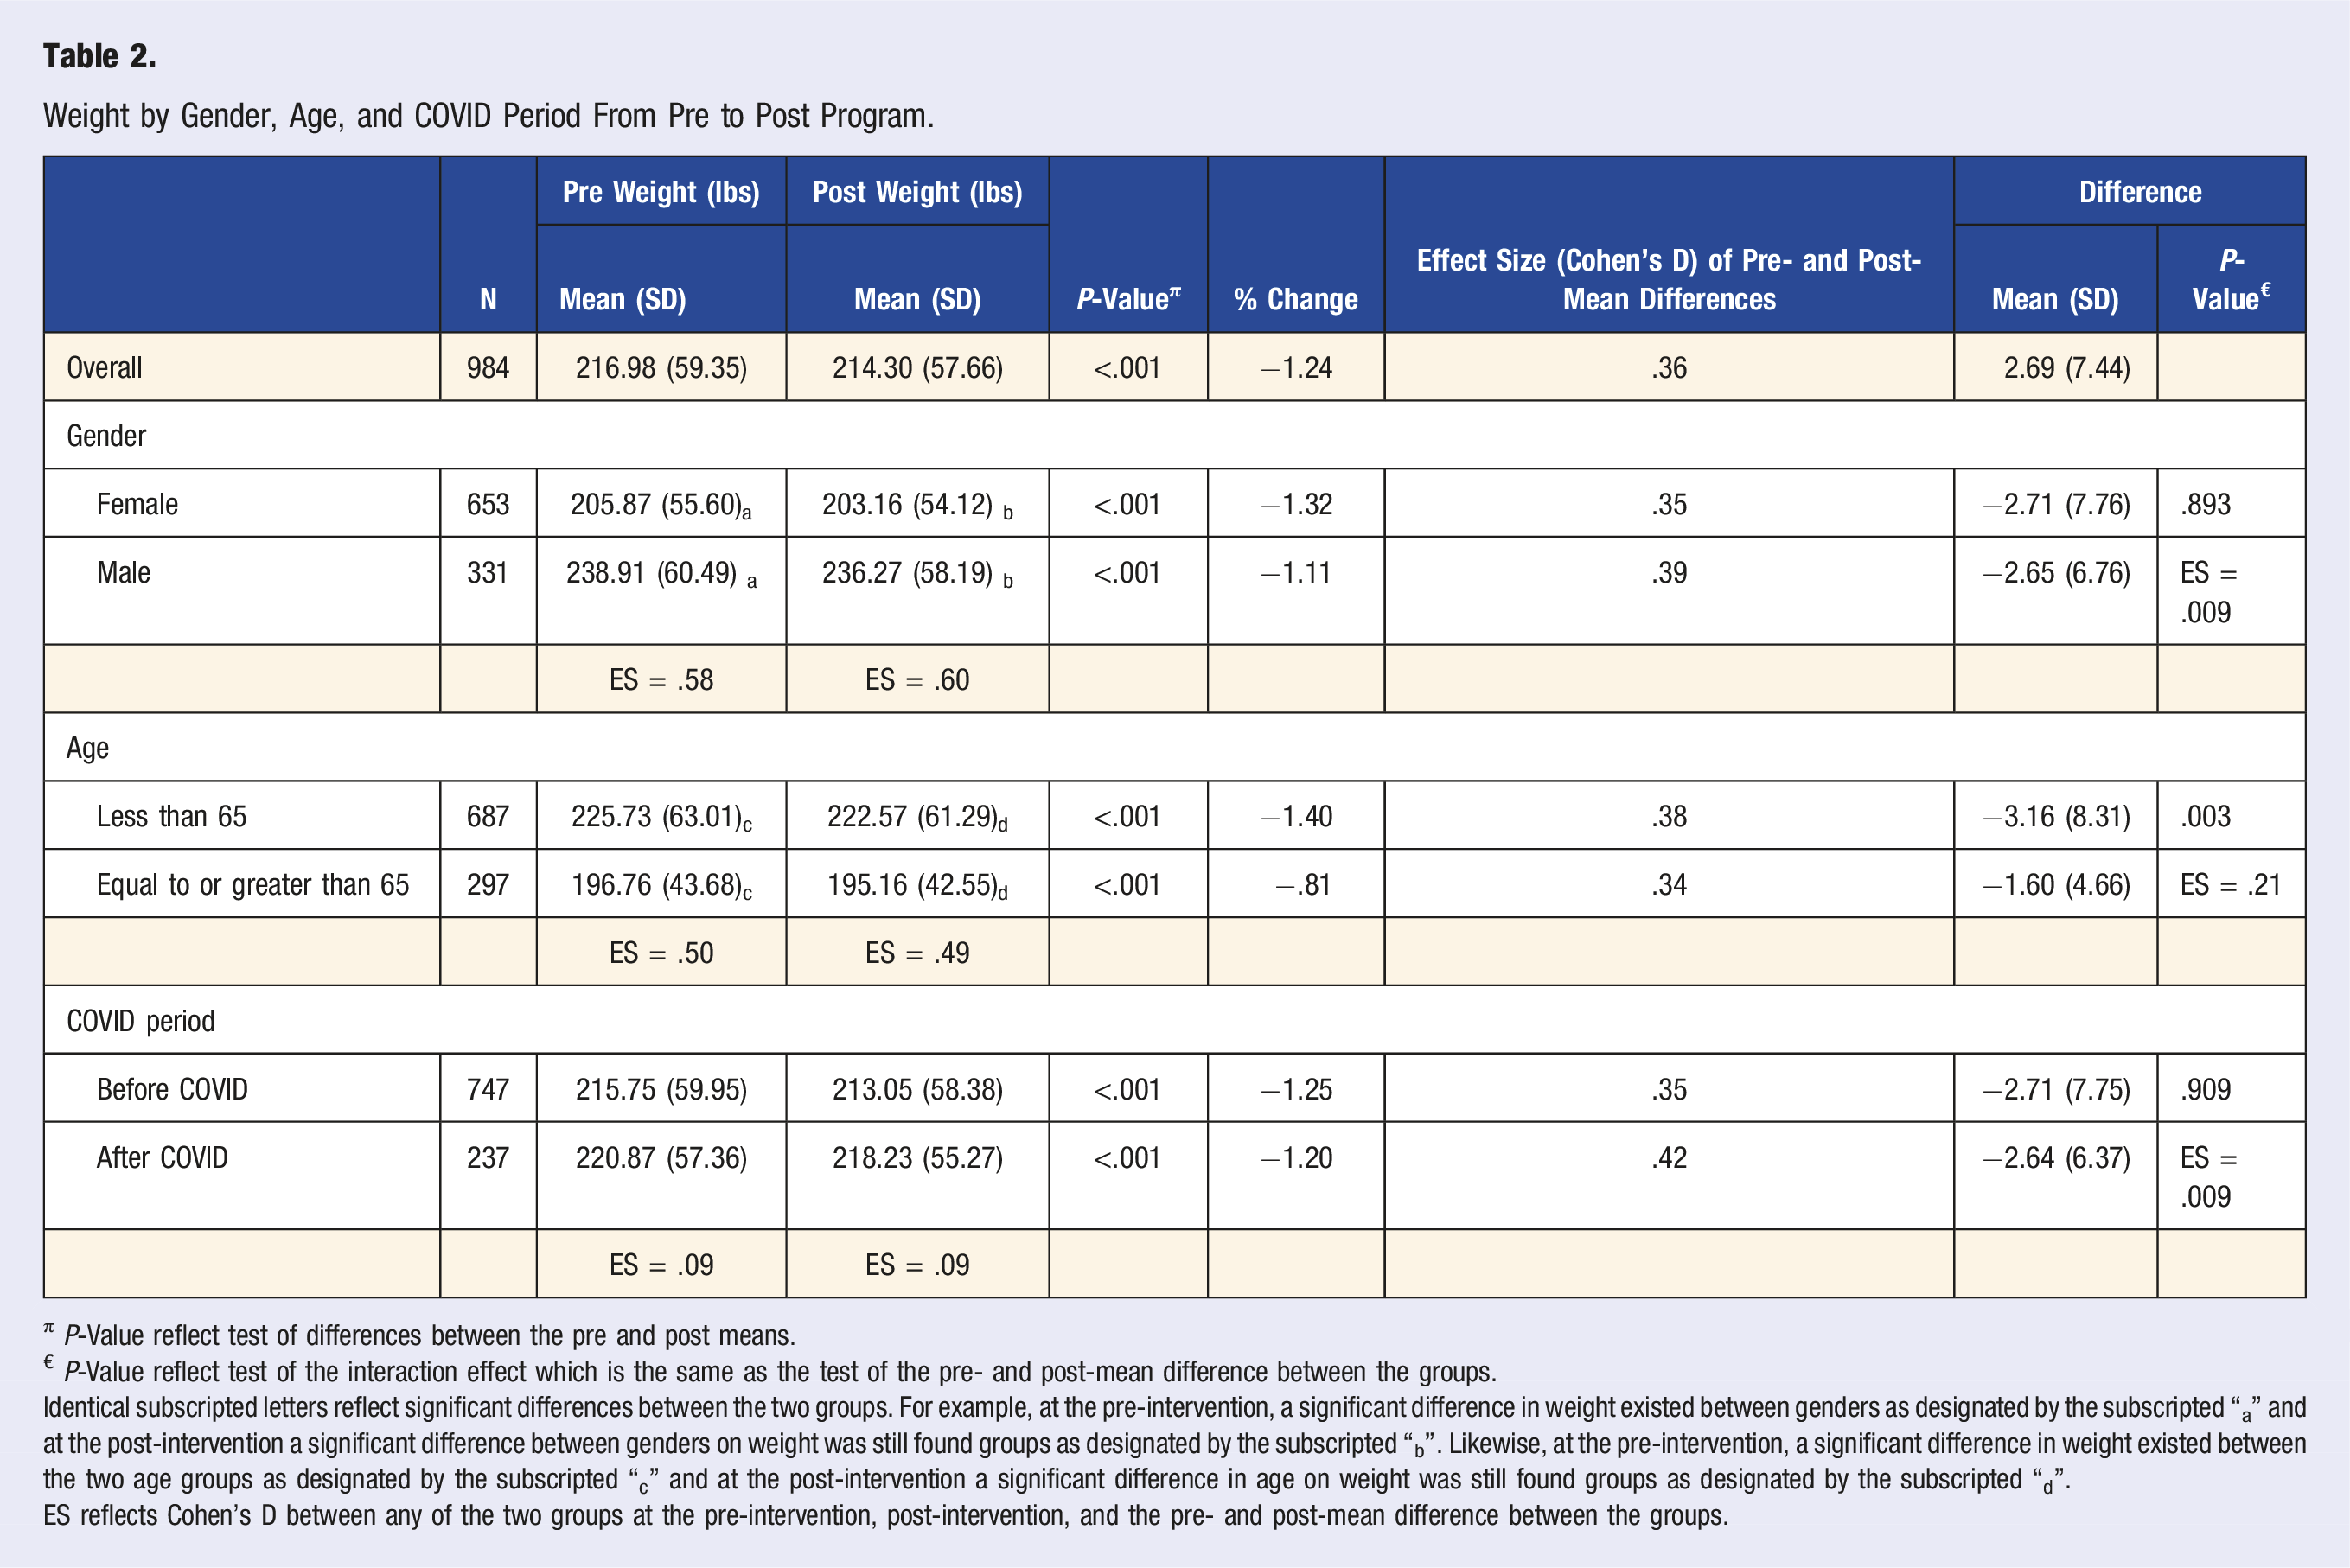
π P-Value reflect test of differences between the pre and post means.
€ P-Value reflect test of the interaction effect which is the same as the test of the pre- and post-mean difference between the groups.
Identical subscripted letters reflect significant differences between the two groups. For example, at the pre-intervention, a significant difference in weight existed between genders as designated by the subscripted “a” and at the post-intervention a significant difference between genders on weight was still found groups as designated by the subscripted “b”. Likewise, at the pre-intervention, a significant difference in weight existed between the two age groups as designated by the subscripted “c” and at the post-intervention a significant difference in age on weight was still found groups as designated by the subscripted “d”.
ES reflects Cohen’s D between any of the two groups at the pre-intervention, post-intervention, and the pre- and post-mean difference between the groups.
Body Fat Percentage
Body Fat Percentage by Gender, Age, and COVID Period From Pre to Post Program.
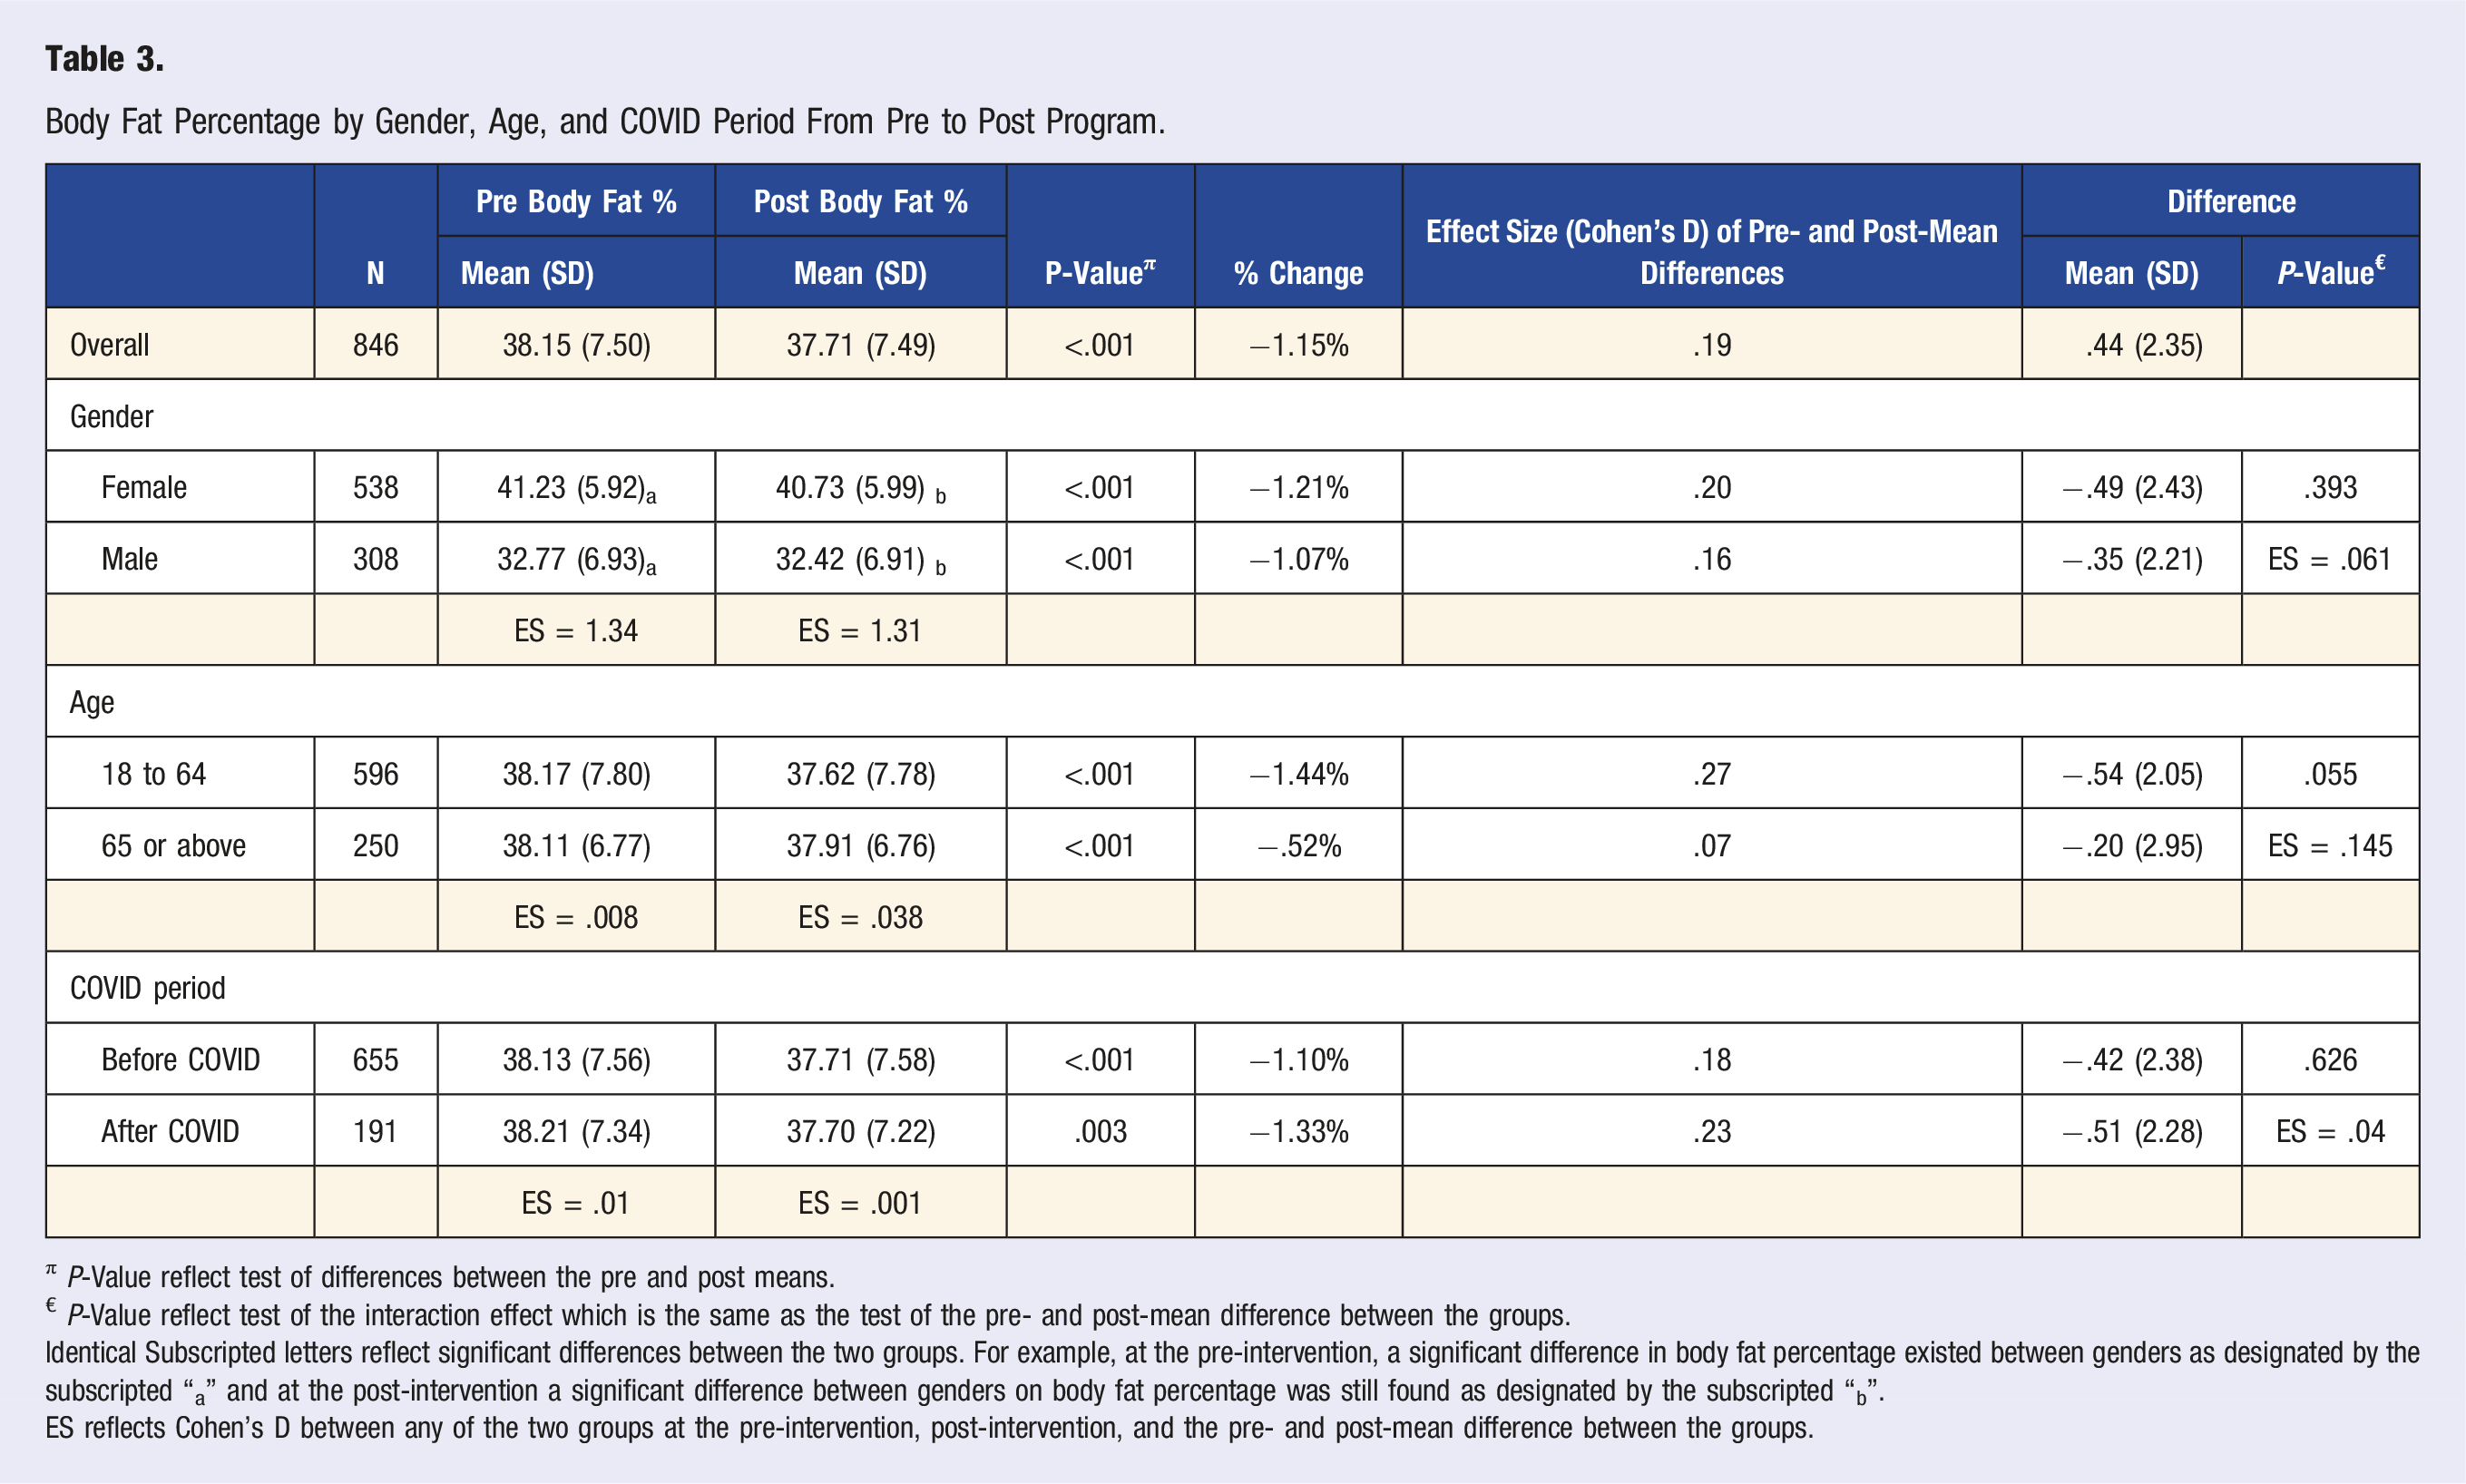
π P-Value reflect test of differences between the pre and post means.
€ P-Value reflect test of the interaction effect which is the same as the test of the pre- and post-mean difference between the groups.
Identical Subscripted letters reflect significant differences between the two groups. For example, at the pre-intervention, a significant difference in body fat percentage existed between genders as designated by the subscripted “a” and at the post-intervention a significant difference between genders on body fat percentage was still found as designated by the subscripted “b”.
ES reflects Cohen’s D between any of the two groups at the pre-intervention, post-intervention, and the pre- and post-mean difference between the groups.
Systolic Blood Pressure (SBP)
Systolic Blood Pressure (mmHg) by Gender, Age, and COVID Period From Pre to Post Program.
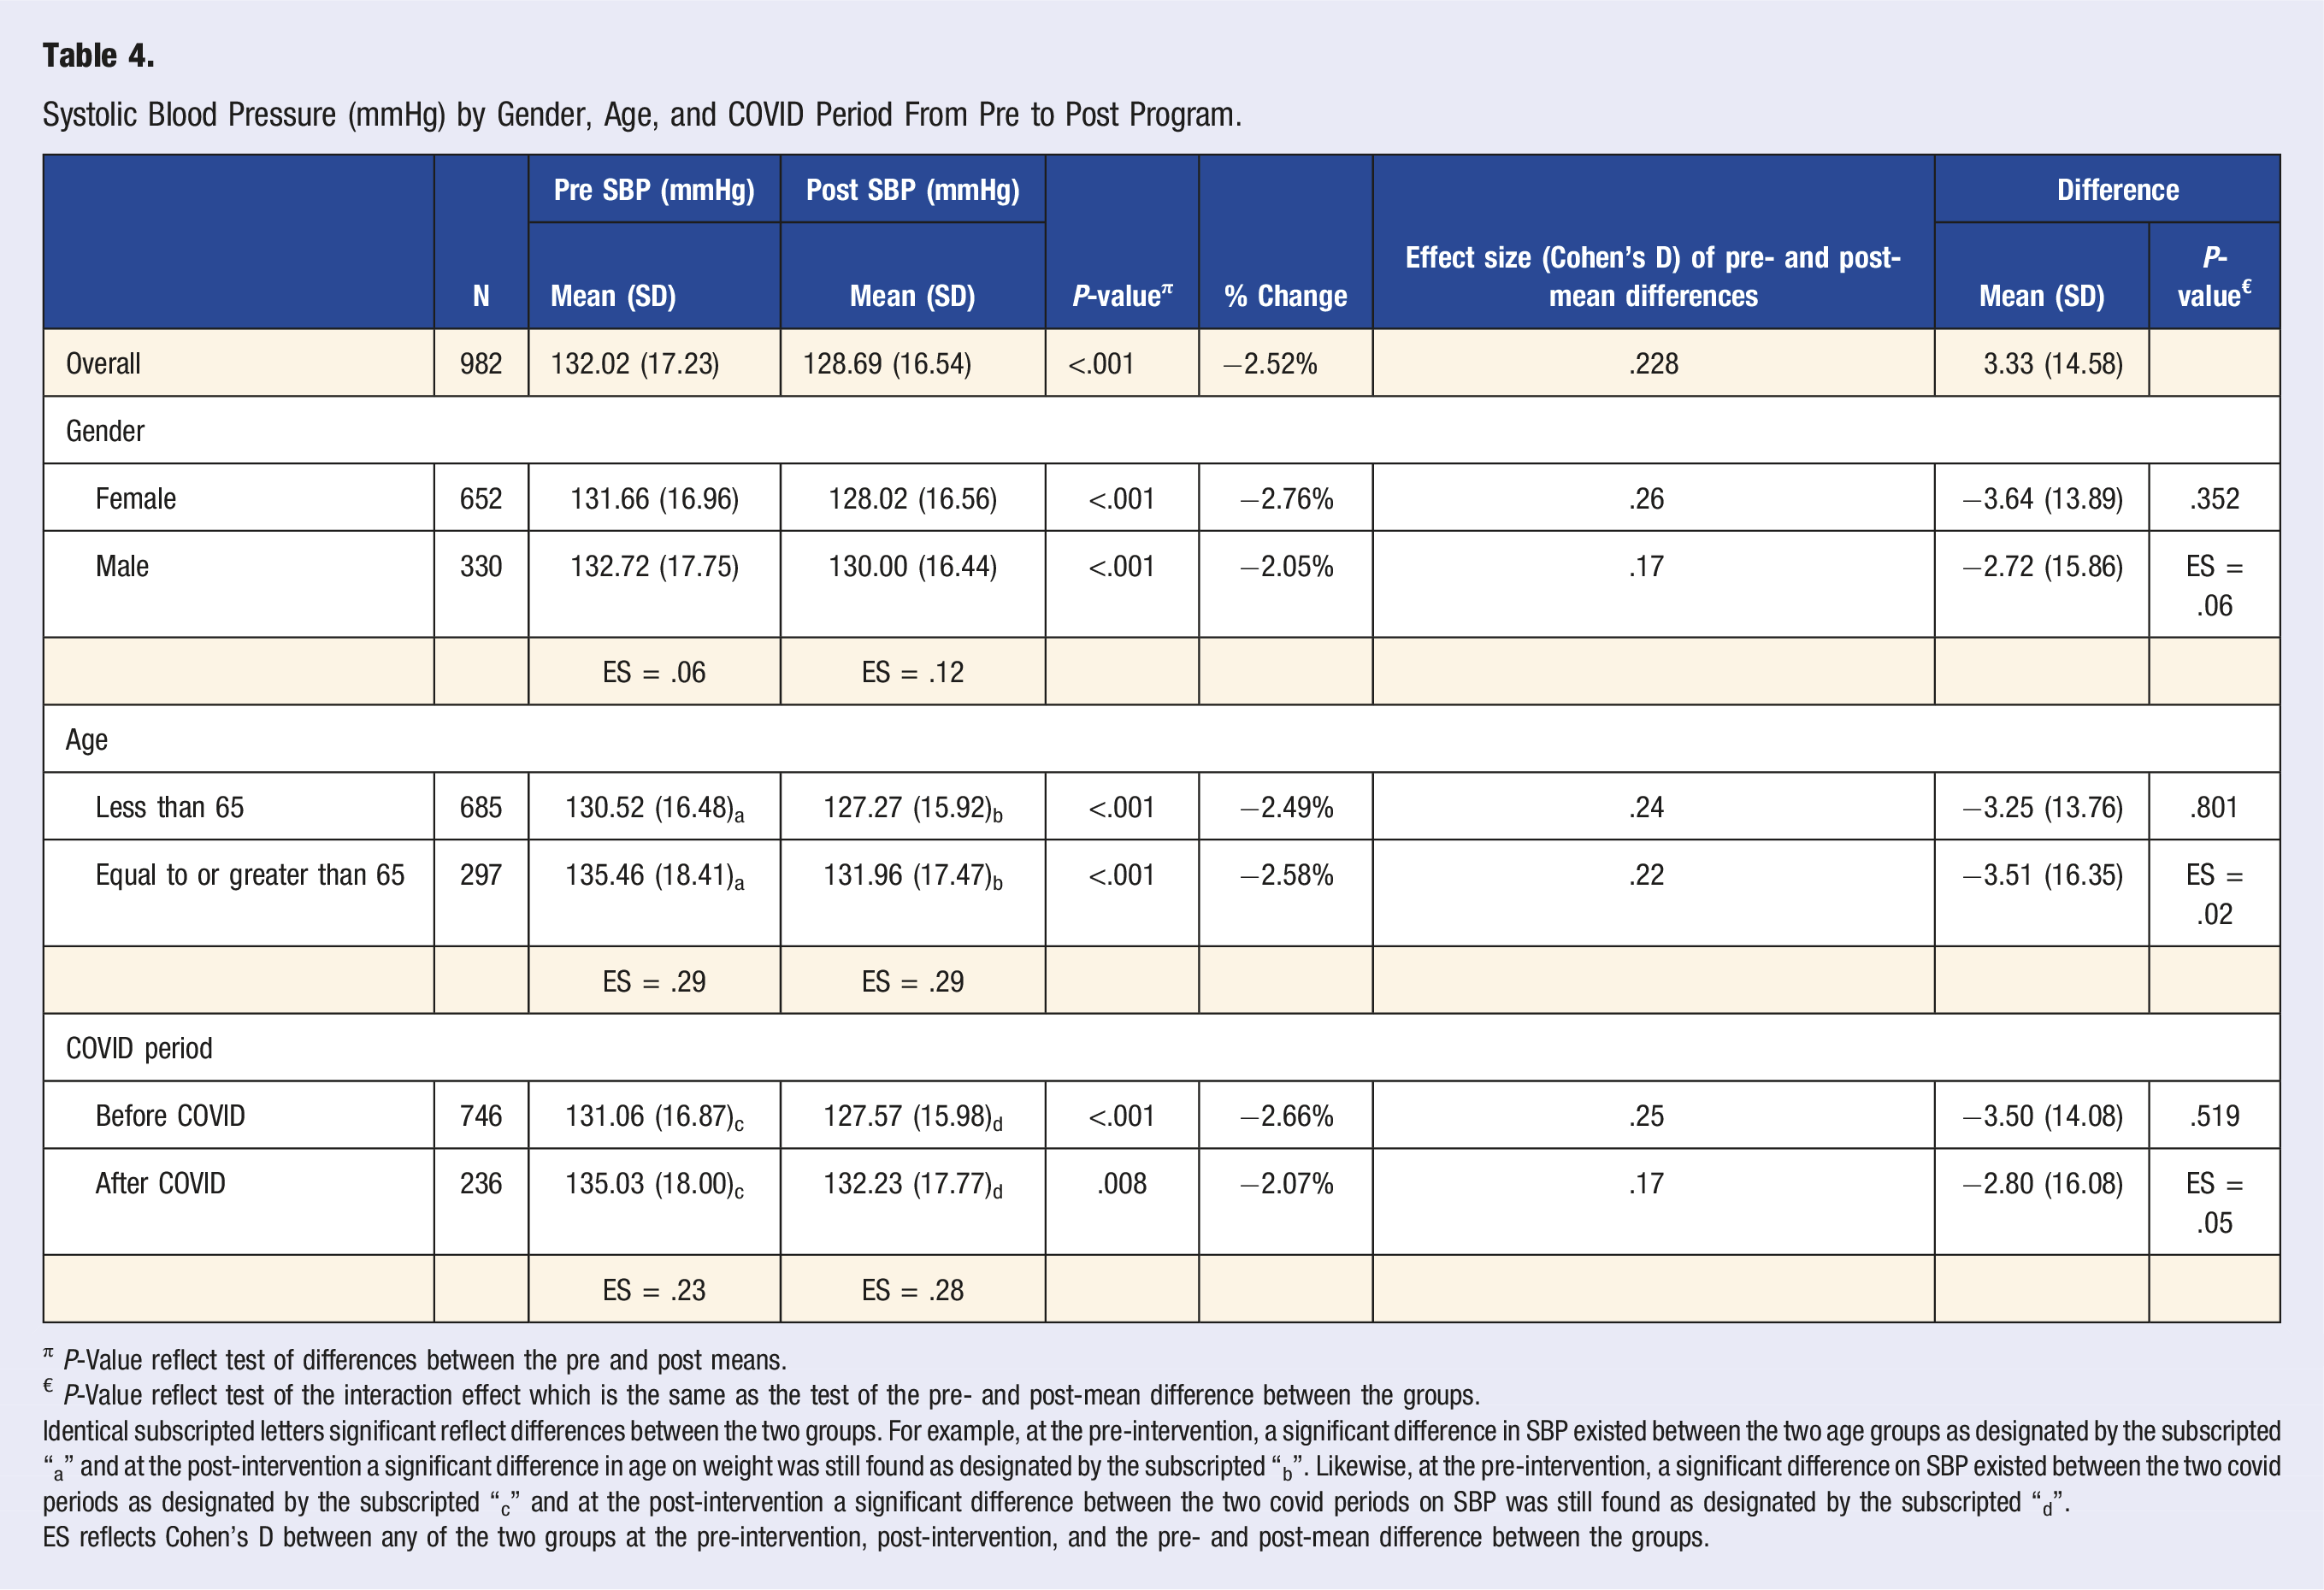
π P-Value reflect test of differences between the pre and post means.
€ P-Value reflect test of the interaction effect which is the same as the test of the pre- and post-mean difference between the groups.
Identical subscripted letters significant reflect differences between the two groups. For example, at the pre-intervention, a significant difference in SBP existed between the two age groups as designated by the subscripted “a” and at the post-intervention a significant difference in age on weight was still found as designated by the subscripted “b”. Likewise, at the pre-intervention, a significant difference on SBP existed between the two covid periods as designated by the subscripted “c” and at the post-intervention a significant difference between the two covid periods on SBP was still found as designated by the subscripted “d”.
ES reflects Cohen’s D between any of the two groups at the pre-intervention, post-intervention, and the pre- and post-mean difference between the groups.
Diastolic Blood Pressure (DBP)
Diastolic Blood Pressure (mmHg) by Gender, Age, and COVID Period From Pre to Post Program.
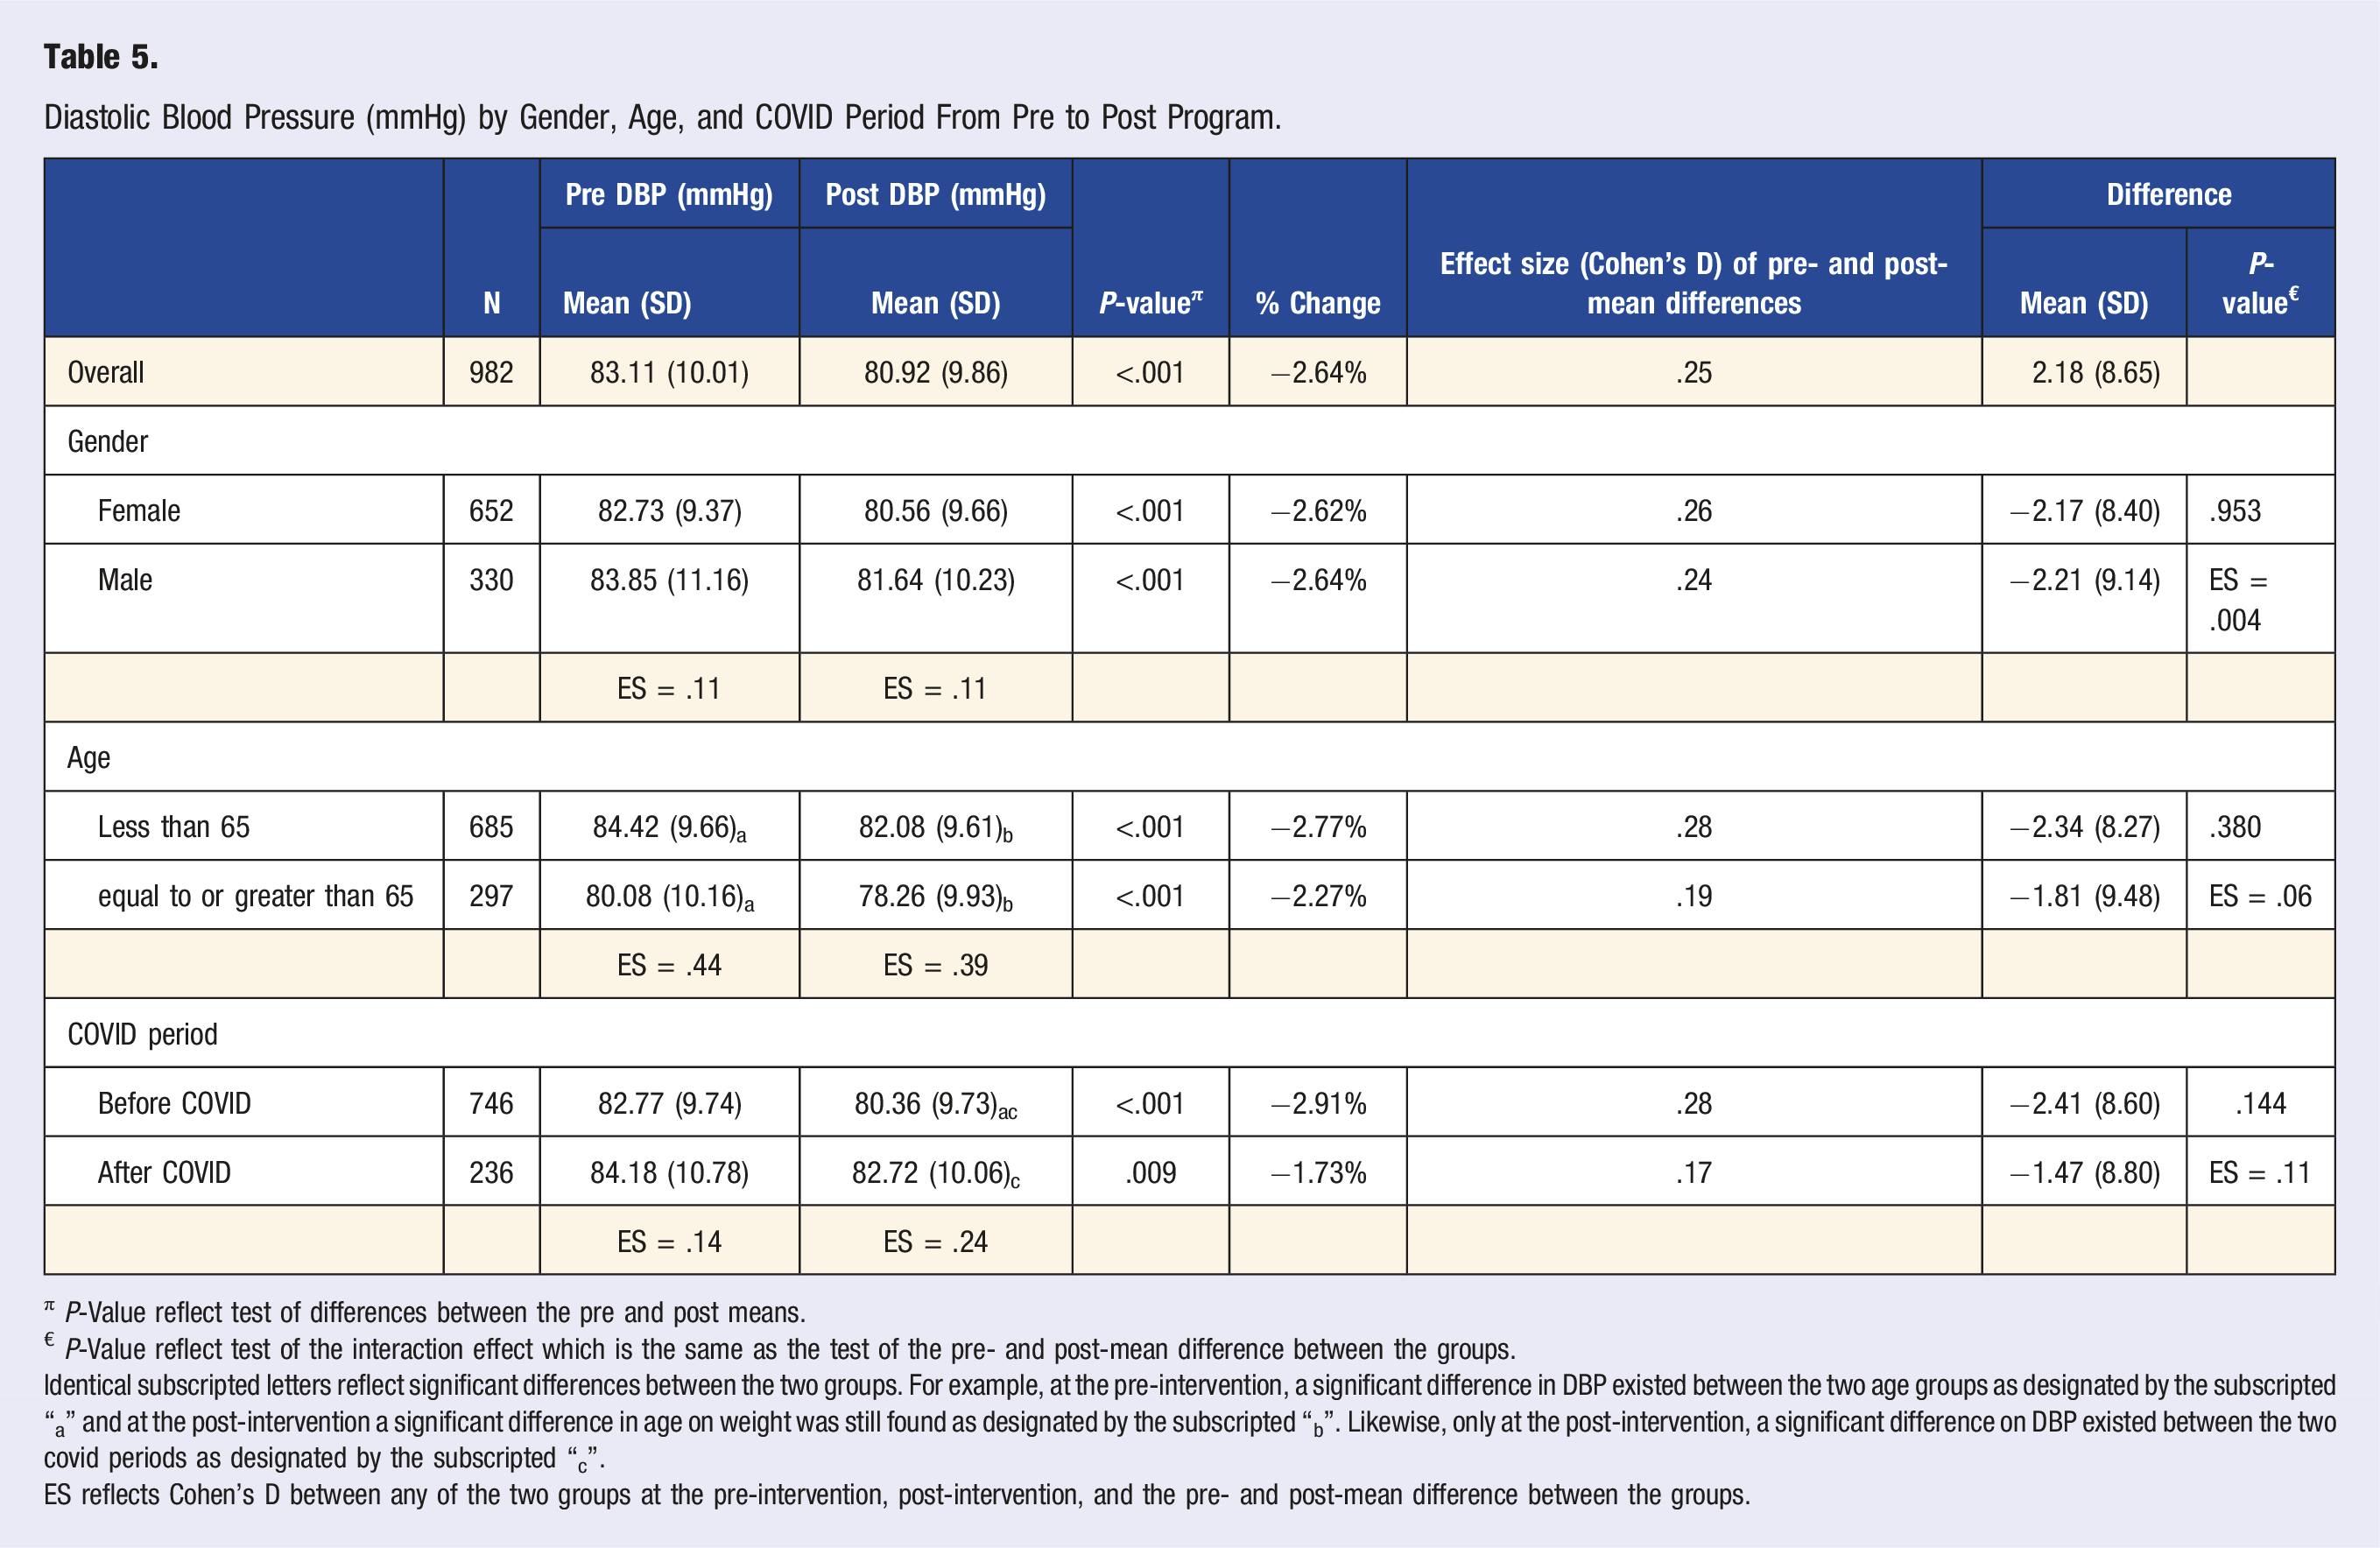
π P-Value reflect test of differences between the pre and post means.
€ P-Value reflect test of the interaction effect which is the same as the test of the pre- and post-mean difference between the groups.
Identical subscripted letters reflect significant differences between the two groups. For example, at the pre-intervention, a significant difference in DBP existed between the two age groups as designated by the subscripted “a” and at the post-intervention a significant difference in age on weight was still found as designated by the subscripted “b”. Likewise, only at the post-intervention, a significant difference on DBP existed between the two covid periods as designated by the subscripted “c”.
ES reflects Cohen’s D between any of the two groups at the pre-intervention, post-intervention, and the pre- and post-mean difference between the groups.
Heart Rate
Heart Rate (bpm) by Gender, Age, and COVID Period From Pre to Post Program.
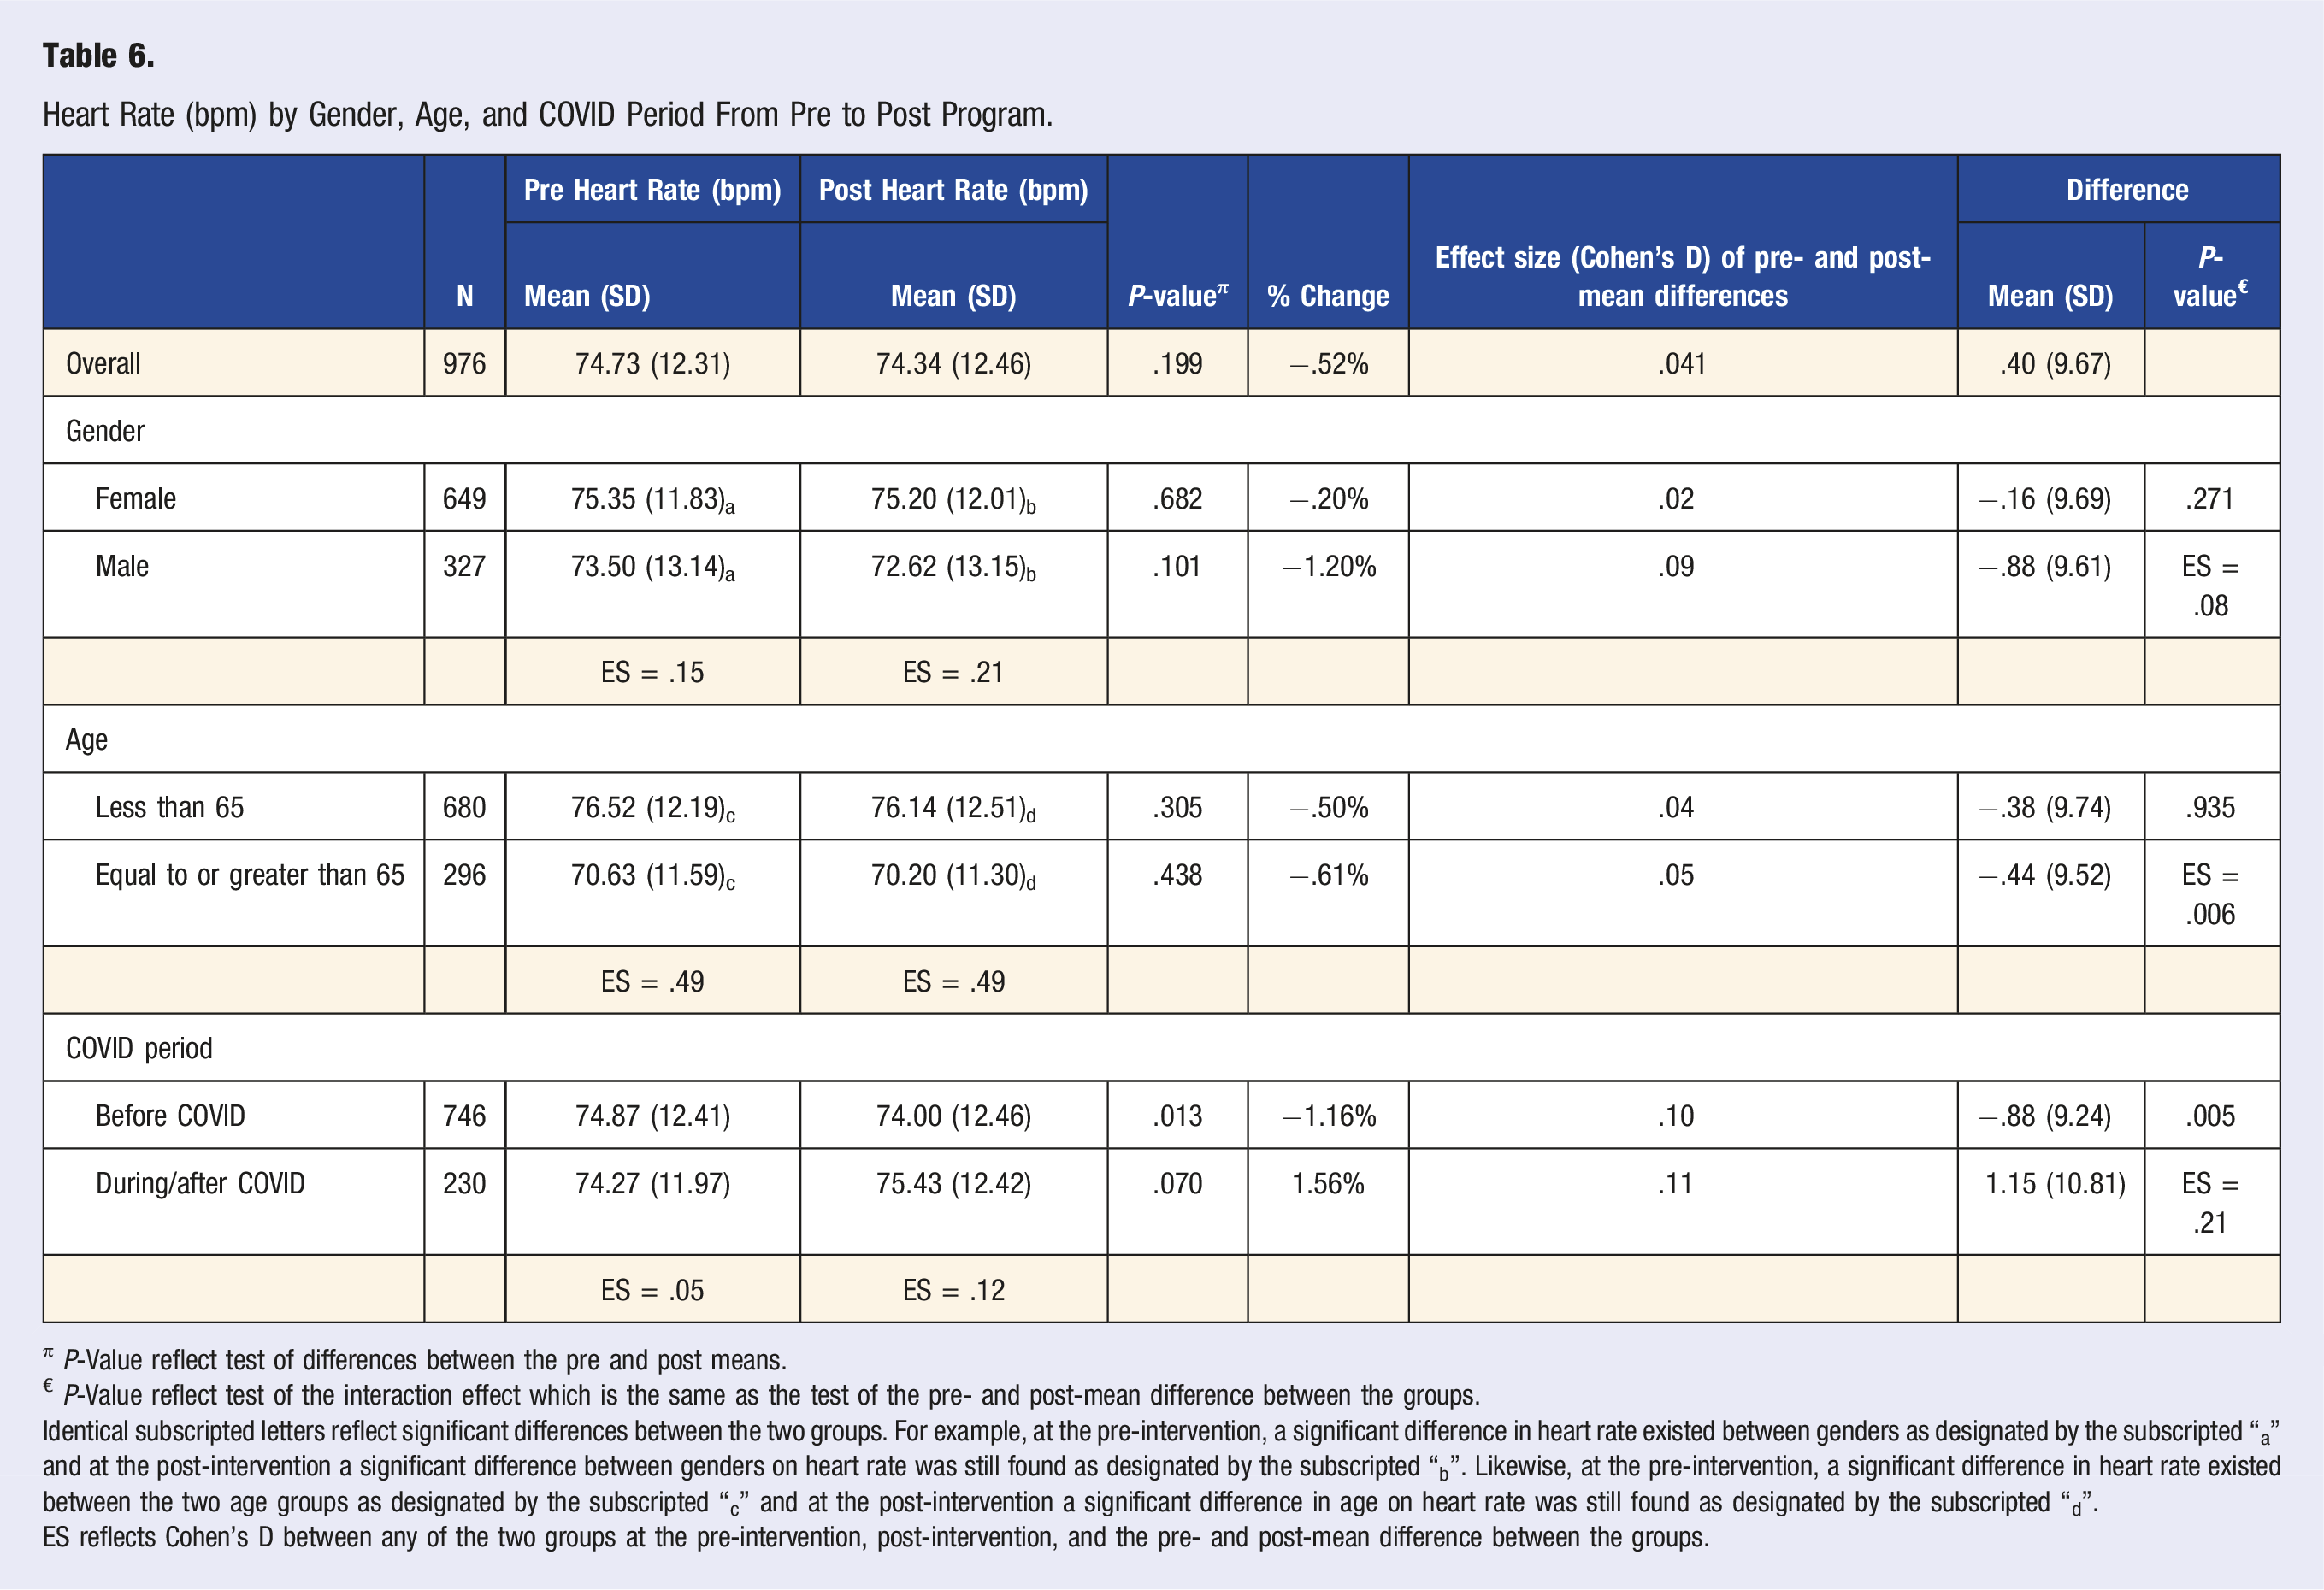
π P-Value reflect test of differences between the pre and post means.
€ P-Value reflect test of the interaction effect which is the same as the test of the pre- and post-mean difference between the groups.
Identical subscripted letters reflect significant differences between the two groups. For example, at the pre-intervention, a significant difference in heart rate existed between genders as designated by the subscripted “a” and at the post-intervention a significant difference between genders on heart rate was still found as designated by the subscripted “b”. Likewise, at the pre-intervention, a significant difference in heart rate existed between the two age groups as designated by the subscripted “c” and at the post-intervention a significant difference in age on heart rate was still found as designated by the subscripted “d”.
ES reflects Cohen’s D between any of the two groups at the pre-intervention, post-intervention, and the pre- and post-mean difference between the groups.
Discussion
Among all participants of the medical fitness referral program evaluated in this study, an average of 2.69 pounds (1.2% of average starting weight) were lost upon completion of the eight-week program. Greater percentage reductions in weight were seen in those 65 years and under (1.4% v .8%, P = .003) potentially due to a higher average starting weight in the younger subgroup. These noted effects, along with the measure of effects as calculated for Cohen’s D being .34 or greater (effects being midway between small and moderate according to Cohen’s criteria), indicate notable improvement in weight loss. While there exists diurnal weight variation,4-6 an averaged weight loss of nearly 1000 participants suggest that there was an association with weight reduction and completion of the exercise program. According to Jensen et al, a 3% weight reduction among overweight and obese individuals has been shown to reduce the risk of developing many chronic diseases. 7 Additionally, according to conclusions drawn from the Diabetes Prevention Program Research Group, a reduction of 7% of body weight over a 24 week period via at least 150 minutes of weekly moderate intensity exercise was a major component in reducing the incidence of developing diabetes among a non-diabetic population by 58%. 8 Of note, simultaneous administration of medications that may promote weight loss was not known for the retrospectively reviewed participants. While the magnitude of weight reduction does not reach the clinical significance defined previously by Jensen et al or that defined by the Diabetes Prevention Program Research Group, the eight-week fitness program should be viewed as a component of the larger multi-dimensional regimen that is required to produce clinically significant weight loss. In this case, dimensions refer to diet, medicines, and most importantly the fourth dimension of time.
Without specific knowledge of what types of exercises (i.e., running/walking vs resistance training) each participant did or how much time they spent during each fitness session, our conclusions drawn are limited. As the requirements to complete the program are simply 3 sessions at the fitness center (documented by creating an entry in a sign in sheet) at least three times a week for eight weeks and only those participants who completed the program were included in this study, it may be suggested that the act of going to the fitness center at least three times a week for eight weeks as part of a loosely guided fitness program is associated with a net loss of 1.2% from their starting body weight.
A metric for exercise independent of weight is body fat percentage, which quantifies the mass of adipose tissue compared to non-adipose tissue including skeletal muscle. Review of literature suggests that exercise, with or without significant weight loss, is associated with an improved cardio-metabolic risk profile leading to more efficient metabolism of sugars and fats, favorable changes in lipoproteins, reduced pro-inflammatory markers, and lowering of blood pressure, among others.9,10 A large meta-analysis of 923,295 found that a 10% increase in body fat contributed to a 11% increase in all-cause mortality for the general adult population. 11 In this study cohort, participants experienced a mean of .44% reduction in body fat percentage upon completion of the program; based on the criteria set by Cohen, Cohen’s D = .19, the effect obtained was negligible for the 8 week program. Though, a lengthening of the program might increase the effect of body fat reduction.
Some participants did not have a recorded body fat percentage reading as they preferred not to know the value or the bio-impedance machine could not accurately measure due to overly high body fat percentages. This does contribute to a bias towards lower body fat percentages, a limitation of this study.
Among all participants in this study, the mean systolic blood pressure was found to have a significant mean difference of −3.33 mmHg (SD = 14.58) with Cohen’s D = .23 (a small, but non-negligible effect), P < .001. According to meta-analyses data of a cohort of participants with a mean age of 65, a reduction of 5 mmHg in systolic blood pressure translated into a reduction of major cardiovascular events by 10%. 12 It is unclear if there is a linear relationship between the magnitude of systolic blood pressure reduction and the magnitude of cardiovascular event risk reduction, or if the reduction in systolic blood pressure must achieve a set threshold of 5 mmHg before a cardiovascular risk reduction is observed. Notwithstanding, the available literature suggests that a combination approach with exercise plus medical management and diet counseling may realistically achieve a systolic blood pressure reduction of at least 5 mmHg. 13
Regarding the diastolic blood pressure, the mean reduction among all participants from pre-program assessment to post-program assessment was −2.18 (SD = 8.65) with Cohen’s D = .25 (a small, but non-negligible effect), P < .001. A retrospective examination of an amalgamated cohort of white men and women, including participants of the Framingham study, by Cook et al. determined that a 2 mmHg reduction in the diastolic blood pressure of the population mean resulted in a 17% decrease in hypertension prevalence, a 6% risk reduction in coronary heart disease events, and a 15% risk reduction in stroke and TIA events. 14 So, while the absolute magnitude of the mean study population’s blood pressure reduction is small, even a small reduction in either systolic or diastolic blood pressure, as shown by literature, has a measurable benefit for the average health of the population. It is worth noting that any adjustments to participants’ anti-hypertensive medication regimen by their physicians are unknown during the program participation time period.
In the literature, it has been suggested that lower resting heart rates generally correlate with health and longevity.15,16 However, results from this study did not demonstrate any significant reduction or increase in average heart rate among all participants. In one sub-population, there was a small significant decrease in heart rate of .88 beats per minute for participants that completed the program prior to COVID-19. The general lack of significant differences may be attributed to the wide variation of heart rate depending on the acute physical and emotional milieu of the participant at the time of assessment. The heart rate variability, or the variation in time between two heart beats, may be used as an indirect measure to assess the health of the cardiovascular system. 17 While heart rate variability was not measured during assessments, the standard deviation, a reflection of variation on a cohort level, increased in the post-program heart rate compared to the pre-program heart rate. Though one cannot conclude that the participants’ individual heart rate variability increased after completion of the program, it does suggest that the average participant’s heart rate is expected to fall into a wider range after the program than before the program.
Due to the retrospective nature of this study, there was no control regarding the nature of each participant’s experience of the medical fitness referral program; participants likely had a wide range of time spent during each session and the activities that they engaged in. Though participants completed the same program, they may have had different experiences. Additionally, confounding variables were not able to be controlled for in this retrospective review, and it is unclear if the progress made upon completion of the program was attributed to the program or something else, such as the initiation of care from a medical doctor, who provided the referral to the medical fitness referral program to begin with. Participants of the medical fitness referral program also were influenced by the Hawthorne effect, as these participants were assessed by staff members before and after the program, and their progress was tracked closely. Regarding body fat percentage, there was a skew towards lower body fat percentages as the bio-impedance instrument used for body fat percentage testing was unable to read body fat percentages above a certain threshold, near 50%. Finally, the distribution within demographic subcategories was not always balanced. For example, the number of female participants is almost twice the magnitude of the number of male participants; this limits generalizability. Further work to quantify the impact of similar programs may require a dedicated control population matched to a cohort of program participants. Due to limitations of this study, specific conclusions regarding causation cannot be drawn.
In this limited analysis, participants of the medical fitness referral program from August 2015 to December 2022 were seen to have statistically significant reductions in the delineated biometric parameters. Though the magnitude of reduction is likely not clinically significant, it demonstrates progress. Future studies are needed to determine the clinical impact of this program when part of a multi-dimensional approach.
Footnotes
Acknowledgments
Jason Anderson and Matthew Casebolt for logistical support and coordination in data collection. Cody Jackson, Travis Cornelius, and Heather Durall for gathering participant assessment forms.
Declaration of conflicting interests
The author(s) declared no potential conflicts of interest with respect to the research, authorship, and/or publication of this article.
Funding
The author(s) received no financial support for the research, authorship, and/or publication of this article.