
Abstract
The purpose of this study was to examine the effects of exercise on cardiovascular disease (CVD) risk factors in children and adolescents with obesity. Randomized controlled trials (RCTs) of exercise ≥4 weeks in children and adolescents with obesity were included if one or more CVD risk factors were included as an outcome. Studies were retrieved by searching 7 electronic databases, cross-referencing, and expert review. Data were pooled using the inverse-variance heterogeneity (IVhet) model and strength of evidence was assessed using the Grading of Recommendations Assessment, Development and Evaluation (GRADE) instrument. Thirty-nine studies representing 1548 participants (847 exercise, 701 control) met the inclusion criteria. Aerobic exercise improved 10 of 12 (83.3%) outcomes (P < .05 for all) while combined aerobic and strength training improved 5 of 8 (62.5%) outcomes (P < .05 for all). The strength of evidence ranged from “very low” to “moderate.” It was concluded that aerobic exercise, as well as combined aerobic and strength training, is associated with improvements in multiple CVD risk factors among children and adolescents with obesity. However, the generally low strength of evidence suggests a need for future well-designed and conducted RCTs on the effects of exercise, especially strength training, in children and adolescents with obesity.
‘Cardiovascular disease (CVD) risk factors represent a major problem in youth with overweight and obesity, especially those with obesity.’
Overweight and obesity are major public health problems both in the United States and globally,1,2 with obesity considered a disease since 2013. 3 Between the years 1980 and 2013, the worldwide prevalence of children and adolescents 5 to 19 years of age with overweight and obesity increased from 16.9% to 23.8% in boys and from 16.2% to 22.6% in girls from developed countries. 1 For developing countries, increases were 8.1% to 12.9% in boys and 8.4% to 13.4% in girls. 1 Viewed from an absolute perspective, the World Health Organization (WHO) reported that 41 million children under the age of 5 and more than 340 million children and adolescents aged 5 to 19 had overweight or obesity in 2016. 4 The prevalence of children and adolescents with overweight and obesity is especially problematic in the United States, increasing dramatically over approximately the past 5 decades. When compared to the years 1971 to 1974 and 2015 to 2016, the prevalence of US children and adolescents 2 to 19 years with overweight (body mass index [BMI] ≥ 85th to <95th percentile), obesity (BMI ≥ 95th percentile), and severe obesity (BMI ≥ 120th percentile) increased from 10.2% to 16.6%, 5.2% to 18.5%, and 1.0% to 5.6%, respectively. 5 These increases were similar for both boys and girls. 5 Finally, using National Health and Nutrition Examination Survey (NHANES) data for the years 1999 to 2016, a positive linear trend for all categories of overweight and obesity in children 2 to 19 years of age was observed, especially among adolescents. 6 In addition, a significant increase in severe obesity among children 2 to 5 years of age was observed. 6
Cardiovascular disease (CVD) risk factors represent a major problem in youth with overweight and obesity, especially those with obesity. For example, while the prevalence of high blood pressure (BP) in US youth decreased between 2001 and 2016, youth are still at risk, especially for those with obesity. 7 Based on BMI percentile cutpoints, the prevalence of hypertension has been shown to be greater in youth with obesity compared to their healthy weight counterparts. Based on 2013 to 2016 data from the NHANES, the percentage of youth 12 to 19 years of age classified as having hypertension was reported to be 1.9% for those with a healthy weight, 1.9% for those who were overweight, and 9.4% for those who were obese, including those with severe obesity. 7 When limited to those with severe obesity, the reported prevalence was 14.7%. 7 Thus, when compared to healthy weight children and adolescents, those with obesity were 5 times more likely to have hypertension while those with severe obesity were 7 times more likely to be hypertense. Finally, when compared to normal weight children and adolescents 5 to 15 years of age, a systematic review with meta-analysis found increasing levels of resting systolic blood pressure (SBP) and diastolic blood pressure (DBP) in those with overweight or obesity, especially those with obesity. 8 These findings suggest that youth with obesity are at the greatest risk of having elevated levels of resting SBP and DBP.
Abnormal cholesterol levels are also more prevalent in youth with overweight and obesity and also appear to be especially prominent in those with obesity. Based on 2011 to 2014 NHANES data in children and adolescents 6 to 19 years of age, the prevalence of total cholesterol (TC) ≥200 mg/dL was 6.8% for those who were normal weight, 6.9% for those who were overweight, and 11.6% for those classified as obese. 9 For high-density lipoprotein cholesterol (HDL-C) <40 mg/dL, prevalence rates were 6.8%, 14.8%, and 33.2%, respectively, for healthy weight, overweight, and obesity, 9 while non-HDL values (non-HDL-C) ≥145 mg/dL were 5.7%, 9.7%, and 16.7%. 9 Collectively, the prevalence of either high TC, low HDL-C, or high non-HDL-C was 13.8% for those who were normal weight, 22.3% for those with overweight, and 43.3% for those with obesity. 9 Thus, when compared to those with a healthy weight, those classified as overweight or obese were approximately 1.6 and 3.1 times more likely to have at least one abnormal cholesterol value. Another study, a systematic review with meta-analysis, found that when compared to normal weight children and adolescents, increased levels of TC, low-density lipoprotein cholesterol (LDL-C), and triglycerides (TG), as well as decreased levels of HDL-C were observed among those with overweight and obesity, especially among those with obesity. 8 Thus, similar to resting SBP and DBP blood pressure, children with obesity seem to be at the greatest risk of having abnormal cholesterol levels.
Elevated levels of fasting glucose (FG) and insulin (FI) also appear to be problematic in youth with overweight and obesity, especially those with obesity. For example, a meta-analysis of 5- to 15-year-old children and adolescents found increasing levels of FG and FI among those with overweight and obesity, especially those with obesity. 8 These findings in youth with obesity are similar to those observed for resting BP as well as lipids and lipoproteins.7-9 Most notably, a systematic review concluded that children and adolescents with overweight and obesity are not only at an increased risk for premature morbidity during adulthood but also premature mortality. 10
A cornerstone in the treatment of youth with overweight and obesity is exercise. However, and not surprisingly, both self-report and objective measures have shown that recommended levels of physical activity in children and adolescents with overweight and obesity are lacking. For example, using the US Youth Risk Behavior Surveillance System (YRBSS) data analysis tool and 2017 YRBSS data available at https://www.cdc.gov/healthyschools/data/yrbss.htm#null, the authors of this review estimated that 63.8% of high school females and 40.7% of high school males with overweight were not physically active at least 60 minutes per day on 5 or more of the past 7 days. For high schoolers with obesity, 70.7% of females and 52.0% of males were not physically active at least 60 minutes per day on 5 or more of the past 7 days (unpublished results). In addition, using NHANES data, Chung et al. examined accelerometer-based physical activity according to BMI percentiles derived from measured height and weight in 6- to 17-year-old males and females. 11 Overall, there was a greater decrease in meeting physical activity recommendations with (1) older age, (2) sex (females vs males), and (3) those with obesity when compared to those who were either at a healthy weight or overweight. 11 Finally, in a systematic review of 48 studies that objectively assessed habitual physical activity in children and adolescents, it was concluded that higher levels of habitual physical activity were protective against child and adolescent adiposity. 12 Collectively, these findings suggest that youth with obesity exhibit the lowest levels of physical activity.
There is evidence to suggest that CVD risk factors track into adulthood. For example, a systematic review with meta-analysis of 23 studies found a positive association between children with obesity and resting SBP, DBP, and TG, as well as an inverse association with HDL in adulthood. 13 However, for those studies that adjusted for adult BMI, associations were reversed, suggesting that adult BMI may be a potential mediator. 13 Another recent population-based cohort study in more than 1 million male adolescents found that low levels of cardiorespiratory fitness and obesity were associated with later risk of chronic disability due to CVD. 14 The authors, as well as an accompanying editorial, suggested that preventive actions should begin at young ages and include the promotion of cardiorespiratory fitness and healthy body weight.14,15 Finally, and most notably, obese youth have been shown to be at the greatest risk for premature morbidity and mortality throughout their lifetime. 16 These as well as a number of other negative outcomes across the lifespan in youth with obesity have been discussed in detail elsewhere. 17
Exercise has been deemed as important in the treatment of obesity in children and adolescents. 18 However, despite numerous and conflicting results of randomized controlled trials (RCTs) focused on the effects of exercise (aerobic, strength training, or both) on CVD risk factors in youth with obesity,19-58 a previous systematic review of previous systematic reviews with meta-analysis limited to RCTs of exercise, 59 and at least 17 original systematic reviews with meta-analysis limited to RCTs of exercise, have included both overweight and obese versus just obese youth.60-73 One systematic review with meta-analysis of 9 randomized controlled exercise trials limited to obese children did report small standardized mean difference reductions, overall, in resting SBP and DBP 74 while another which also included 9 studies reported similarly small reductions in FG, FI, and percent body fat (BF%) as a result of aerobic exercise. 75 However, both meta-analyses were based on pooling models that have been shown to be less robust than currently available models.76,77 Collectively, the above-mentioned factors are problematic because they prevent one from fully understanding the true magnitude of effect that exercise may have on CVD risk factors in those who are most vulnerable, that is, youth with obesity. Consequently, this inhibits clinicians, health care providers, and others from providing optimal support and treatment recommendations to this high-risk group. Thus, given (1) the prevalence of youth with obesity,1,2,4,5 (2) the deleterious consequences of youth with obesity and CVD risk factors,7-9,16 (3) the conflicting results of previous RCTs on exercise and CVD risk factors in youth with obesity,19-58 and (4) the lack of focus of previous systematic reviews of previous meta-analyses as well as original systematic reviews with meta-analysis on exercise and multiple CVD risk factors in youth with obesity,59-73 the purpose of this study was to conduct a systematic review and aggregate data meta-analysis of RCTs to determine the effects of exercise (aerobic, strength training, or both) on CVD risk factors in youth with obesity.
Methods
Overview
This study adhered to the guidelines from the Preferred Reporting Items for Systematic Reviews and Meta-Analysis (PRISMA) statement for aggregate data meta-analyses of health care interventions. 78 In addition, the a priori protocol for this meta-analysis was registered in PROSPERO (#CRD42020179527)79-81 but not published in a peer-reviewed journal.
Eligibility Criteria
The a priori inclusion criteria for this aggregate data meta-analysis were as follows: (1) participant-level RCTs with a comparative control group (no intervention, usual care, attention control, wait-list control, placebo), (2) exercise-focused intervention (aerobic, strength training, both), (3) studies lasting ≥4 weeks, (4) male and/or female children and adolescents 5 to 18 years of age, (5) participants considered obese, defined as a BMI ≥ 95th percentile or some other comparable criteria, (6) studies published in any language up to March 31, 2020, (7) data available for one or more of the following primary outcomes: measures of adiposity (BMI in kg/m2, BMI-z-score, BMI percentile, fat mass [FM], BF%, waist circumference [WC]), blood pressure (resting SBP and DBP), lipids and lipoproteins (TC, HDL-C, LDL-C, TG), and markers of diabetes (FG, FI, glycated hemoglobin [HbA1c]). Studies were limited to RCTs because it is the only way to control for confounders that are not known or measured as well as the observation that non-RCTs tend to overestimate the effects of health care interventions.82,83 For the purpose of this meta-analysis, exercise, aerobic exercise, and strength training were defined according to the 2018 Physical Activity Guidelines for Americans. 18 Four weeks was chosen as the lower cut point for intervention length based on previous research demonstrating improvements in selected CVD risk factors over this period of time in 11-year olds. 84 There was no maximum cut point for intervention length. Participants were limited to obese children and adolescents, defined as either (1) ≥95th percentile based on BMI or BF%,85-87 (2) a BMI >2 standard deviations above the WHO growth standard median (equivalent to a BMI of 30 kg/m2 at 19 years of age) for ages 5 to 19, 4 or (3) international BMI cut points according to age and sex for obesity in children ages 2 to 18. 88 It is important to note that while a BMI ≥25 kg/m2 but <30 kg/m2 is generally considered to represent overweight versus obesity in adults, many children and adolescents in this range and lower would be classified as obese, depending on age, sex, and country. 88 The focus was on obesity because it has been shown that this population is at the greatest risk for premature morbidity and mortality throughout their lifetime.7-9,16 While some research has suggested that studies yielding statistically significant and positive results are more likely to be published in English-language versus non-English language journals, 89 other research has shown this to not be the case.90,91 However, to be conservative, studies from both English and non-English-language articles were included, assuming there was an English-language abstract, with the latter translated into English by the second author using the freely available web-based Babelfish and Bing translators as well as the translation function in Google Documents. The primary outcomes chosen were based on their well-established association with CVD risk. 17 Finally, multiple studies that included the same participants were handled by only including the originally published study.
Information Sources
Information sources included (1) the authors’ existing, large, and broad EndNote (version X8) database of randomized trials on the effects of exercise (aerobic, strength training, both) in overweight and obese children and adolescents, 92 (2) conducting an updated search of 7 electronic databases, (3) cross-referencing from retrieved studies, and (4) expert review. A detailed description of the existing EndNote database has been previously described.63,93 Briefly, this original database was derived by (1) searching 7 electronic databases, (2) cross-referencing from retrieved studies, and (3) expert review.63,93 The database included published and unpublished (dissertations and theses) studies in any language, assuming an English language abstract was available, between January 1, 1973, and August 22, 2018. The year 1973 was chosen as the start date based on preliminary searching in which this was the earliest citation identified. 94 A post hoc decision was made to use the previously existing EndNote database for 2 reasons. First, this database was based on broader criteria focused on randomized trials as well as RCTs of exercise (aerobic, strength, training, concurrent aerobic and strength training) in both overweight and obese children and adolescents. Second, the investigative team did not want to duplicate effort.
In addition to the EndNote database, an updated search for studies available between August 23, 2018, and March 31, 2020, was conducted. This was accomplished by searching 7 electronic databases: (1) PubMed, (2) Web of Science, (3) Cochrane Central Register of Controlled Clinical Trials, (4) Cumulative Index to Nursing and Allied Health Literature, (5) SPORTDiscus, (6) Scopus, and (7) ProQuest Theses and Dissertations. Embase was not searched because Scopus has been reported to provide 100% coverage of Embase. 95 In addition, Embase was not readily available to the authors. Key words or forms of key words that were used and adapted to the unique characteristics of each database included the following: exercise, physical activity, physical fitness, children, adolescents, boys, girls, obesity, randomized controlled trials. For both the existing and new database searches, specific outcomes were not included in search strings because of concern about missing potentially eligible studies. All database searches, both existing and new, were conducted by the second author, with oversight from the first author. An example of the search strategy for one of the updated searches (PubMed) can be found in Supplementary File 1 (available online). For electronic database searches, the second author conducted separate searches in each database, imported them as separate files into Endnote X8, and then merged them into one large Endnote X8 file. The second author then removed duplicates both electronically and manually into another file, exclusive of duplicates. In addition to electronic database searches, cross-referencing from retrieved studies and previous reviews were performed as well as expert review by the third author (RP).
Study Screening
All studies were screened by the first 2 authors (GK and KK), independent of each other. The full report for each citation was retrieved for all titles and abstracts that appeared to meet the eligibility criteria as well as those where uncertainty existed. Multiple reports for the same study were handled by only including one of the studies. Blinding of the 2 screeners to journal titles, study authors, or institutions of the authors was not used during either the screening or data abstraction processes given previous research demonstrating neither a clinically nor statistically significant effect on results. 96 Major reasons for the exclusion of studies were based on PICOS criteria: (1) inappropriate population, (2) inappropriate intervention, (3) inappropriate comparison(s), (4) inappropriate outcome(s), (5) inappropriate study design and/or setting, (6) other. 78 Upon completion of initial screening, the first and second authors (GK and KK) met and reviewed their selections for agreement. Cohen’s kappa statistic (κ) was used to assess initial interselection agreement before resolving discrepancies. 97 Any discrepancies were resolved by discussion. If an agreement could not be reached, the third author (RP) provided a recommendation. Upon agreement of what studies to include, the second author then searched Web of Science to determine if any had been retracted. If so, they were excluded from the current study. 98 Based on the final number of studies to include, the overall precision of the searches was calculated by dividing the number of included studies by the total number of studies screened after removing duplicates. 99 The number needed-to-read (NNR) was then calculated as the reciprocal of the precision. 99 Both the existing and new database files were then merged into one overall file using version X8 of Endnote. 92
Data Abstraction
Microsoft Excel (version 2016) was used to develop a comprehensive electronic workbook with multiple worksheets that defined the coding process for each of the variables coded from each study. The workbook was created, pilot-tested, and finalized by the authors. The major groups of variables coded were (1) study characteristics (author, journal, year of publication, etc.), (2) participant characteristics (age, sex, height, body weight [BW], etc.), (3) intervention characteristics (length, frequency, intensity, mode, etc.), and (4) primary and secondary outcome data (sample sizes, baseline and postexercise means and standard deviations, method of assessment, etc.). Missing data for primary outcomes were requested from the corresponding author via electronic mail. To avoid data abstraction bias, the first 2 authors (GK and KK) used separate workbooks to independently code (dual coding) each item from every study to ensure accuracy and consistency. The authors then met to review their selections. Interrater agreement prior to resolving discrepancies was assessed using Cohen’s κ statistic. 97 Any disagreement in the items coded was discussed until mutual agreement was reached. If agreement could not be reached, the third author (RP) provided a recommendation. Based on Cohen’s κ statistic, the overall agreement rate prior to correcting disagreements was 0.96.
Outcomes and Prioritization
The primary a priori outcomes included measures of adiposity (BMI in kg/m2, BMI-z-score, BMI percentile, FM, BF%, WC), blood pressure (resting SBP and DBP), lipids and lipoproteins (TC, HDL-C, LDL-C, TG), and markers of diabetes (FG, FI, HbA1c). Secondary outcomes included BW, fat-free mass (FFM), energy intake (EI), physical activity (PA) levels, relative maximum oxygen consumption (VO2max in mL·kg·min−1), and muscular strength. Post hoc, a decision was made to include the number of dropouts in the exercise and control groups as an outcome. Meta-analysis was conducted if there were at least 5 effect sizes for each outcome given that error estimation has been shown to deteriorate with less than 5 effect sizes for the inverse variance heterogeneity (IVhet) pooling model used in the current study. 76
Risk of Bias Assessment in Individual Studies
Risk of bias for each study was assessed using the recently revised Cochrane Risk of Bias instrument for RCTs (RoB 2). 100 Using one or more signaling questions, the RoB 2 instrument assesses risk of bias in 5 distinct domains: (1) bias arising from the randomization process, (2) bias due to deviations from intended interventions, (3) bias due to missing outcome data, (4) bias in measurement of the outcome, and (5) bias in selection of the reported result. 100 Based on signaling questions, each domain is assessed as either “low risk,” “high risk,” or “some concerns.” 100 Based on responses to each domain, the overall risk of bias for each study is then assessed as either “low risk,” “high risk,” or “some concerns.” 100 We chose to use this instrument over the various study quality instruments, including those focused on exercise intervention studies,101,102 given the difficulty of the latter in differentiating between the quality of reporting and the quality in the conduct of a study. 100 Risk of bias was assessed by the first 2 authors (GK, KK), independent of each other. They then met and reviewed their selections for agreement. If agreement could not be reached, the third author (RP) rendered a decision. Using Cohen’s κ statistic, the overall agreement rate prior to correcting discrepant items was 0.89.
Data Synthesis
Baseline Characteristics
Differences in initial characteristics (age, height, BW, etc.) for each study were calculated by taking the difference in baseline values between the exercise and control groups and pooling their standard deviations. For studies that included multiple exercise intervention groups, the control group sample size was divided by the number of intervention groups so as to avoid overcounting. 103 The IVhet model, a model that has been shown to be more robust than the traditional random-effects model,76,104,105 was then used to pool results. A 2-tailed z-α value ≤.05 and nonoverlapping 95% confidence intervals (CIs) were considered to represent significant between-group (exercise vs control) differences.
Calculation of Effect Sizes for Primary and Secondary Outcomes
With the exception of muscular strength and dropouts, effect sizes from each study and each outcome were calculated using the original metric. These were calculated as the change outcome difference in the exercise group minus the change outcome difference in the control group. Variances from each study were calculated from pooled change outcome standard deviations in the exercise and control groups. If change score standard deviations were not available, they were estimated from 95% CIs for change outcomes, 95% CIs for treatment effects, or pre and post standard deviation values according to procedures developed by Follmann et al. 106 Studies that reported data using metrics which could easily be converted between each other, for example, millimoles to milligrams per deciliter for TC, were converted into the same metric. For those studies that included multiple exercise intervention groups, the control group sample size was divided by the number of intervention groups so as to avoid overcounting. 103
Given the different metrics used to assess muscular strength across studies and the inability to convert between all of them, the a priori plan was to use the standardized mean difference effect size, adjusted for small sample bias (Hedge’s g) as the common metric. 107 However, since none of the exercise groups (aerobic, strength, combined aerobic and strength) included at least 5 effect sizes, this analysis was not conducted. For dropout comparisons in the exercise and control groups, the odds ratio (OR) was the metric of choice.
Pooling of Effect Sizes for Primary and Secondary Outcomes
Changes in all outcomes were pooled according to type of exercise (aerobic, strength, combined aerobic and strength) using the IVhet model, a quasi-likelihood model.76,104,105 Two-tailed z-α values ≤0.05 and nonoverlapping 95% CIs were considered statistically significant, with a focus more on CIs.108,109 Post hoc, a decision was made to also calculate 95% prediction intervals.110,111 Prediction intervals may best be described as what result one might expect to find in an outcome if a new RCT was conducted.
Heterogeneity and inconsistency for pooled outcomes were estimated using the Q 112 and I2 statistics, 113 respectively. An α level <.10 for Q was considered to represent statistically significant heterogeneity. 113 Higher values for I2, a relative between-studies measure, represent the percentage of between-studies variance accounted for by true effects versus sampling error. 113 I2 values were categorized as very low (<25%), low (25% to <50%), moderate (50% to <75%), or large (≥75%). 113 Absolute between-study heterogeneity was calculated using tau squared (τ 2 ). In addition, influence analysis was conducted with each study deleted from the model once to examine the influence of each study on the overall results. Furthermore, cumulative meta-analysis, ranked by year, was conducted to examine the accumulation of results over time. 114 Finally, while not part of the a priori protocol, a post hoc decision was made to conduct outlier analysis as a form of sensitivity analysis by excluding results for those effect sizes in which their 95% CI fell completely outside the pooled 95% CI.
Results for multiple intervention groups from the same study were based on group findings. For those studies that reported both per-protocol (PP) and intention-to-treat analyses (ITT), only ITT analyses were included since they usually result in more conservative estimates of effect.
Our a priori protocol planned for conducting simple meta-regression analysis. However, because of the collectively small number of effect sizes within each exercise modality (aerobic, strength training, or both), a post hoc decision was made to not conduct such analyses given the sample sizes suggested for continuous and categorical meta-regression results.103,115
Because of concerns about missing possibly important findings that could be pursued in future RCTs, no adjustments were made for multiple testing. 116 While some may consider this to be a “fishing expedition,” such analyses are considered important for providing investigators with potential direction for future RCTs, one of the very reasons for conducting a systematic review with meta-analysis. 117
Meta-Biases
Small-study effects (publication bias, etc.) were assessed qualitatively using the Doi plot and quantitatively using the Luis Furuya-Kanamori (LFK index). The Doi plot has been suggested to be more intuitive than the funnel plot, and the LFK index more robust than the commonly used Egger’s regression-intercept test.118,119 LFK values within ±1, greater than ±1 but within ±2, and greater than ±2 were considered to represent no, minor, and major asymmetry, respectively. 118
Strength of Evidence
Strength of findings for each outcome was assessed using the most recent version of the Grading of Recommendations Assessment, Development and Evaluation (GRADE) for meta-analysis tool.120,121 Quality of evidence was assessed across the domains of risk of bias, consistency, directness, precision, and publication bias. The overall strength of evidence (certainty) was judged as either high (further research is very unlikely to change our confidence in the estimate of effect), moderate (further research is likely to have an important impact on our confidence in the estimate of effect and may change the estimate), low (further research is very likely to have an important impact on confidence in the estimate of effect and is likely to change the estimate), or very low (very uncertain about the estimate of effect).120,121 Assessment was conducted using procedures similar to those for assessing risk of bias.
Software Used for Data Synthesis
All data were analyzed using (1) Stata (version 16.1, Stata/SE for Windows; Stata, 2020), (2) the admetan package within Stata, (3) Microsoft Excel for Office 365, (4) Meta XL (version 5.3, 2016), and (5) SSC-Stat (version 3.0, 2017, University of Reading, UK).
Results
Study Characteristics
Figure 1 contains a flow diagram that depicts the results of study screening. Of the 7629 studies screened, 39 representing 86 groups (47 exercise, 39 control) and 1548 participants (847 exercise, 701 control) met the criteria for inclusion.19-34,36-58 Nine of the included studies were identified via the updated searches.22,26,27,37,41,44,49,51,57 The precision of the searches was 0.5% while the NNR was 196. The major reasons for the exclusion of studies were (1) inappropriate study design (44.3%), (2) inappropriate population (24.6%), (3) inappropriate intervention (14.8%), (4) inappropriate outcome (7.4%), (5) inappropriate comparison (1.0%), and (6) other factors such as not being an actual study (7.9%). A search of the 39 included studies on April 14, 2020, found that none had been retracted. A reference list of the 7590 excluded studies, including reasons for exclusion, is available upon reasonable request from the corresponding author. Missing primary outcome data were provided by all 3 studies for which data were requested.20,22,37
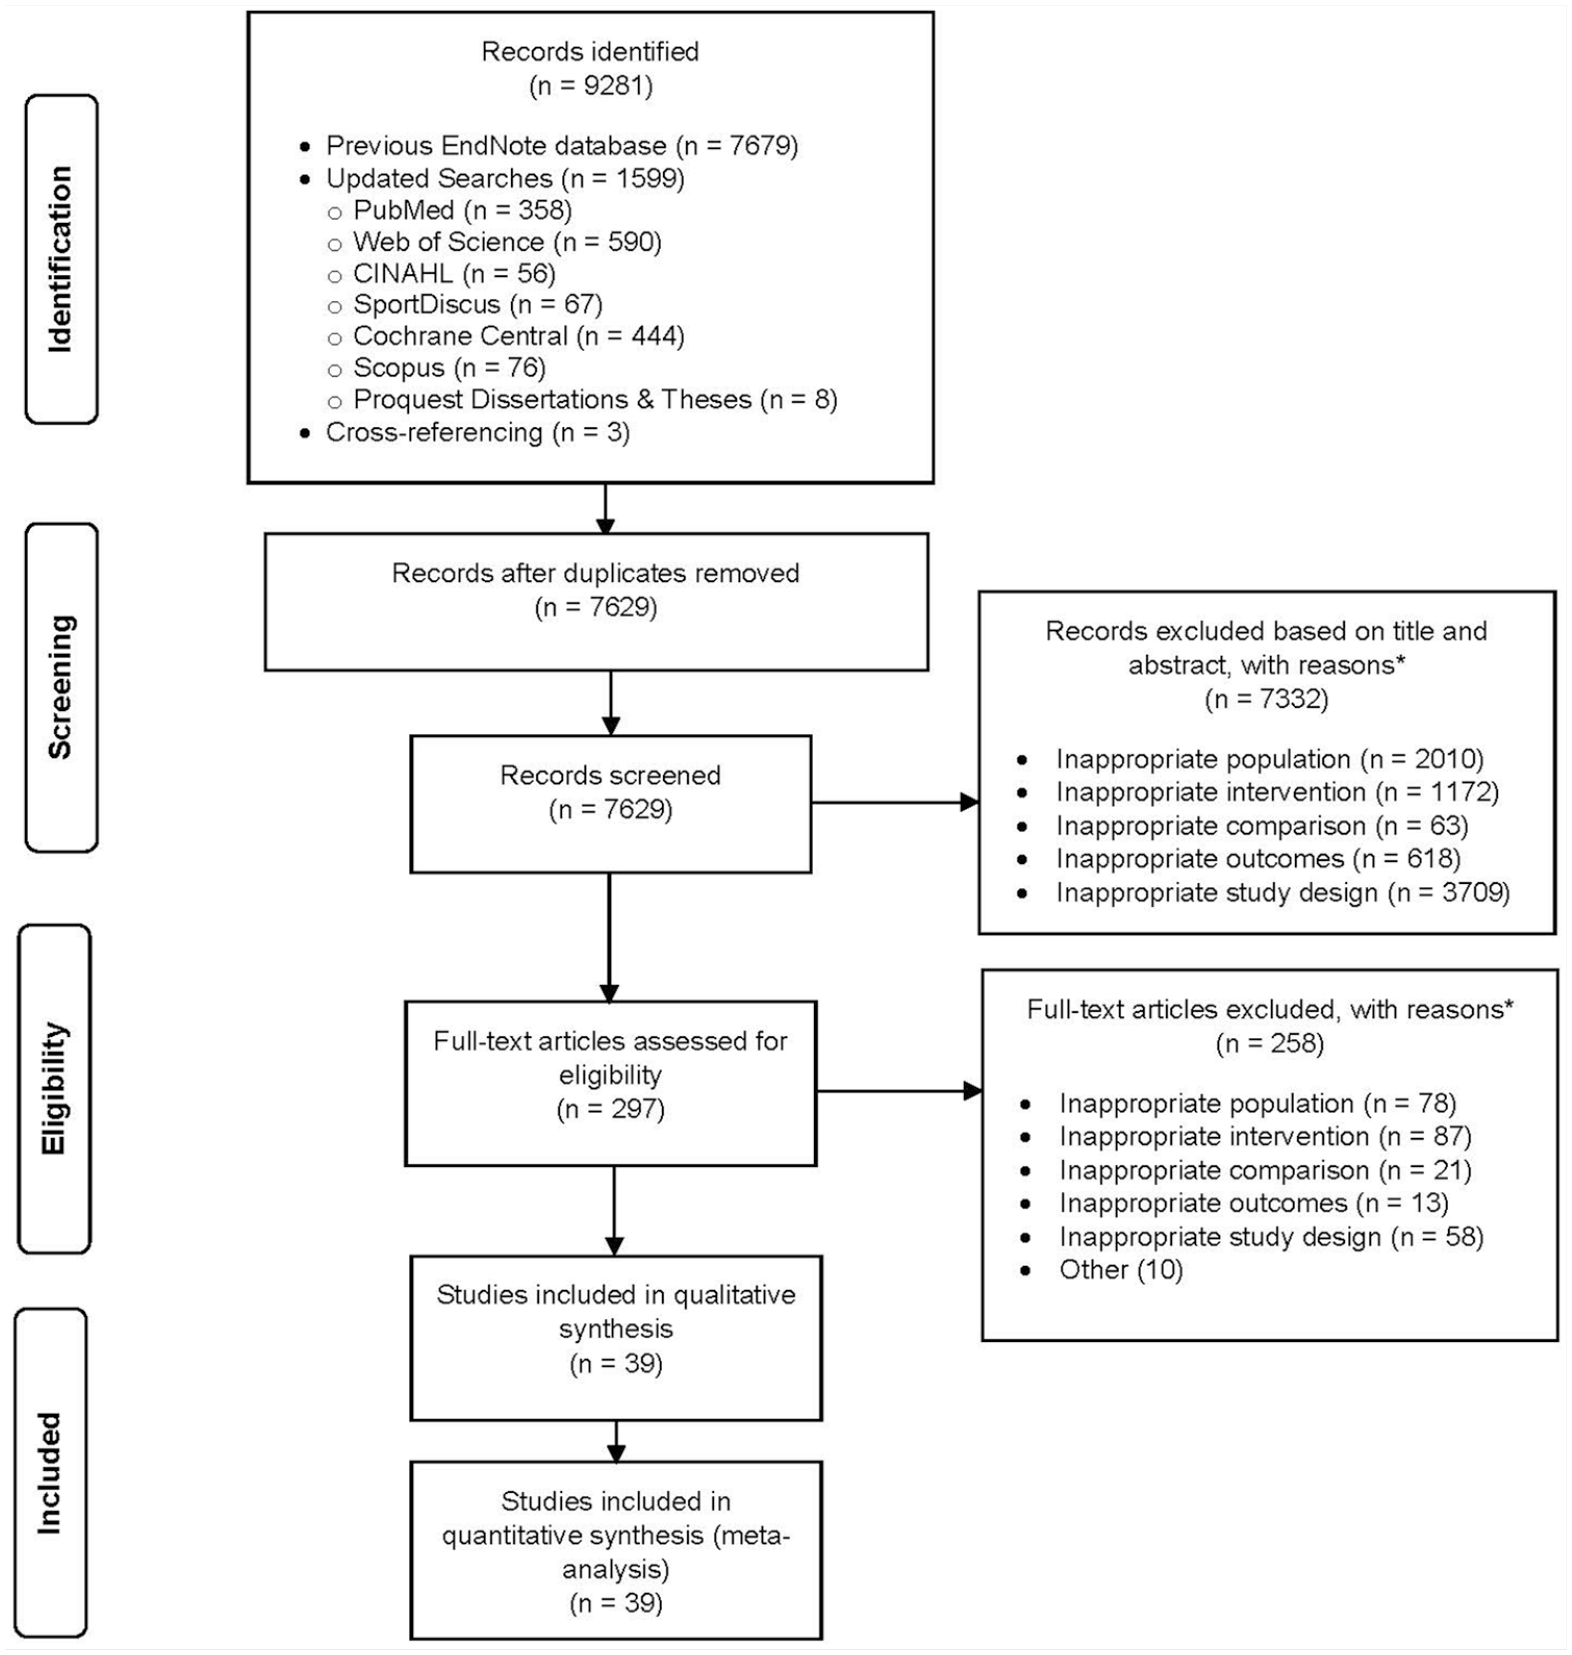
Flow diagram for the selection of studies.
A description of selected study-level characteristics is shown in Table 1 with additional information described below. Studies were published between 1997 and 2020 (X– ± SD = 2012 ± 5.0, median = 2013) in 28 different journals. The overall impact factor for the 26 journals in which impact data were available ranged from 0.02 to 12.64 (X– ± SD = 2.5 ± 2.8, median = 1.5). Thirty-five of 39 studies (89.7%) were published in the English language19-22,26-34,36-39,41-58 while 4 others were published in Chinese.23-25,40 The studies took place in 18 different countries, 7 in South Korea,22,36,37,49-51,57 5 in either China23-25,40,52 or the United States,31,34,38,39,45 4 in Tunisia,21,28,46,47 3 in Iran,30,44,58 2 each in either Australia,54,55 Turkey,33,48 or Iran30, 44 and 1 each in either Brazil, 53 Canada, 19 France, 20 Germany, 43 Indonesia, 27 Singapore, 56 Sweden, 32 Switzerland, 29 Taiwan, 41 Thailand, 26 or the United Kingdom. 42 Twenty-two (56.4%) of the studies reported funding associated with their study,19,21,26,28,29,31,32,34,36,38,39,41,43-47,50,53-56 with 7 reporting more than one source of funding.29,34,36,38,39,45,53 Funding was derived from government,21,28,29,31,32,34,38,39,41,45-47,53 university,19,26,29,34,36,43,44,50,56 and private sources.36,38,39,45,53-55 Thirteen studies (33.3%) provided sample size estimates for their primary outcome(s) of interest.22,29,34,38,41,44,45,49-51,53,55,57 For the 22 studies (56.4%) in which it could be clearly discerned,19,22,26,27,29,31,32,34,38-43,45-47,49,50,52,53,58 12 used the PP approach to analyze their data,19,26,31,32,34,43,45-47,50,53,58 5 used ITT,22,27,42,49,52 and 4 used both.29,38,39,41 Another study reported that all participants initially enrolled completed the study. 40 Two studies reported matching subjects by either sex 41 or sex and ethnicity. 45 Seven studies included more than one exercise group.24,26,38,39,44,46,47 Two studies included an attention-control group37,51 while 4 wait-listed controls.19,32,41,53 Another 2 studies reported using a randomized crossover design.54,55 As shown in Table 1, and while noting that obesity cutpoints will vary by country, 88 the methods used for classifying obesity varied between the different studies.19-34,36-58
General Characteristics of Studies.
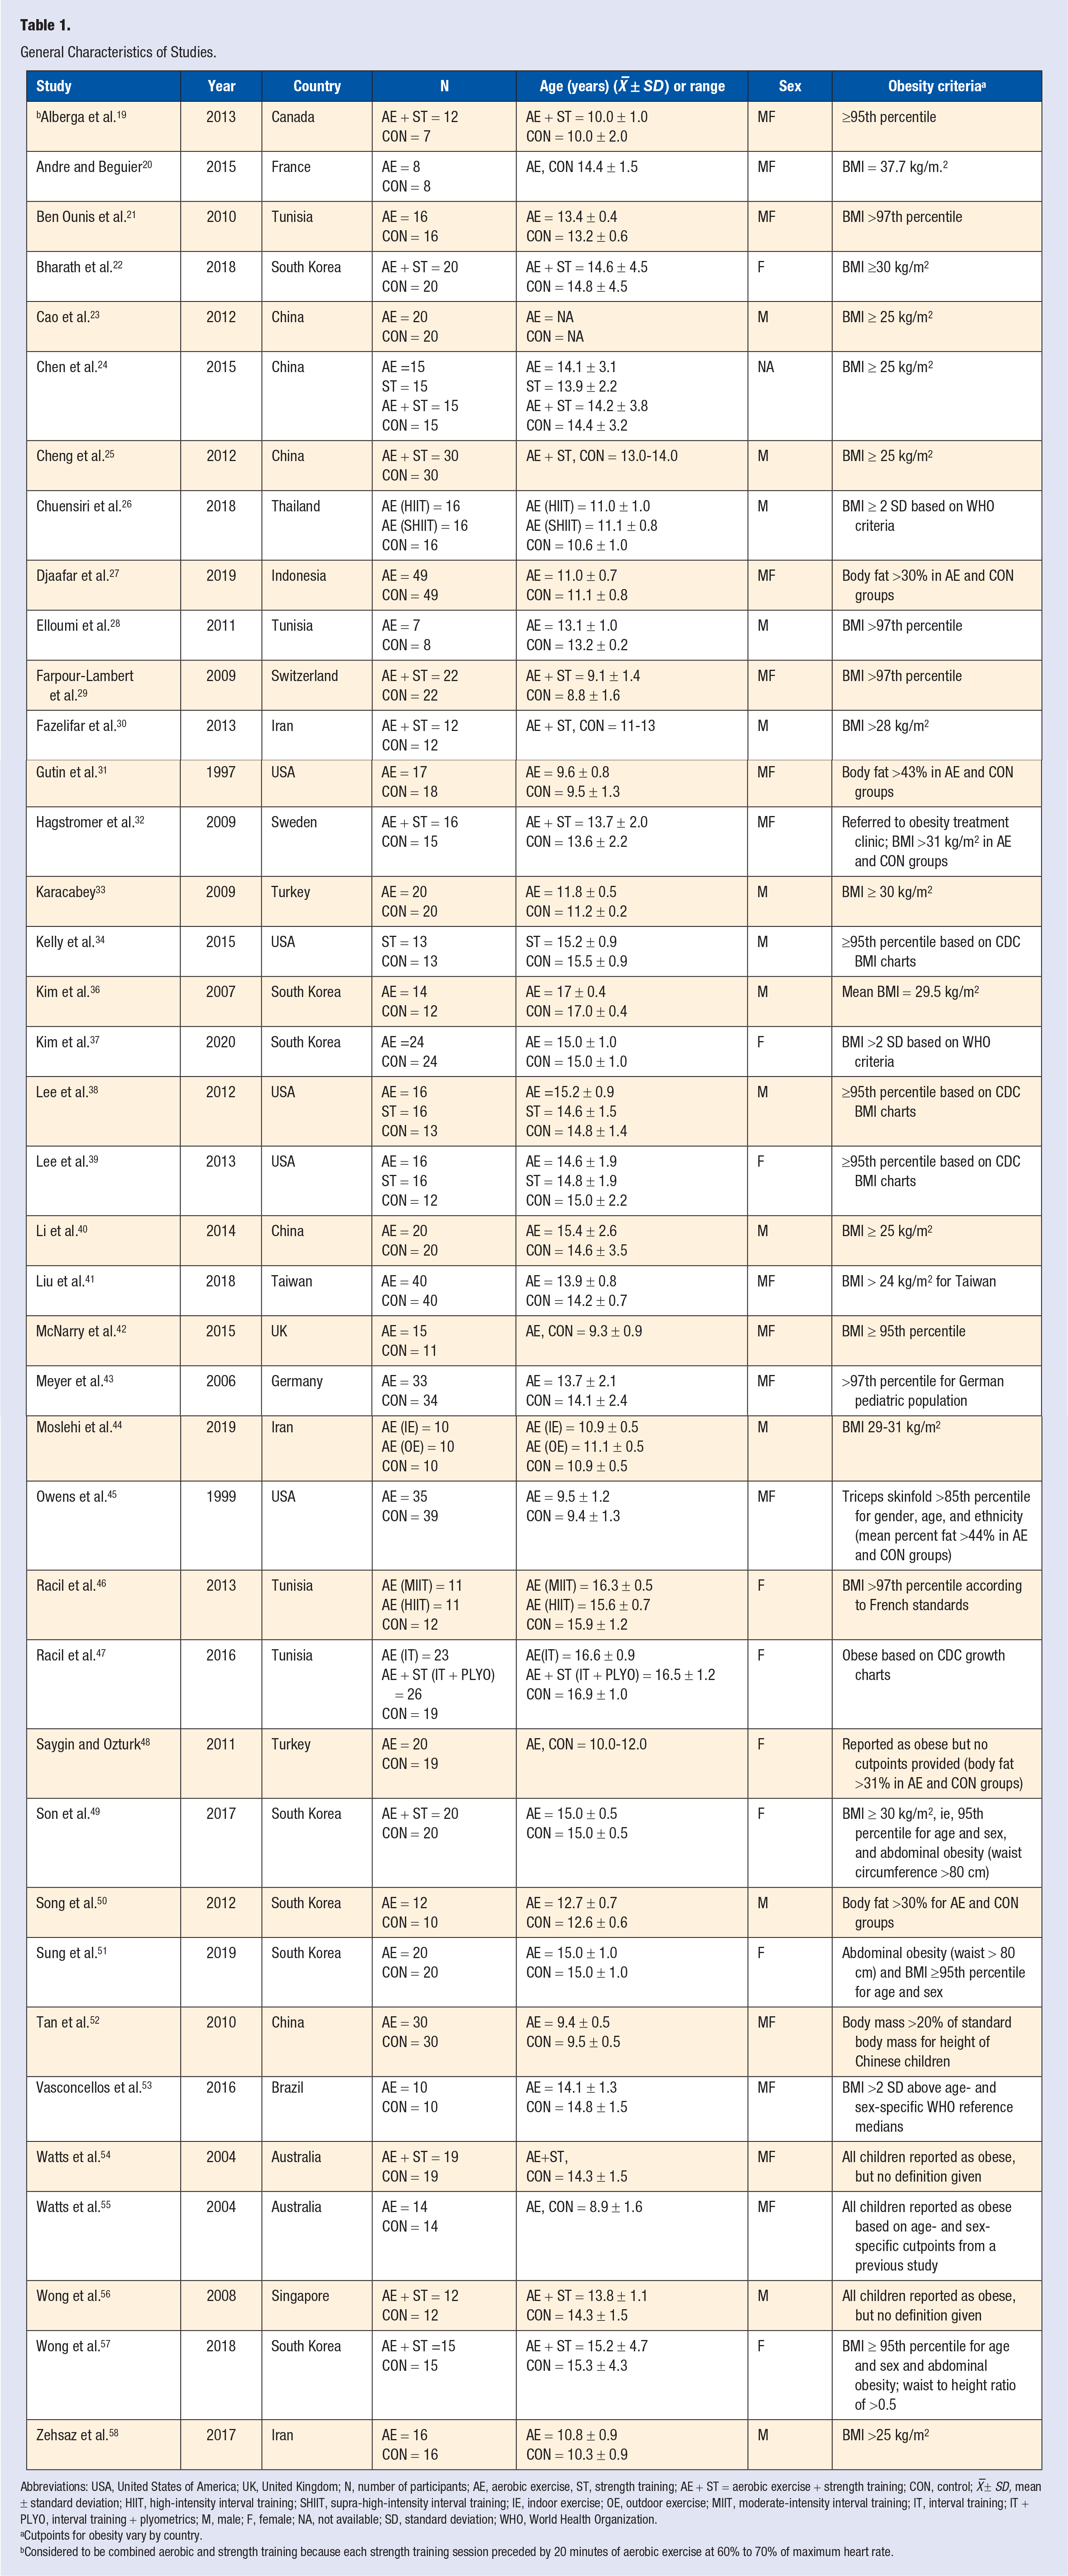
Abbreviations: USA, United States of America; UK, United Kingdom; N, number of participants; AE, aerobic exercise, ST, strength training; AE + ST = aerobic exercise + strength training; CON, control; X –± SD, mean ± standard deviation; HIIT, high-intensity interval training; SHIIT, supra-high-intensity interval training; IE, indoor exercise; OE, outdoor exercise; MIIT, moderate-intensity interval training; IT, interval training; IT + PLYO, interval training + plyometrics; M, male; F, female; NA, not available; SD, standard deviation; WHO, World Health Organization.
Cutpoints for obesity vary by country.
Considered to be combined aerobic and strength training because each strength training session preceded by 20 minutes of aerobic exercise at 60% to 70% of maximum heart rate.
Participant Characteristics
Baseline characteristics for participants are shown in Table 2. As can be seen, WC and FI levels were greater for exercise versus control groups. No other significant differences were observed. For those studies in which it could be delineated, 15 (39.5%) included both males and females,19-21,27,29,31,32,41-43,45,52-55 14 (36.8%) were limited to males,23,25,26,28,30,33,34,36,38,40,44,50,56,58 and 9 (23.7%) to females.22,37,39,46-49,51,57 For those studies reporting data, race/ethnicity, as reported by the authors, included Blacks, Whites, Hispanics, Asians, as well as multiple groups.22-25,31,34,36-41,45,49-52,55-57 Studies included participants with hyperlipidemia,21,29 hypertension or prehypertension,21,29,37,49,51 hyperinsulinemia,37,49,57 and insulin resistance. 29 None of the studies reported any type of drug use by participants at the start of the trial that could impair exercise or weight loss. In addition, none of the studies reported that participants were taking any type of hormone replacement therapy, smoked cigarettes, consumed alcohol, had type 1 or type 2 diabetes, heart disease, metabolic syndrome, cancer, or asthma. As defined by the authors, 12 studies specifically reported that participants were sedentary prior to study initiation.22,26,29,30,33,37-39,43,49,51,57 One study reported that participants in the exercise group decreased their normal daily physical activity levels during the intervention, 32 while 2 other studies reported a decrease in physical activity in the control groups.29,45 No serious adverse events were reported by any of the studies.
Baseline Characteristics of Participants a .
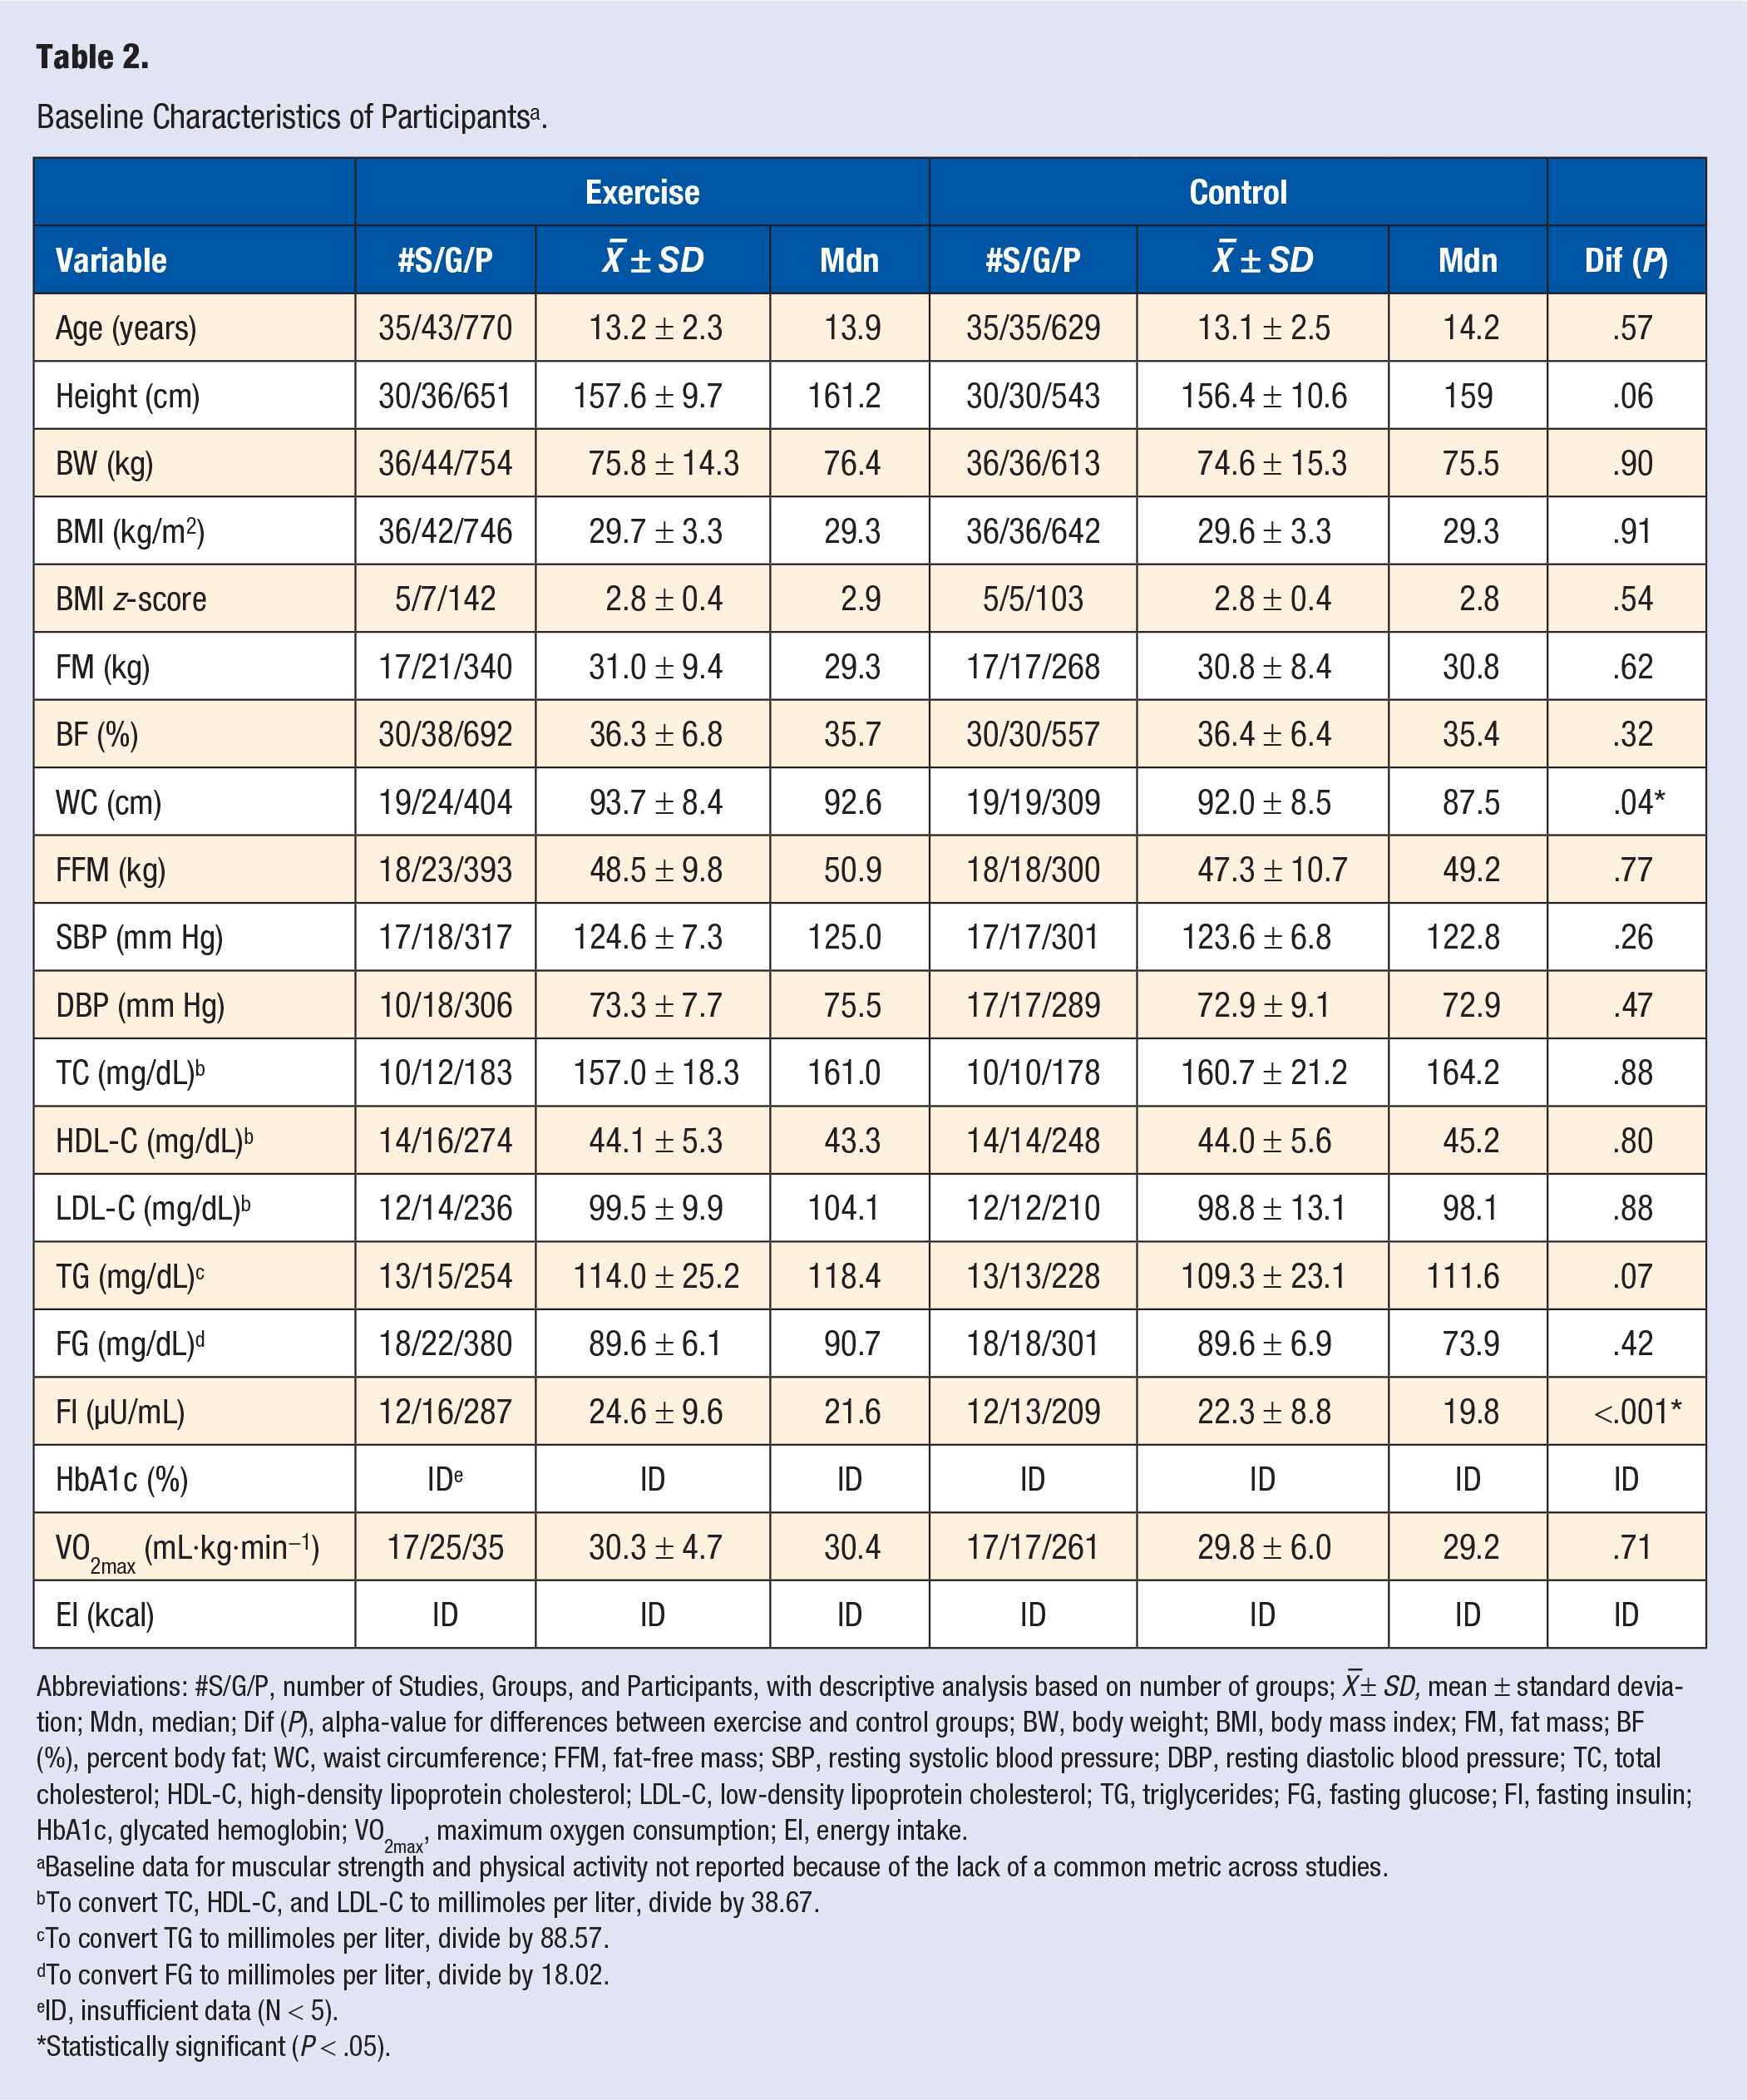
Abbreviations: #S/G/P, number of Studies, Groups, and Participants, with descriptive analysis based on number of groups; X –± SD, mean ± standard deviation; Mdn, median; Dif (P), alpha-value for differences between exercise and control groups; BW, body weight; BMI, body mass index; FM, fat mass; BF (%), percent body fat; WC, waist circumference; FFM, fat-free mass; SBP, resting systolic blood pressure; DBP, resting diastolic blood pressure; TC, total cholesterol; HDL-C, high-density lipoprotein cholesterol; LDL-C, low-density lipoprotein cholesterol; TG, triglycerides; FG, fasting glucose; FI, fasting insulin; HbA1c, glycated hemoglobin; VO2max, maximum oxygen consumption; EI, energy intake.
Baseline data for muscular strength and physical activity not reported because of the lack of a common metric across studies.
To convert TC, HDL-C, and LDL-C to millimoles per liter, divide by 38.67.
To convert TG to millimoles per liter, divide by 88.57.
To convert FG to millimoles per liter, divide by 18.02.
ID, insufficient data (N < 5).
Statistically significant (P < .05).
For the 16 studies (41.0%) that reported adequate data,22,26,27,29,34,38-41,43,45-47,49,52,53 the dropout rate ranged from 0% to 37.5% in both the exercise and control groups (exercise, X– ± SD, 10.1 ± 11.5%, control, 12.9 ± 13.6%). No significant difference was observed in dropouts between the exercise and control groups (OR, 0.82; 95% CI, 0.52 to 1.29, P = .39). Reasons given by participants for dropping out of the study included personal and family reasons, lack of interest, transportation issues, intensity of the exercise intervention, unhappiness with being assigned to the control group, and pregnancy. Reasons given by investigators for dropping participants from the study included lack of compliance to the intervention assigned, not completing follow-up testing as well as participants dieting or taking metformin during the study.
Exercise Program Characteristics
Exercise program characteristics are shown in Table 1 and Table 3. Twenty-seven studies included one or more aerobic exercise groups,20,21,23,24,26-28,31,33,36-48,50-53,55 4 included a strength training group,24,34,38,39 while 12 included a combined aerobic and strength training group.19,22,24,25,29,30,32,47,49,54,56,57 Three studies included one or more aerobic interval training groups.26,46,47 Training modalities included walking, jogging, cycling, swimming, various games, jump rope, elliptical exercise, and strength training.19-34,36-58 Based on American College of Sports Medicine cutpoints for the different methods of relative exercise intensity reported in those studies in which data were available, 122 19 included one or more moderate intensity exercise groups,19,24,29-32,37-40,48-51,54-58 12 included one or more vigorous intensity exercise groups,21-23,33,38,39,41,44-46,52,53 while 3 included one or more maximal or near-maximal, that is, interval exercise groups.26,46,47 With the exception of one study in which exercise was unsupervised, 34 all others were supervised.19-33,36-58 For those studies that included a strength training group and in which data were provided, the number of sets ranged from 1 to 4,19,24,29,30,34,38,39,47,57 the number of repetitions per exercise from 5 to 25,19,22,24,29,30,34,38,39,47,56,57 and the number of exercises from 3 to 13.19,22,30,38,39,47,56 The reported rest period between exercises ranged from 30 to 180 seconds.24,30,39,47,57 Resistance for the strength training interventions included free weights, machine weights, elastic bands, medicine balls, and one’s own body weight (pushups, etc.). Three studies reported using a circuit training protocol.54,57,58
Training Program Characteristics a .
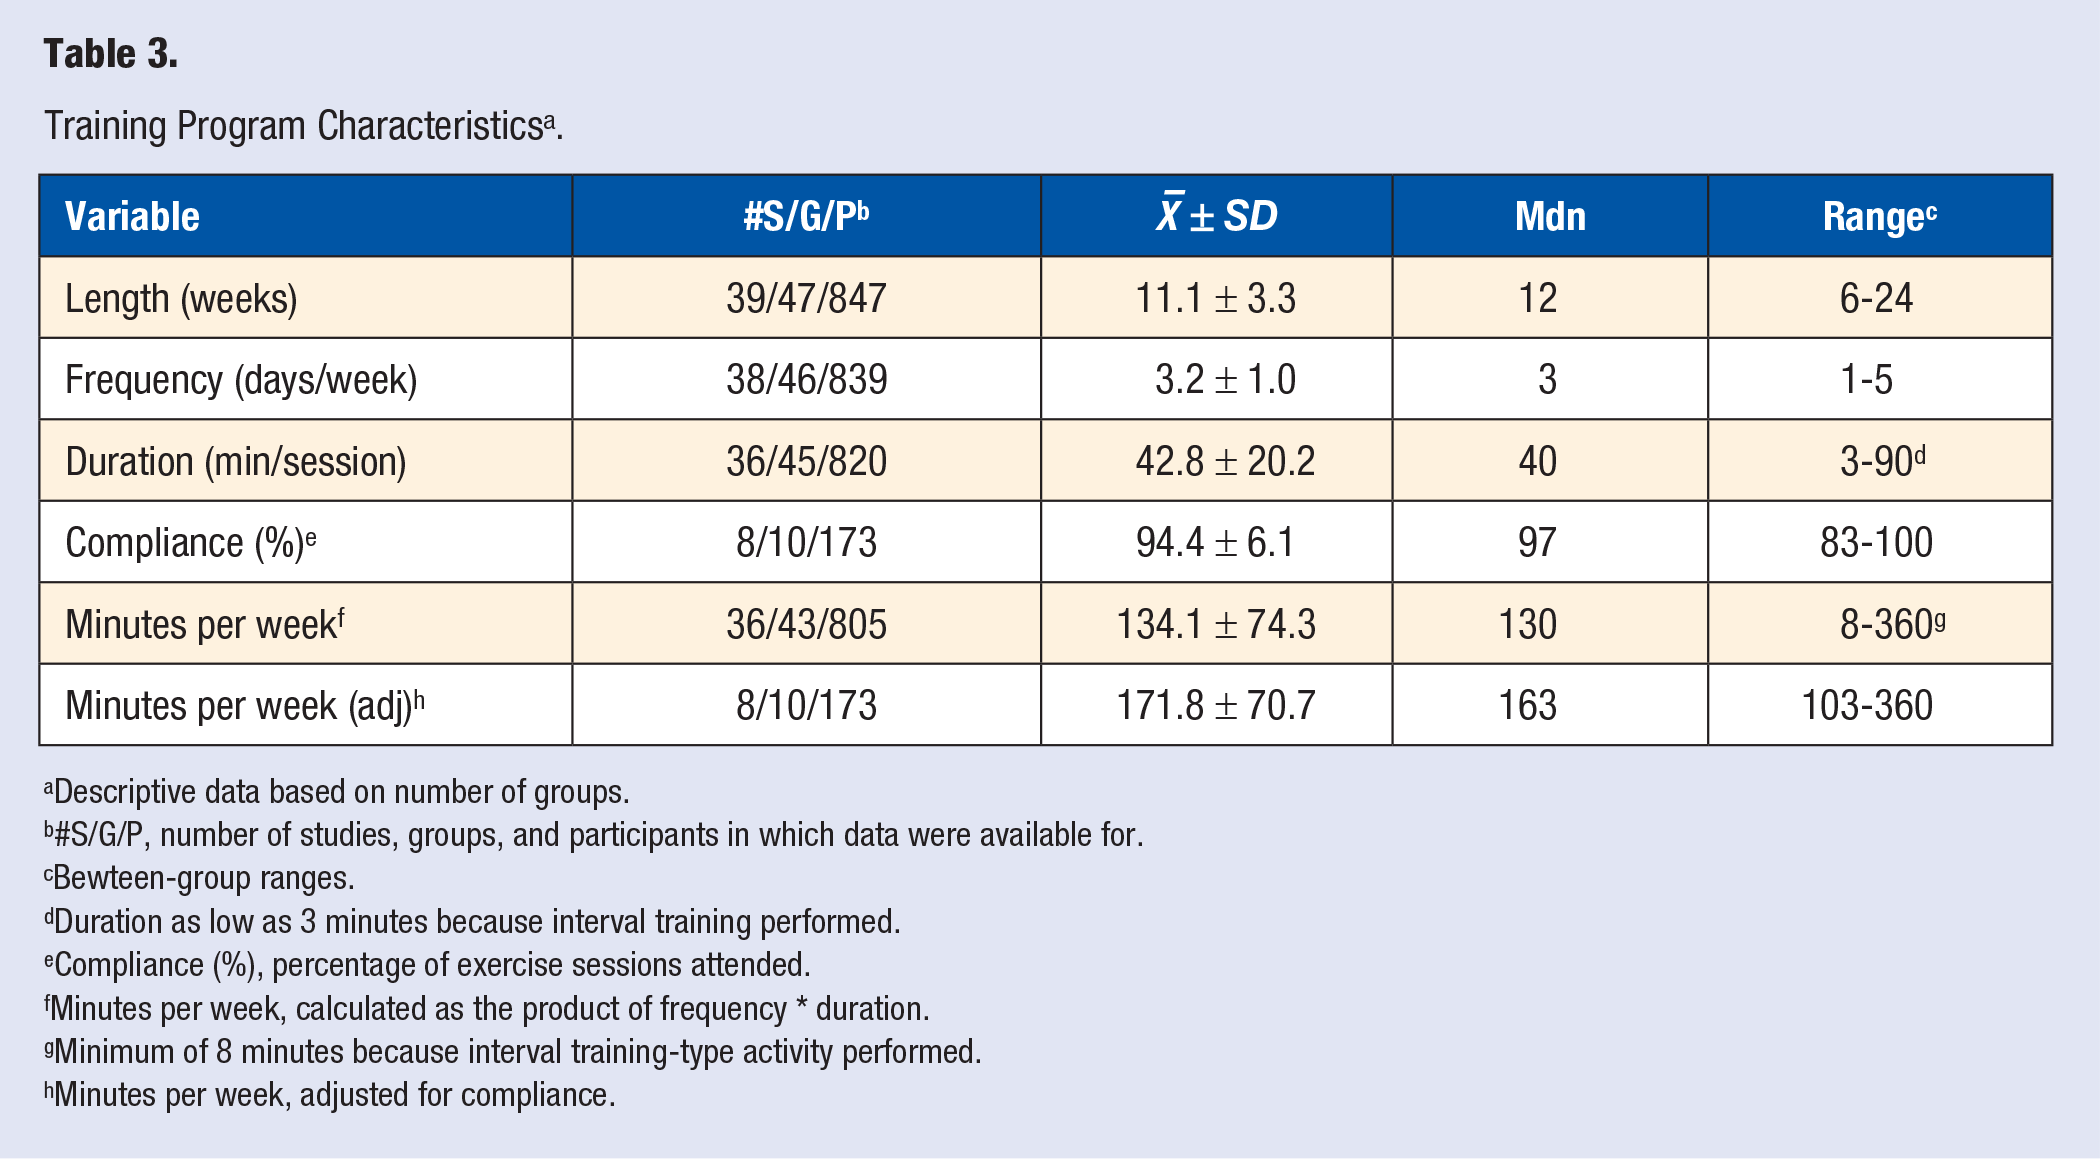
Descriptive data based on number of groups.
#S/G/P, number of studies, groups, and participants in which data were available for.
Bewteen-group ranges.
Duration as low as 3 minutes because interval training performed.
Compliance (%), percentage of exercise sessions attended.
Minutes per week, calculated as the product of frequency * duration.
Minimum of 8 minutes because interval training-type activity performed.
Minutes per week, adjusted for compliance.
Risk of Bias Assessment
Overall risk of bias based on the Cochrane Risk of bias assessment instrument (v 2.0) is shown in Figure 2, while study-level results are shown in Supplementary File 2. As can be seen, the overall risk of bias for most studies (76.9%) was high.
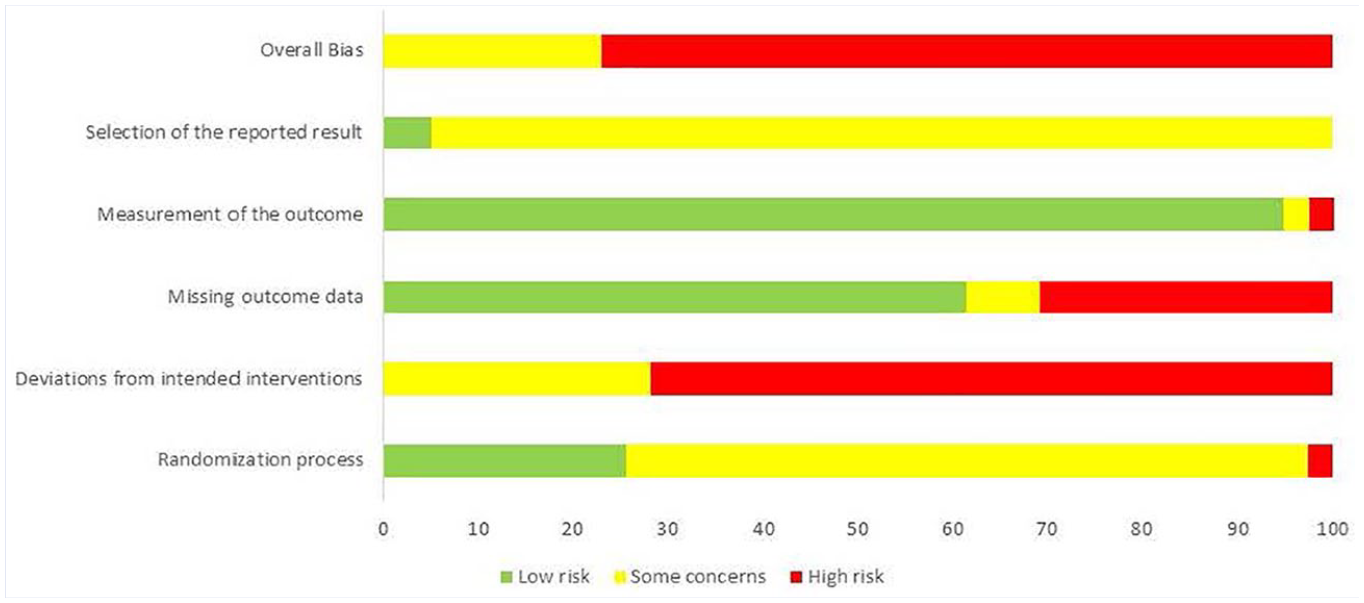
Risk of bias results (pooled).
Data Synthesis
Changes in Primary Outcomes
Adiposity outcomes
As can be seen in Table 4 and Supplementary File 3, significant reductions in BMI in kg/m2 were observed for aerobic exercise (P < .001) but not combined aerobic and strength exercise (P = .22). Compared to a mean baseline value of 29.2 kg/m2, changes were equivalent to reductions of 6.5% in the aerobic exercise groups. Significant heterogeneity and a large amount of inconsistency were observed (Supplementary File 3). In addition, major asymmetry suggestive of small-study effects was found (Supplementary File 4). The 95% PI was −4.1 to 0.3 kg/m2 for aerobic exercise and −2.1 to 1.3 kg/m2 for combined aerobic and strength training. Changes in aerobic exercise groups remained statistically significant across all deletions, ranging from −1.9 to −1.7 kg/m2. When 3 outlier results from 2 studies were deleted from the aerobic group,26,33 results remained statistically significant (
Changes in Primary and Secondary Outcomes.
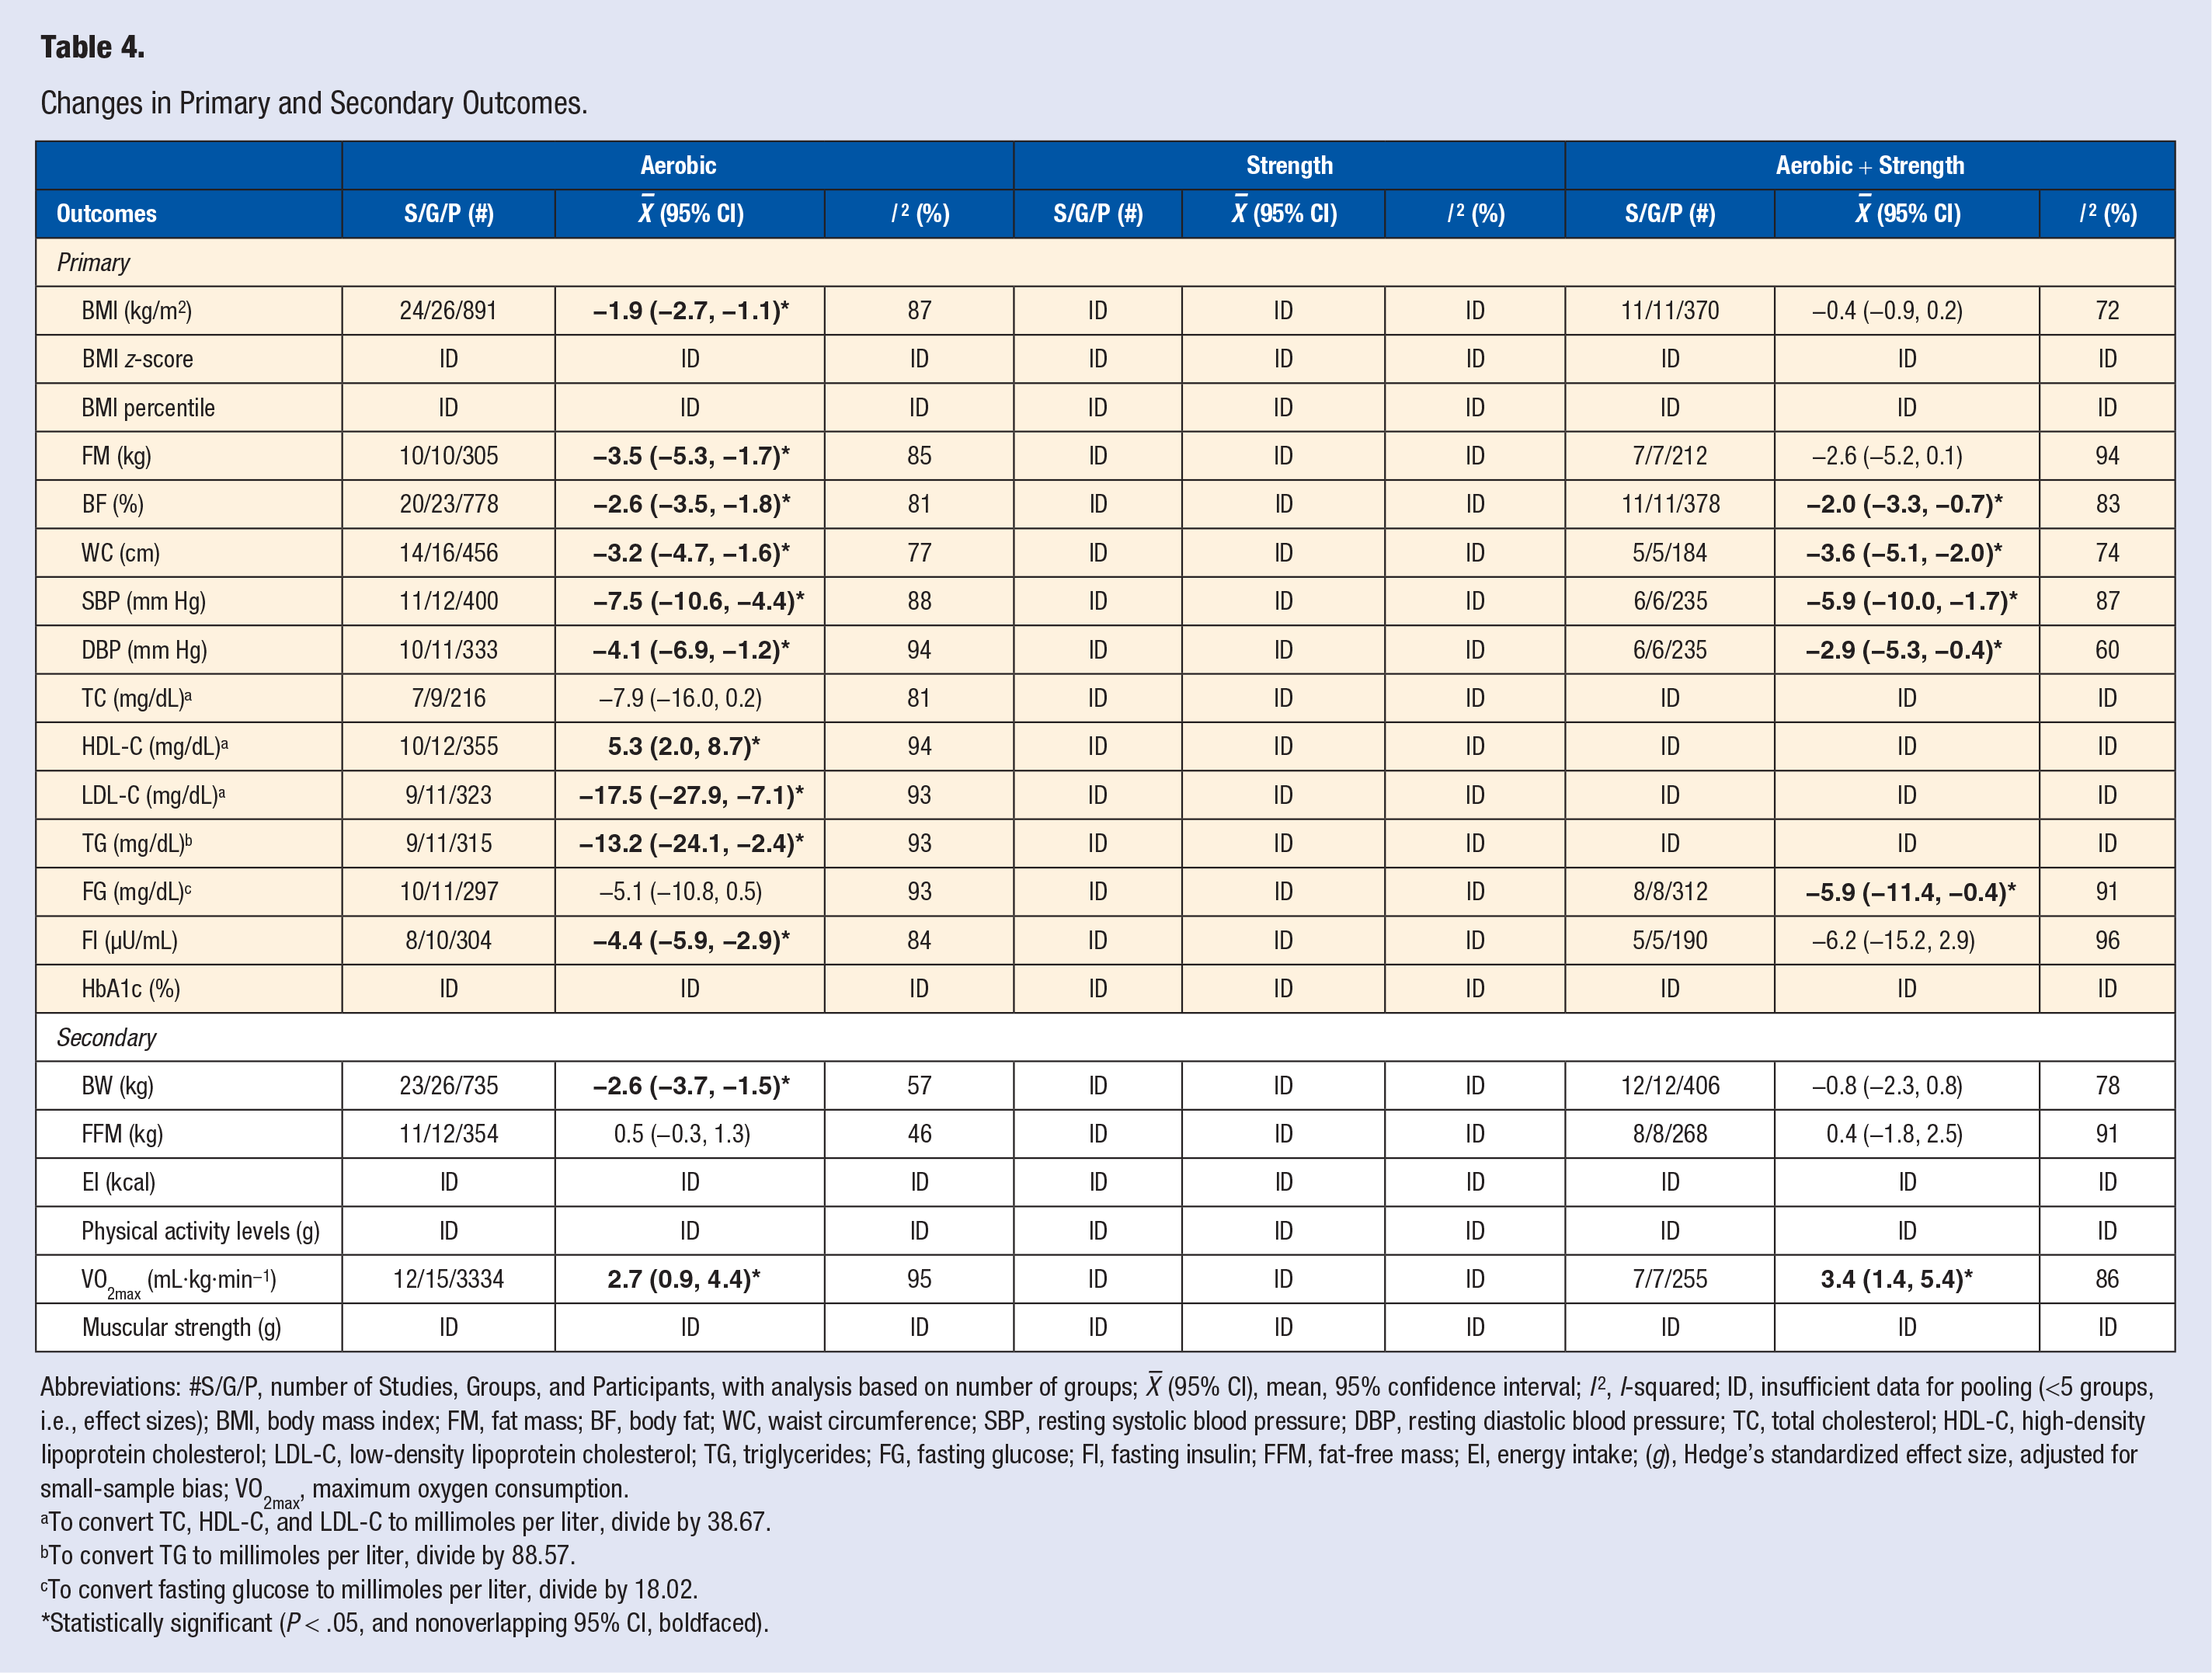
Abbreviations: #S/G/P, number of Studies, Groups, and Participants, with analysis based on number of groups;
To convert TC, HDL-C, and LDL-C to millimoles per liter, divide by 38.67.
To convert TG to millimoles per liter, divide by 88.57.
To convert fasting glucose to millimoles per liter, divide by 18.02.
Statistically significant (P < .05, and nonoverlapping 95% CI, boldfaced).
For FM (kg), statistically significant reductions were observed for the aerobic exercise groups (P < .001) with a trend for significant reductions in the combined aerobic and strength training groups (P = .06, Table 4, Supplementary File 6). Compared to a mean aerobic group baseline value of 30.4 ± 9.4 kg, changes were equivalent to reductions of approximately 11.5%. Significant heterogeneity and a large amount of inconsistency were observed (Supplementary File 6). No asymmetry was observed (Supplementary File 7). The 95% PI was −8.9 to 2.0 kg for aerobic exercise and −11.5 to 6.4 kg for combined aerobic and strength training. With each result deleted from the model once, changes remained statistically significant across all deletions, ranging from −4.0 to −2.4 kg, including when one outlier was deleted. 40 Cumulative meta-analysis, ranked by year, revealed that results for all aerobic exercise groups have been significant since inception of the first study in 1999, with more prominent reductions since 2014 (Supplementary File 8).
When results for BF% were pooled, statistically significant reductions were observed for both the aerobic (P < .001) and combined aerobic and strength training (P = .004) groups (Table 4, Supplementary File 9). Compared to mean baseline values of 35.2 ± 6.6% for aerobic exercise and 38.0 ± 5.3% for combined aerobic and strength training, relative reductions were equivalent to approximately 7.5% and 5.2%, respectively. The 95% PI for aerobic and combined aerobic and strength training was −5.4% to 0.1% and −6.1% to 2.2%, respectively. Significant heterogeneity and a large amount of inconsistency were observed for both interventions (Supplementary File 9). No asymmetry was observed for either aerobic (Supplementary File 10) or combined aerobic and strength training (Supplementary File 11). With each result deleted from the model once, changes remained statistically significant across all deletions for both aerobic (range, −2.8% to −2.5%) and combined aerobic and strength training (range, −2.3% to −1.7%), including when one outlier was deleted for the latter.
24
Results also remained significant when 2 outlier results were deleted for aerobic exercise groups (
Statistically significant reductions in WC were observed for both aerobic and combined aerobic and strength training (P < .001 for both, Table 4, Supplementary File 14). Compared to mean baseline values of 92.3 ± 7.5 cm for aerobic exercise and 90.6 ±4.8 cm for combined aerobic and strength training, relative reductions were equivalent to approximately 3.4% and 3.9%, respectively. Significant heterogeneity was observed for both aerobic (P < .001) and combined aerobic and strength training (P = .004) while a large and moderate amount of inconsistency was observed for aerobic and combined aerobic and strength training, respectively (Supplementary File 14). No asymmetry was observed for aerobic exercise (Supplementary File 15) while minor asymmetry was observed for combined aerobic and strength training (Supplementary File 16). The 95% PI was −7.0 to 0.6 cm for aerobic exercise and −8.6 to 1.5 cm for combined aerobic and strength training. With each result deleted from the model once, changes remained statistically significant across all deletions for both aerobic (range, −3.6. to −2.8 cm) and combined aerobic and strength training (range, −3.9 to −3.2 cm), including when one outlier was deleted for the aerobic exercise groups. 21 Cumulative meta-analysis, ranked by year, revealed that WC reductions for aerobic exercise have been significant since the year 2010 (Supplementary File 17) and since 2017 for combined aerobic and strength training (Supplementary File 18).
BP outcomes
When results for changes in resting SBP were pooled, statistically significant reductions were observed for both aerobic (P < .001) and combined aerobic and strength training groups (P = .005, Table 4, Supplementary File 19). Compared to mean baseline values of 126.0 ± 6.3 mm Hg for aerobic exercise and 118.1 ± 9.9 mm Hg for combined aerobic and strength training, relative reductions were equivalent to approximately 5.9% and 5.0%, respectively. Significant heterogeneity and a large amount of inconsistency were observed for both interventions (Supplementary File 19). Minor asymmetry suggestive of small-study effects was observed for aerobic exercise (Supplementary File 20) while no asymmetry was observed for combined aerobic and strength training (Supplementary File 21). The 95% PI for aerobic and combined aerobic and strength training was −15.5 to 0.5 mm Hg and −18.7 to 7.0 mm Hg, respectively. With each result deleted from the model once, changes in resting SBP remained statistically significant across all deletions for both aerobic (range, −8.0 to −6.9 mm Hg) and combined aerobic and strength training (range, −6.9 to −4.2 mm Hg), including when 2 outliers were deleted for aerobic exercise groups36,55 and one for combined aerobic and strength exercise. 32 Cumulative meta-analysis, ranked by year, revealed that results for aerobic exercise groups have been significant since the year 2012 (Supplementary File 22) and since 2017 for combined aerobic and strength exercise (Supplementary File 23).
For resting DBP, statistically significant reductions were observed for both aerobic (P = .01) and combined aerobic and strength training (P = .02) groups (Table 4, Supplementary File 24). Compared to mean baseline values of 75.5 ± 6.9 mm Hg for aerobic exercise and 70.4 ± 8.8 mm Hg for combined aerobic and strength training, relative reductions were equivalent to approximately 5.4% and 4.1%, respectively. Significant heterogeneity was observed for both aerobic and combined aerobic and strength exercise while a large and moderate amount of inconsistency was observed for aerobic and combined aerobic and strength exercise, respectively (Supplementary File 24). Minor asymmetry suggestive of small-study effects was observed for aerobic exercise (Supplementary File 25) while major asymmetry was observed for combined aerobic and strength training (Supplementary File 26). The 95% PI was −12.0 to 3.8 mm Hg for aerobic exercise and −9.2 to 3.5 mm Hg for combined aerobic and strength training. With each result deleted from the model once, changes in resting DBP remained statistically significant across all deletions for both aerobic range, -3.0 to – 4.9 mm Hg) and combined aerobic and strength training (range, −3.1 to −1.6 mm Hg). Results also remained significant when 2 outliers for aerobic exercise were deleted from the model (
Lipid and lipoprotein outcomes
As can be seen in Table 4 and Supplementary File 29, reductions in TC were in the direction of benefit but not statistically significant for aerobic exercise interventions (P = .05 with overlapping 95% CIs). Compared to a mean baseline value of 155.6 mg/dL, overall changes were equivalent to reductions of 5.1%. Statistically significant heterogeneity and a large amount of inconsistency were observed (Supplementary File 29). Minor asymmetry suggestive of small-study effects was found (Supplementary File 30). The 95% PI was −31.1 to 15.2 mg/dL. With each study deleted from the model once, changes remained nonsignificant except when 2 studies were deleted separately.36,55 Results also remained nonsignificant when the one outlier was deleted. 53 Cumulative meta-analysis, ranked by year, revealed that results for aerobic exercise have remained nonsignificant since inception of the first study in 2004 but with a trend toward significance in more recent years (Supplementary File 31).
Limited to aerobic exercise, statistically significant increases in HDL-C were observed (P = .002, Table 4 and Supplementary File 32). Compared to a mean baseline value of 43.3 ± 5.7 mg/dL, overall changes were equivalent to relative increases of 12.2%. Statistically significant heterogeneity and a large amount of inconsistency were observed (Supplementary File 32). Minor asymmetry suggestive of small-study effects was found (Supplementary File 33). The 95% PI was −4.5 to 15.1 mg/dL. With each study deleted from the model once, changes remained significant, ranging from 4.3 to 6.0 mg/dL. When 2 outliers were deleted from the model simultaneously,26,48 results remained significant (
For LDL-C, statistically significant reductions (P = .001) limited to aerobic exercise groups were found (Table 4 and Supplementary file 35). Compared to a mean baseline value of 100.0 ± 9.2 mg/dL, overall changes were equivalent to relative decreases of 12.2%. Statistically significant heterogeneity and a large amount of inconsistency were observed (Supplementary File 35). Major asymmetry suggestive of small-study effects was also observed (Supplementary File 36). The 95% PI was −46.0 to 11.0 mg/dL. With each study deleted from the model once, changes remained significant, ranging from −19.9 to −10.3 mg/dL. When 2 outliers were deleted from the model simultaneously,36,55 results remained significant (
Statistically significant reductions in TG (P = .02) were found for aerobic exercise groups (Table 4 and Supplementary file 38). Compared to a mean baseline value of 124.1 ± 18.1 mg/dL, relative decreases of 10.7% were observed. Statistically significant heterogeneity and a large amount of inconsistency were present (Supplementary File 38). Major asymmetry suggestive of small-study effects was also found (Supplementary File 39). The 95% PI was −42.6 to 16.1 mg/dL. With each study deleted from the model once, changes remained significant, ranging from −16.7 to −9.5 mg/dL, except when the study by Ben Ounis et al.
21
was deleted from the model (
Diabetes-related outcomes
As can be seen in Table 4 and Supplementary File 41, overall results for FG were in the direction of benefit but not statistically significant for aerobic exercise (P = .07) while results were statistically significant (P = .04) for combined aerobic and strength training groups. Compared to mean baseline values of 88.7 ± 4.9 mg/dL for aerobic exercise and 89.2 ± 8.3 mg/dL for combined aerobic and strength training, relative reductions were equivalent to approximately 5.8% and 6.6%, respectively. Significant heterogeneity and a large amount of inconsistency were observed for both aerobic and combined aerobic and strength training groups (Supplementary File 41). Major asymmetry suggestive of small-study effects was observed for both aerobic (Supplementary File 42) and combined aerobic and strength training (Supplementary File 43). The 95% PI was −17.0 to 6.7 mg/dL for aerobic exercise and −23.2 to 11.4 mg/dL for combined aerobic and strength training. With each result deleted from the model once, changes in FG remained nonsignificant for the aerobic exercise groups except when one outlier study was deleted from the model
36
(
Statistically significant reductions in FI were observed for aerobic (P < .001) but not combined aerobic and strength (P = .18) groups (Table 4 and Supplementary File 46). Compared to mean baseline values of 23.0 ± 9.2 µU/mL for aerobic exercise and 20.4 ± 7.2 µU/mL for combined aerobic and strength training, relative reductions were equivalent to approximately 19.2% and 30.2%, respectively. Significant heterogeneity and a large amount of inconsistency were observed for both aerobic and combined aerobic and strength training groups (Supplementary File 46). Major asymmetry suggestive of small-study effects was observed for both aerobic (Supplementary File 47) and combined aerobic and strength exercise (Supplementary File 48). The 95% PI for aerobic and combined aerobic and strength training was −8.4 to −0.4 µU/mL and −29.6 to 17.3 µU/mL, respectively. With each result deleted from the model once, changes remained significant for aerobic exercise across all deletions (range, −4.7 to −3.8 µU/mL), including when one outlier study was deleted from the model (
For primary outcomes, insufficient data were available (N < 5) to assess BMI z-score and BMI percentile in the aerobic exercise groups, all outcomes in the strength training groups, and BMI z-score, BMI percentile, TC, HDL-C, LDL-C, and TG in the combined aerobic and strength training groups (Table 4).
Changes in Secondary Outcomes
BW
When results for BW were pooled, statistically significant reductions were observed for aerobic (P < .001) but not combined aerobic and strength training (P = .34) groups (Table 4 and Supplementary File 51). Compared to mean baseline values of 74.5 ± 14.5 kg for aerobic exercise and 75.7 ± 12.2 kg for combined aerobic and strength training, relative reductions were equivalent to approximately 3.5% and 1.0%, respectively. Significant heterogeneity and a moderate amount of inconsistency were observed for aerobic exercise while statistically significant and a large amount of inconsistency was observed for combined aerobic and strength training (Supplementary File 51). No asymmetry suggestive of small-study effects was observed for aerobic exercise (Supplementary File 52) while major asymmetry was observed for combined aerobic and strength exercise (Supplementary File 53). The 95% PI was −5.9 to 0.6 kg for aerobic exercise and −5.4 to 3.9 kg for combined aerobic and strength training. With each result deleted from the model once, changes in aerobic exercise groups remained statistically significant across all deletions (range, −3.4 to −2.5 kg), including when one outlier was deleted from the model (
FFM
No statistically significant differences were found for FFM for either the aerobic (P = .20) or combined aerobic and strength training (P = .74) groups (Table 4 and Supplementary File 56). Compared to mean baseline values of 47.1 ± 9.2 kg for aerobic exercise and 46.7 ± 10.6 kg for combined aerobic and strength training, relative increases were approximately 1.1% and 0.8%, respectively. Significant heterogeneity and low inconsistency were observed for aerobic exercise while statistically significant and a large amount of inconsistency was observed for combined aerobic and strength training (Supplementary File 56). Minor asymmetry suggestive of small-study effects was observed for aerobic exercise (Supplementary File 57), while major asymmetry was found for combined aerobic and strength training (Supplementary File 58). The 95% PI for aerobic and combined aerobic and strength training was −1.4 to 2.4 kg and −4.7 to 5.4 kg, respectively. With each result deleted from the model once, changes in aerobic exercise groups remained nonsignificant across all deletions except when the study of Zehasz et al.
58
was deleted from the model (
Maximum oxygen consumption
Statistically significant increases in VO2max in mL·kg·min−1 were found for both aerobic (P = .002) and combined aerobic and strength (P = .001) exercise (Table 4 and Supplementary File 61). Compared to mean baseline values of 30.4 ± 5.1 mL·kg·min−1 for aerobic exercise and 31.0 ± 4.5 mL·kg·min−1 for combined aerobic and strength training, relative increases were equivalent to approximately 8.9% and 11.0%, respectively. Significant heterogeneity and a large amount of inconsistency were observed for both aerobic and combined aerobic and strength training groups (Supplementary File 61). Major asymmetry suggestive of small-study effects was observed for aerobic exercise (Supplementary File 62) while no asymmetry was observed for combined aerobic and strength training (Supplementary File 63). The 95% PI was −2.3 to 7.7 mL·kg·min−1 for aerobic exercise and −1.6 to 8.4 mL·kg·min−1 for combined aerobic and strength training. With each result deleted from the model once, increases in aerobic exercise groups remained statistically significant across all deletions (range, 2.2 to 3.0 mL·kg·min−1), including when 2 outliers38,48 were deleted from the model (
For secondary outcomes, insufficient data were available (N < 5) for analyzing EI, physical activity levels, and muscular strength in the aerobic exercise groups, all secondary outcomes in the strength training groups, and EI, physical activity levels, and muscular strength in the combined aerobic and strength training groups (Table 4).
Strength of Evidence (GRADE)
Strength of evidence for primary and secondary outcomes partitioned by intervention type (aerobic or combined aerobic and strength training) and outcome category (body composition, blood pressure, lipids and lipoproteins, markers of diabetes, aerobic fitness) is shown in Supplementary Files 66 to 74. For those outcomes that could be pooled (N ≥ 5), the strength of evidence for body composition outcomes (BMI, FM, BF%, WC, BW, FFM) ranged from “very low” to “moderate” for both aerobic (Supplementary File 66) and combined aerobic and strength training (Supplementary File 67). For resting SBP and DBP, the strength of evidence was either “very low” or “low” for aerobic exercise (Supplementary File 68) and “low” for combined aerobic and strength training groups (Supplementary File 69). For lipid and lipoprotein outcomes (TC, HDL-C, LDL-C, TG), the strength of evidence was considered either “very low” or “low” for aerobic exercise groups (Supplementary File 70). The strength of evidence for markers of diabetes (FG and FI) were all considered “very low” for both aerobic (Supplementary File 71) and combined aerobic and strength training groups (Supplementary file 72). For aerobic fitness (VO2max in mL·kg·min−1), the strength of evidence was limited to “very low” and “low,” respectively, for aerobic (Supplementary File 73) and combined aerobic and strength training (Supplementary File 74).
Discussion
Overall Findings
With a focus on point estimates and 95% CI, the overall findings of the current systematic review with meta-analysis suggest that either aerobic or combined aerobic and strength exercise may improve selected CVD risk factors in children and adolescents with obesity. For aerobic exercise, this includes statistically significant improvements in body composition (BMI in kg/m2, FM, BF%, WC, BW), resting SBP and DBP, lipids and lipoproteins (HDL-C, LDL-C, TG), FI, and aerobic fitness (VO2max in mL·kg·min−1). While in the direction of benefit, no statistically significant improvements were observed for TC, FG, or FFM. The observed findings were reinforced by the lack of change in results for BMI in kg/m2, FM, BF%, WC, BW, SBP, DBP, HDL-C, LDL-C, FI, and VO2max in mL·kg·min−1, but not TG, when influence and outlier analysis was conducted as well as the accumulation of results over time. However, for TC, FFM, and FG, results became statistically significant when either influence or outlier analysis was conducted. Assuming that an improvement of 5% from baseline values is clinically relevant for all outcomes and not just adiposity results, 123 the current findings suggest clinically important improvements for all statistically significant outcomes except WC, BW, and FFM.
For combined aerobic and strength training, statistically significant improvements were observed for selected body composition outcomes (BF%, WC), resting SBP and DBP, FG, and aerobic fitness (VO2max in mL·kg·min−1). While in the direction of benefit, no significant differences were observed for BMI in kg/m2, FM, BW, FFM, or FI. These findings were reinforced by the lack of change in statistically significant results when influence and outlier analyses were conducted as well as the accumulation of findings over time. Assuming again that an improvement of 5% from baseline values is clinically relevant, the current findings suggest clinically relevant improvements for all statistically significant outcomes except WC and SBP.
While the current findings are encouraging, they should be considered with respect to (1) the overall high risk of bias for more than 75% of the studies, (2) the uncertainty in the evidence, as assessed by GRADE, and (3) the overlapping 95% PI for all outcomes except FI in the aerobic exercise groups. The generally large amount of heterogeneity and inconsistency observed, both of which are reflected in risk of bias and GRADE assessments, may be thought to derive from interindividual differences in response to exercise. However, recent research by the investigative team in which true interindividual response differences were appropriately quantified suggests that this may not be the case.124,125 However, this previous work included children with either overweight or obesity versus obesity only, and were limited to BMI in kg/m2, FM, and BF%.124,125
Implications for Research
Reporting and Conduct of Future Research
The reporting of future RCTs addressing the effects of exercise in children and adolescents with obesity could be improved. For example, appropriately reporting the elements contained in the Cochrane Risk of Bias assessment instrument for RCTs would be helpful. 100 Along those lines, only 7 studies (17.9%)22,27,29,38,39,41,53 included a Consolidated Statement of Reporting Trials (CONSORT) figure that depicted the flow of participants through the trial, 126 while less than half (33.3%) reported power estimates for their primary outcome(s) of interest.22,29,34,38,41,44,45,49-51,53,55,57 Second, better reporting of the elements of RCT exercise interventions is suggested. For example, only 8 of 39 studies (20.5%) reported adequate data on compliance of children and adolescents to the exercise interventions.19,21,29,31,38,39,45,56 Adherence to the Consensus on Exercise Reporting Template (CERT) could go a long way in addressing these elements when planning future RCTs. 127 Third, it is suggested that future studies report the EI and energy expenditure of participants as well as the total physical activity levels of participants beyond the actual exercise intervention itself. The reporting of EI and expenditure of participants is important given the need to account for the EI-energy expenditure spectrum and any potential effect on the outcomes examined. Accounting for the total physical activity levels of both intervention and control participants is important given the potential for exercise compensation. For example, when compared to a control group, Hagstromer et al. found that adolescents with obesity who were assigned to the exercise group had a greater reduction in their total daily physical activity. 32
Future Research Directions
There are several suggestions for future RCTs of exercise intervention studies in children and adolescents with obesity. First, based on the investigative team’s inclusion criteria, there was insufficient data (N < 5) to examine any of the outcomes for strength training interventions. Given these findings, it appears that there is a need for additional well-designed RCTs focused on strength training in children and adolescents with obesity. Second, given the lack of data for all intervention types with respect to BMI z-score, BMI percentile, HbA1c, EI, and total physical activity, future RCTs should consider including these outcomes in their studies given their potential impact on CVD risk factors in children and adolescents with obesity. Third, given a lack of data, future studies that focus on combined aerobic and strength training interventions should also consider the assessment of lipids and lipoproteins (TC, HDL-C, LDL-C, TG) in this population. Finally, given the increased interest in precision medicine,128-130 including precision exercise 131 and precision obesity,132,133 future RCTs should appropriately quantify any true interindividual differences in response to exercise among children and adolescents with obesity before examining for potential moderators and mediators, methods of which have been reported elsewhere.134,135 Briefly, this includes a focus on the change outcome SDs of both the intervention and control groups as the unit of analysis, including a comparison against a minimally important threshold. For example, in 2 recent interindividual response meta-analyses by the authors, little evidence was found to suggest that true interindividual response differences exist with respect to aerobic exercise on FM, BF%, and BMI in children and adolescents with overweight and obesity, once random variation was accounted for.124,125 However, whether interindividual differences exist for other outcomes, for example, resting SBP and DBP, as well as when limited to children and adolescents with obesity, is not known.
Implications for Practice
While the results of the current meta-analysis suggest that aerobic and combined aerobic and strength training may improve multiple CVD risk factors, the strength of this evidence is generally low. The former notwithstanding, it would seem reasonable to suggest that clinicians consider the treatment approach to managing obesity in adolescents recently suggested by Cardel et al., 136 much of which could also be applied to children with obesity. This approach includes (1) classifying weight status using BMI, (2) conducting a detailed history, physical examination, and laboratory assessment, (3) discussing the diagnosis with the child/adolescent and caregiver(s), and (4) recommending behavioral interventions that include, but are not limited to, dietary modifications and at least 60 minutes of physical activity and less than 2 hours of nonacademic sedentary activities per day. 136 If BMI targets are not reached through lifestyle changes in adolescents, long-term use of a Food and Drug Administration–approved drug such as orlistat in those ≥12 years of age may be given, and as a last option, possible surgical intervention. Specific to physical activity, of which exercise is nested in, it is suggested that clinicians and other health care professionals counsel children and adolescents with obesity to strive toward meeting or exceeding the recommendations set forth by the 2018 Physical Activity Guidelines for Americans. 18 For preschool children 3 to 5 years of age, this includes being physically active throughout the day with adult caregivers encouraging active play. 18 For children and adolescents 6 years of age and older, a minimum of 60 minutes of moderate to vigorous physical activity is recommended. 18 The majority of the 60 minutes should consist of aerobic activity, for example, bicycling, of which 3 days per week should be vigorous intensity activity. Included within the 60 minutes or more should be muscle strengthening and bone strengthening activity at least 3 days per week. 18 Inclusive in the authors’ recommendation is interval training types of activities.137,138
Implications for Policy
From the authors’ perspective, the results of this systematic review with aggregate data meta-analysis have application to policy. Specifically, it is suggested that third-party payment for exercise programming be considered. For example, while the Early and Periodic Screening, Diagnostic and Treatment (EPSDT) benefit offers comprehensive and preventive health care services, including health education, for children <21 years of age who are enrolled in Medicaid, no benefit that specifically targets proper payment for exercise programming currently exists. 139 As a result, this probably has a deleterious impact on obtaining quality exercise programming in this vulnerable population. Consequently, this fails to meet the United States Preventative Services Task Force (USPSTF) recommendations for the treatment of children and adolescents with overweight and obesity. 123 Given the lack of training that clinicians and other health care personnel receive in exercise prescription,140-142 this goal may best be addressed by having the clinician or other relevant health care personnel refer the child or adolescent with obesity to a certified exercise programming professional, the latter of whom is then appropriately compensated for her/his services. Unfortunately, in both the public and private sector, a lack of appropriate reimbursement continues to be a challenge for obesity and treatment services in children and adolescents with obesity. 143
Strengths and Limitations
From the authors’ perspective, the major strengths of the current systematic review with meta-analysis include (1) the focus on studies in children and adolescents with obesity, (2) the multiple CVD risk factors examined, (3) use of the most robust methods currently available for conducting a systematic review with aggregate data meta-analysis,76,100,104,105,118-121 including the calculation of 95% PI for estimating what result one might expect if they conducted their own RCT, 110 (4) suggestions for researchers in the conduct and reporting of future RCTs on exercise and CVD risk factors in children and adolescents with obesity, and (5) suggestions for clinicians and other health care personnel, as well as policymakers, for making more informed decisions regarding exercise in the treatment of children and adolescents with obesity.
In addition to strengths, there are several potential limitations that should be mentioned. First, given the collective lack of data available, a post hoc decision was made to not conduct any type of meta-regression analysis. As a result, potential covariates that might have affected the overall results for each outcome within each type of intervention were not conducted. However, meta-regression within the context of an aggregate data meta-analysis does not support causal inferences because covariates are not randomly assigned in studies. 144 Therefore, any potential associations observed would have needed to be tested in original RCTs. 144 Second, given the lack of studies available, we were unable to examine the effects of strength training-only interventions when limited to children and adolescents with obesity. Third, while many statistical tests were conducted, no adjustments were made for such. As a result, some findings could have been nothing more than the play of chance. However, common to most aggregate data meta-analyses, no statistical adjustments were made for multiple testing because of concerns about missing possibly important findings that could be tested in original RCTs. 116 Fourth, since this was an aggregate data meta-analysis, the potential for ecological fallacy, specifically Simpson’s Paradox, exists. 145 Consequently, the possibility exists that the findings observed at the group level in the current study would not be applicable at the individual level of the child or adolescent. While an individual participant data (IPD) meta-analysis would avoid this limitation, such an approach has to be considered with respect to (1) the inability to obtain IPD from original trial investigators,146-151 (2) the loss of power and increased risk of bias with fewer eligible studies, (3) the substantially increased costs (up to 8 times greater) associated with conducting an IPD meta-analysis,151,152 and (4) the general lack of differences in overall results observed between aggregate and IPD meta-analyses.152-157 Finally, like any meta-analysis, the limitations of the included studies carry over to the current meta-analysis.
Conclusions
The results of the current systematic review with meta-analysis of RCTs suggest that exercise, particularly aerobic exercise, as well as combined aerobic and strength training, is associated with improvements in multiple CVD risk factors among children and adolescents with obesity. However, the generally low strength of evidence suggests a need for future well-designed and conducted RCTs on the effects of exercise, especially strength training, in children and adolescents.
CME/CE Article Quiz
American College of Lifestyle Medicine (ACLM) members can earn FREE CME/CE credit by reading this approved CME/CE article and successfully completing the online CME/CE activity. Non-members can earn CME/CE for $40 per article. Visitlifestylemedicine.org to join the ACLM.
AJLM CME/CE Articles and Quizzes are offered online only through the American College of Lifestyle Medicine and are accessible at lifestylemedicine.org/store. ACLM Members can enroll in the activity, complete the quiz, and earn this CME/CE for free. Non-members will be charged $40 per article.
A Passing score of 80% or higher is required in order to be awarded the CME/CE credit.
Supplemental Material
sj-pdf-1-ajl-10.1177_1559827620988839 – Supplemental material for Exercise and Cardiovascular Disease Risk Factors in Children and Adolescents With Obesity: A Systematic Review With Meta-Analysis of Randomized Controlled Trials
Supplemental material, sj-pdf-1-ajl-10.1177_1559827620988839 for Exercise and Cardiovascular Disease Risk Factors in Children and Adolescents With Obesity: A Systematic Review With Meta-Analysis of Randomized Controlled Trials by George A. Kelley, Kristi S. Kelley and Russell R. Pate in American Journal of Lifestyle Medicine
Supplemental Material
sj-pdf-2-ajl-10.1177_1559827620988839 – Supplemental material for Exercise and Cardiovascular Disease Risk Factors in Children and Adolescents With Obesity: A Systematic Review With Meta-Analysis of Randomized Controlled Trials
Supplemental material, sj-pdf-2-ajl-10.1177_1559827620988839 for Exercise and Cardiovascular Disease Risk Factors in Children and Adolescents With Obesity: A Systematic Review With Meta-Analysis of Randomized Controlled Trials by George A. Kelley, Kristi S. Kelley and Russell R. Pate in American Journal of Lifestyle Medicine
Supplemental Material
sj-pdf-3-ajl-10.1177_1559827620988839 – Supplemental material for Exercise and Cardiovascular Disease Risk Factors in Children and Adolescents With Obesity: A Systematic Review With Meta-Analysis of Randomized Controlled Trials
Supplemental material, sj-pdf-3-ajl-10.1177_1559827620988839 for Exercise and Cardiovascular Disease Risk Factors in Children and Adolescents With Obesity: A Systematic Review With Meta-Analysis of Randomized Controlled Trials by George A. Kelley, Kristi S. Kelley and Russell R. Pate in American Journal of Lifestyle Medicine
Supplemental Material
sj-pdf-4-ajl-10.1177_1559827620988839 – Supplemental material for Exercise and Cardiovascular Disease Risk Factors in Children and Adolescents With Obesity: A Systematic Review With Meta-Analysis of Randomized Controlled Trials
Supplemental material, sj-pdf-4-ajl-10.1177_1559827620988839 for Exercise and Cardiovascular Disease Risk Factors in Children and Adolescents With Obesity: A Systematic Review With Meta-Analysis of Randomized Controlled Trials by George A. Kelley, Kristi S. Kelley and Russell R. Pate in American Journal of Lifestyle Medicine
Footnotes
Authors’ Note
Data are available from the corresponding author on reasonable request.
Author Contributions
GAK was responsible for the conception and design, acquisition of data, analysis and interpretation of data, drafting the initial manuscript, and revising it critically for important intellectual content. KSK was responsible for the conception and design, acquisition of data, and reviewing all drafts of the manuscript. RRP was responsible for the conception and design, interpretation of data, and reviewing all drafts of the manuscript. All authors read and approved the final manuscript.
Declaration of Conflicting Interests
The author(s) declared no potential conflicts of interest with respect to the research, authorship, and/or publication of this article.
Funding
The author(s) disclosed receipt of the following financial support for the research, authorship, and/or publication of this article: This study was funded by the American Heart Association, Grant #17GRNT33630158 (GA Kelley, Principal Investigator). The content of this article is solely the responsibility of the authors and does not necessarily represent the official views of the American Heart Association.
Ethical Approval
Not applicable, because this article does not contain any studies with human or animal subjects.
Informed Consent
Not applicable, because this article does not contain any studies with human or animal subjects.
Trial Registration
Not applicable, because this article does not contain any clinical trials.
Supplemental Material
Supplemental material for this article is available online.
References
Supplementary Material
Please find the following supplemental material available below.
For Open Access articles published under a Creative Commons License, all supplemental material carries the same license as the article it is associated with.
For non-Open Access articles published, all supplemental material carries a non-exclusive license, and permission requests for re-use of supplemental material or any part of supplemental material shall be sent directly to the copyright owner as specified in the copyright notice associated with the article.