
Abstract
Objectives
Cells and organisms respond dynamically to environmental stimuli such as radiation and chemicals. Depending on the assay system, these responses have been described as hormesis, adaptive responses, J-shaped responses, and biphasic responses. In micronucleus assays using cultured cells, however, the intrinsically low baseline frequency of micronuclei makes it difficult to obtain a clear J-shaped dose–response curve characteristic of hormesis. To address this limitation, we conducted challenge and cross-challenge experiments.
Methods
In challenge tests, cells were first exposed to low priming doses and then to a high challenging dose. In cross-challenge tests, cells were pretreated with low doses of one chemical (e.g., mitomycin C) and subsequently exposed to a high dose of another (e.g., AF-2).
Results
In both approaches, pre-exposure suppressed micronucleus formation induced by the high dose. δ-Plot analysis was applied to quantify the Yonezawa effect, a well-established radiation-induced adaptive response. The data fit the δ-plot model well, indicating that the observed effects are consistent with hormesis as preconditioning.
Conclusion
Because “adaptive response” is overly broad and terms such as “J-shaped response” or “biphasic response” are overly narrow, we propose integrating these phenomena under the concept of hormesis, providing a unified framework for interpreting low-dose biological effects.

Introduction
Throughout the approximately 4 billion years of evolutionary history, organisms have been continuously exposed to radiation. Radiation levels 4 billion years ago were nearly 5 times higher than they are today. 1 It has been suggested that radiation may have contributed to both chemical and biological evolution. 2 All organisms are radioactive to some extent because they continuously take in radioactive elements such as K-40 and C-14. In humans, internal radiation exposure alone amounts to approximately 9,000 Bq/sec, and when external exposure is included, it totals about 20,000 Bq/sec.3,4
The primary effect of low-dose radiation is its reaction with water to produce reactive oxygen species (ROS), which means that the biological effects of low-dose radiation are mediated through ROS as chemical agents. ROS are produced during normal cellular metabolism in mitochondria and microsomes (specifically by cytochrome P450 enzymes).5,6 ROS act as signaling molecules, and in cells the Keap1-Nrf2 pathway is capable of detecting them. 7 This pathway contributes to biological defense against oxidative stress derived from ROS and electrophilic foreign substances. The glutathione (GSH) system plays a crucial role in managing oxidative stress. The most rapid adaptive response to such stress involves direct enzyme modification, which increases GSH levels or activates GSH-dependent protective enzymes. This response can be achieved through the up-regulation of Nrf2-mediated expression of enzymes involved in GSH synthesis. 8 The enzyme heme oxygenase-1 (HO-1) exhibits a radioadaptive response. A priming dose of X-rays upregulated the transcription and translation of HO-1, which is regulated by Nrf2. 9 The NF-κB/IκB system is also involved in ROS regulation but is broadly associated with inflammation, immunity, cell division, differentiation, development, and apoptosis. 10
Organisms that have evolved alongside radiation naturally exhibit genetic responses to it. 11 Luckey’s comprehensive work, which cites 1,269 references, includes numerous examples of radiation hormesis across various life forms, including bacteria, protozoa, plants, and animals. 12
On the other hand, it is estimated that we are exposed to tens of thousands of chemical substances. There are numerous examples of cells and organisms exhibiting hormesis in response to these chemicals, showing stimulation at low doses and inhibition at high doses. Southam and Ehrlich discovered that an extract from wood showed growth stimulation at low doses and growth inhibition at high doses for certain types of fungi, and they named this phenomenon “hormesis”. 13 Subsequently, Townsend and Luckey searched pharmaceutical literature and compiled a list of over 100 substances that showed biphasic responses with stimulation at low doses and inhibition at high doses. 14 Calabrese and Blain expanded on this work, documenting over 900 hormetic responses for radiation, radioactive substances, inorganic compounds, and organic compounds. 15 Based on these extensive studies, hormesis is now considered to be a ubiquitous phenomenon in the biological world.
Our collaborative study group within the Mammalian Mutagenicity Study Group (MMS) of the Japanese Environmental Mutagen and Genome Society (JEMS) investigated thresholds for mutagens. Using cell viability and proliferation as endpoints, we observed reverse U-shaped hormetic responses.16,17 However, when examining micronucleus tests, typical J-shaped hormetic responses were difficult to obtain because of the intrinsically low spontaneous frequency of micronuclei (approximately 1%). To address this limitation, we conducted challenge tests involving low-dose pre-treatment followed by high-dose post-treatment, as well as cross-challenge tests in which different substances were used for pre- and post-treatment. Both approaches demonstrated suppression of micronucleus induction by high-dose exposures.
We initially submitted a manuscript describing these findings as hormetic responses in the micronucleus test, which was released as a preprint. 18 However, the paper was rejected, with reviewers arguing that the effects represented adaptive responses rather than hormesis. We subsequently revised the terminology from “hormetic” to “adaptive” and succeeded in publishing the work in another journal. 19 This outcome reinforced the prevailing view that hormesis and adaptive responses are distinct, even mutually exclusive, concepts.
In contrast, we consider hormesis and adaptive responses to be essentially equivalent phenomena. The aim of this paper is therefore to reexamine this assumption and propose a new perspective: that hormesis and adaptive responses are fundamentally the same. To this end, we reanalyzed our data, including part of the raw micronucleus test data from our previous study (as specified in the figure legends), 19 using δ-plot analysis, which quantifies the Yonezawa effect—a well-established form of radiation-induced adaptive response. The results obtained with mutagenic chemicals (EMS, AF-2, and MMC) fitted the δ plot effectively, showing that the observed adaptive responses are consistent with the definition of hormesis as preconditioning. Since “adaptive response” is broad and non-specific, whereas terms such as “biphasic,” “U-shaped,” and “bimodal” responses describe more restricted patterns, we propose that these phenomena can be integrated into the broader and more clearly defined concept of hormesis. This integration may provide a unifying framework for interpreting dose-dependent biological effects.
Methods
Experimental Design
Typical mutagens were selected as test chemicals based on previous studies. Prior to the micronucleus test, dose-finding experiments were conducted using several dose levels (see Figure 1). From these preliminary experiments, we identified doses that did not induce micronuclei and doses that clearly induced micronuclei. Based on these results, the priming and challenging doses were determined. In principle, three challenging doses were used, with a dilution factor of 2 between successive doses. For the control groups, culture medium was added under the same cultivation conditions as the treated groups, but without test chemicals. Schematic representation of the Yonezawa effect, slightly adapted for the micronucleus version from Fornalski et al.
20
Cells were treated with a priming dose (D1) that does not induce micronuclei and a certain period after exposure to the D1 dose, exposed to a high dose (D2) that induces micronuclei. The parameter δ represents the difference between the number of micronuclei produced by a single dose of D2 (without the priming dose) and the number produced by the combination of D1 + D2 (with the priming dose). δ is quantified by the equation δ = 1 − N1+2/N2, where N2 is the number of micronuclei induced by D2 alone and N1+2 is the number induced by the combination of D1 + D2. In this study, the micronucleus parameter is expressed as the micronucleus ratio, which is the ratio of the number of micronuclei induced by the challenge treatments to the number of micronuclei in the control, with the control ratio set to unity
Cells
L5178Y cells are recommended for the detection of micronuclei in vitro in an OECD guideline. 21 Cells were obtained from the JCRB Cell Bank, National Institutes of Biomedical Innovation, Health and Nutrition, Japan. Cells were grown in Petri dishes for subculturing and in well plates for testing. These cells were maintained in RPMI 1640 medium supplemented with penicillin and streptomycin (25 μg/mL) and enriched with 10% fetal calf serum. Cells were kept in a 5% CO2 incubator at 37°C. Cell counts were performed using a hemocytometer.
Chemicals
Acridine orange (AO, CAS: 494-38-2), Mitomycin C (MMC, CAS: 1950-07-7), and (Z)-2-(2-furyl)-3-(5-nitro-2-furyl) prop-2-enamide (AF-2, CAS: 3688-53-7) were procured from Wako Pure Chemical Industries, Ltd., Osaka, Japan. Ethyl methanesulfonate (EMS, CAS: 62-50-0) was obtained from NAKALAI TESQUE, INC., Kyoto, Japan. Phosphate-buffered saline (PBS) was supplied by Sigma-Aldrich Co. LLC, St. Louis, MO. To administer chemicals to the cells, solutions were prepared by either directly dissolving them in the culture medium or creating a 10-fold concentrated chemical solution. The latter was then used to generate serial dilutions with a dilution factor of 2. Subsequently, the prepared solutions were added to the cell culture medium at a ratio of 1:10.
Preparation of AO-Coated Slides for Supravital Staining Method
An AO stock solution was prepared by dissolving 10 mg of AO in 1 mL of PBS. The stock solution was diluted to a concentration of 1 mg/mL with PBS just before use. An aliquot (20 μL) of the solution was placed between two glass slides, which were then separated by pulling them apart horizontally in opposite directions. The AO-coated slides were quickly dried using a hair dryer. These AO-coated slides can be stored at room temperature in a dark environment for an extended period until needed. An aliquot (20 μL) of a cell suspension was placed onto the AO-coated slide, which was then covered with a cover slip (24 x 40 mm). Excess fluid was removed by gently pressing the slide between pieces of paper tissue. In cases where cell numbers were expected to be low due to toxic treatments, a larger volume of the cell suspension (e.g., 100 μL) was transferred to an Eppendorf tube. Cells were concentrated by centrifugation at 3,000 rpm for 30 sec and then resuspended in a smaller volume of medium (e.g., 20 μL). Code numbers were sealed with a “Post-it” note. Micronuclei were examined under a fluorescence microscope using a B excitation unit (450-490 nm) in conjunction with a broadband filter that cuts off light at wavelengths less than 520 nm.
Statistics
To evaluate statistical differences, a table developed by Kastenbaum and Bowman was used. 22 For easy comparison, a computer-generated table was created, displaying significance levels of 0.01 and 0.05, P-values ranging from 0.01 to 0.99, along with the corresponding number of micronuclei from 1 to 1000.
Results
Rationale: The Scheme of the Yonezawa Effect
Figure 1 illustrates the schematic representation of the Yonezawa effect, also known as the priming dose effect.23,24 This effect was discovered when mice that had been pre-exposed to a low dose of radiation (priming dose), insufficient to cause health effects, were subsequently able to withstand a later lethal high dose of radiation (challenging dose). In the present study, we applied this concept to the analysis of micronucleus test results using chemical agents.
Difficulty in Detecting Hormesis With a Typical Biphasic, J-Shaped Dose Response Curve
Before conducting the micronucleus tests, dose-finding experiments are typically performed. Figure 2 illustrates dose-finding tests with MMC (A), EMS (B), and AF-2 (C). The main action of MMC, an alkylating agent, is to form cross-links between double-stranded DNA and inhibit DNA replication and cell division. EMS is also an alkylating agent and causes single-strand DNA breaks. AF-2 is a type of food additive that had been used as a food preservative since 1965. Its mutagenicity and carcinogenicity were detected, and its use was banned in 1974. These compounds exhibited a slight reduction in micronuclei at low doses, suggesting a J-shaped dose-response curve, which is characteristic of hormesis. However, this reduction was not statistically significant, and hormesis could not be confirmed with certainty. Given that the background level of micronuclei is around 1%, detecting a further reduction due to a hormetic response proves challenging. Additionally, high-dose treatments led to the appearance of numerous pycnotic cells and cells with amorphous nuclei, complicating the examination of micronuclei. Dose-finding tests with MMC (A), EMS (B), and AF-2 (C). (A): L5178Y cells (2.5 × 10⁵ cells/well/0.5 mL) were treated with MMC for 24 h in a 24-well plate. Following treatment, cells were transferred to an Eppendorf tube, centrifuged at 3,000 rpm for 30 sec, and cultured in 500 μL of fresh medium. Twelve hours after washing, 200 μL of the cell suspension was transferred to an Eppendorf tube. Cells were again centrifuged at 3,000 rpm for 30 seconds, suspended in 50 μL of fresh medium, and 20 μL were used to prepare specimens. Two specimens were prepared from each treatment, and 1,000 cells per specimen were examined. The incidence of micronuclei per 1,000 cells was as follows: 7 and 7, 8 and 8, 5 and 6, 5 and 7, 5 and 6, and 14 and 15 for 0, 0.125, 0.25, 0.5, 1.0, and 2.0 ng/mL, respectively. (B): L5178Y cells (2 × 10⁵ cells/well/0.5 mL) were plated in a 24-well plate. EMS was added to the cultures 24 h after plating. Specimens were prepared 30 h after EMS addition, and 1,000 cells per specimen were examined. The incidence of micronuclei per 1,000 cells was as follows: 12, 8, 7, 10, 16, 56, 160, and 13 for 0, 31.3, 62.5, 125, 250, 500, 1,000, and 2,000 μg/mL, respectively. (C): A total of 2.5 x 10⁵ L5178Y cells per well (0.5 mL) were seeded in a 24-well plate and treated with AF-2. Specimens were prepared 24 h post-treatment, and 1,000 cells per specimen were analyzed. In the control group, the incidence of micronuclei was 4 per 1,000 cells (0.4%). No statistically significant differences were observed between the treated groups and the control in this dose-finding test, although a J-shaped response curve was suggested. Asterisks * and ** denote statistically significant differences between treatments and the control at P < 0.05 and P < 0.01, respectively, as determined using the table by Kastenbaum and Bowman
Challenge Tests With AF-2, EMS, and MMC
Detecting hormetic responses directly in the micronucleus test, where the background incidence is low, proved challenging (Figure 2). Therefore, challenge tests were conducted in which cells initially exposed to low doses (priming doses) insufficient to induce micronuclei were subsequently exposed to a high dose (challenging dose) capable of inducing micronuclei (Figure 3). AF-2 (Figure 3A), EMS (Figure 3B), and MMC (Figure 3C) demonstrated that micronucleus induction by the challenging dose was suppressed by the priming doses. Challenge tests with AF-2 (A), EMS (B), and MMC (C). (A): L5178Y cells (2.5 × 10⁵ cells/well/0.5 mL) were treated with priming doses of AF-2 at 0.25, 0.5, and 1.0 μg/mL, followed by a challenging dose of 20 μg/mL after 12 h. Cells transferred to an Eppendorf tube were then centrifuged at 3,000 rpm for 30 sec and cultured in 500 μL of fresh medium. Specimens were prepared 18 h after washing. Two specimens were prepared from each treatment, and 1,000 cells per specimen were examined. The incidence of micronuclei in the control was 7/2,000 cells (0.35%). Applying the Yonezawa effect scheme (Figure 1) to Figure 3A, the δ values for priming doses of 0.25, 0.5, and 1.0 μg/mL were 0.202, 0.270, and 0.405, respectively. (B): The method was the same as in A, except that cells were pretreated with EMS at 12.5, 25, and 50 μg/mL and challenged with 500 μg/mL. The incidence of micronuclei in the control was 19/2,000 cells (0.95%). Applying the Yonezawa effect scheme (Figure 1) to Figure 3B, the δ values for priming doses of 12.5, 25, and 50 μg/mL were 0.141, 0.239, and 0.301, respectively. The raw micronucleus test data are from our previous study.
19
(C): The method was the same as in A. Cells were treated with priming doses of MMC at concentrations of 0.25, 0.5, and 1.0 ng/mL. After 12 h, the cells were challenged with 10 ng/mL MMC. Two specimens from each treatment group were prepared 18 hours after the challenge, and 1,000 cells per specimen were analyzed. In the control group, the incidence of micronuclei was 23 per 2,000 cells (1.15%). When the Yonezawa plot was applied to the data, the δ values for priming doses of 0.25, 0.5, and 1.0 ng/mL were 0.44, 0.34, and 0.38, respectively. Asterisks * and ** denote statistically significant differences between treatments and the control at P < 0.05 and P < 0.01, respectively, as determined using the table by Kastenbaum and Bowman
Cross-Challenge Tests With AF-2, MMC, and EMS
In addition to the challenge tests (Figure 3), cross-challenge tests were conducted using AF-2, MMC, and EMS. Cells were first primed with AF-2 and subsequently challenged with MMC (Figure 4A). The results exhibited similar response patterns to those observed in the challenge tests (Figure 3). Conversely, when cells were initially primed with MMC and then challenged with AF-2, comparable results were obtained (Figure 4B). Likewise, when cells were first primed with MMC and subsequently challenged with EMS, comparable results were obtained (Figure 4C). Similar outcomes were also observed when cells were primed with EMS and then challenged with MMC (data not shown). The results of the challenging tests (Figure 3) and cross-challenging tests (Figure 4) suggest that xenobiotic substances such as AF-2, EMS, and MMC are potentially processed through common pathways, specifically the Keap1-Nrf2 and/or NF-κB/IκB pathways. Cross-challenge tests with AF-2 and MMC. (A): L5178Y cells (2.5 x 10⁵ cells/well/0.5 mL) were treated with priming doses of AF-2 at concentrations of 0.25, 0.5, and 1.0 μg/mL. After 12 h, the cells were challenged with MMC at a concentration of 20 ng/mL. Cells transferred to an Eppendorf tube were centrifuged at 3,000 rpm for 30 seconds and then cultured in 500 μL of fresh medium. Specimens were prepared 18 h after washing. Two specimens were prepared per treatment, and 1,000 cells per specimen were examined. The incidence of micronuclei in the control group was 11/2,000 cells (0.55%). When applying the Yonezawa effect (Figure 1) to the combination of AF-2 and MMC (Figure 4A), the δ values for priming doses of 0.25, 0.5, and 1.0 μg/mL of AF-2 were 0.253, 0.269, and 0.284, respectively. The raw micronucleus test data are from our previous study.
19
(B): The procedure was the same as in A, except that cells were pretreated with 0.25, 0.5, and 1.0 ng/mL of MMC and challenged with AF-2 at 20 μg/mL. The incidence of micronuclei in the control group was 9/2,000 cells (0.45%). The δ values for priming doses of 0.25, 0.5, and 1.0 ng/mL of MMC were 0.470, 0.514, and 0.647, respectively. The raw micronucleus test data are from our previous study.
19
(C): The method was similar to A, except that cells were pre-treated with MMC at 0.2 and 1.0 ng/mL and then challenged with EMS at 500 μg/mL. The incidence of micronuclei in the control group was 25 per 2,000 cells (1.25%). The δ values for priming doses of MMC at 0.2 and 1.0 ng/mL were 0.64 and 0.19, respectively. Asterisks * and ** indicate statistically significant differences between treatments and the control, with P < 0.05 and P < 0.01, respectively, as determined using the table by Kastenbaum and Bowman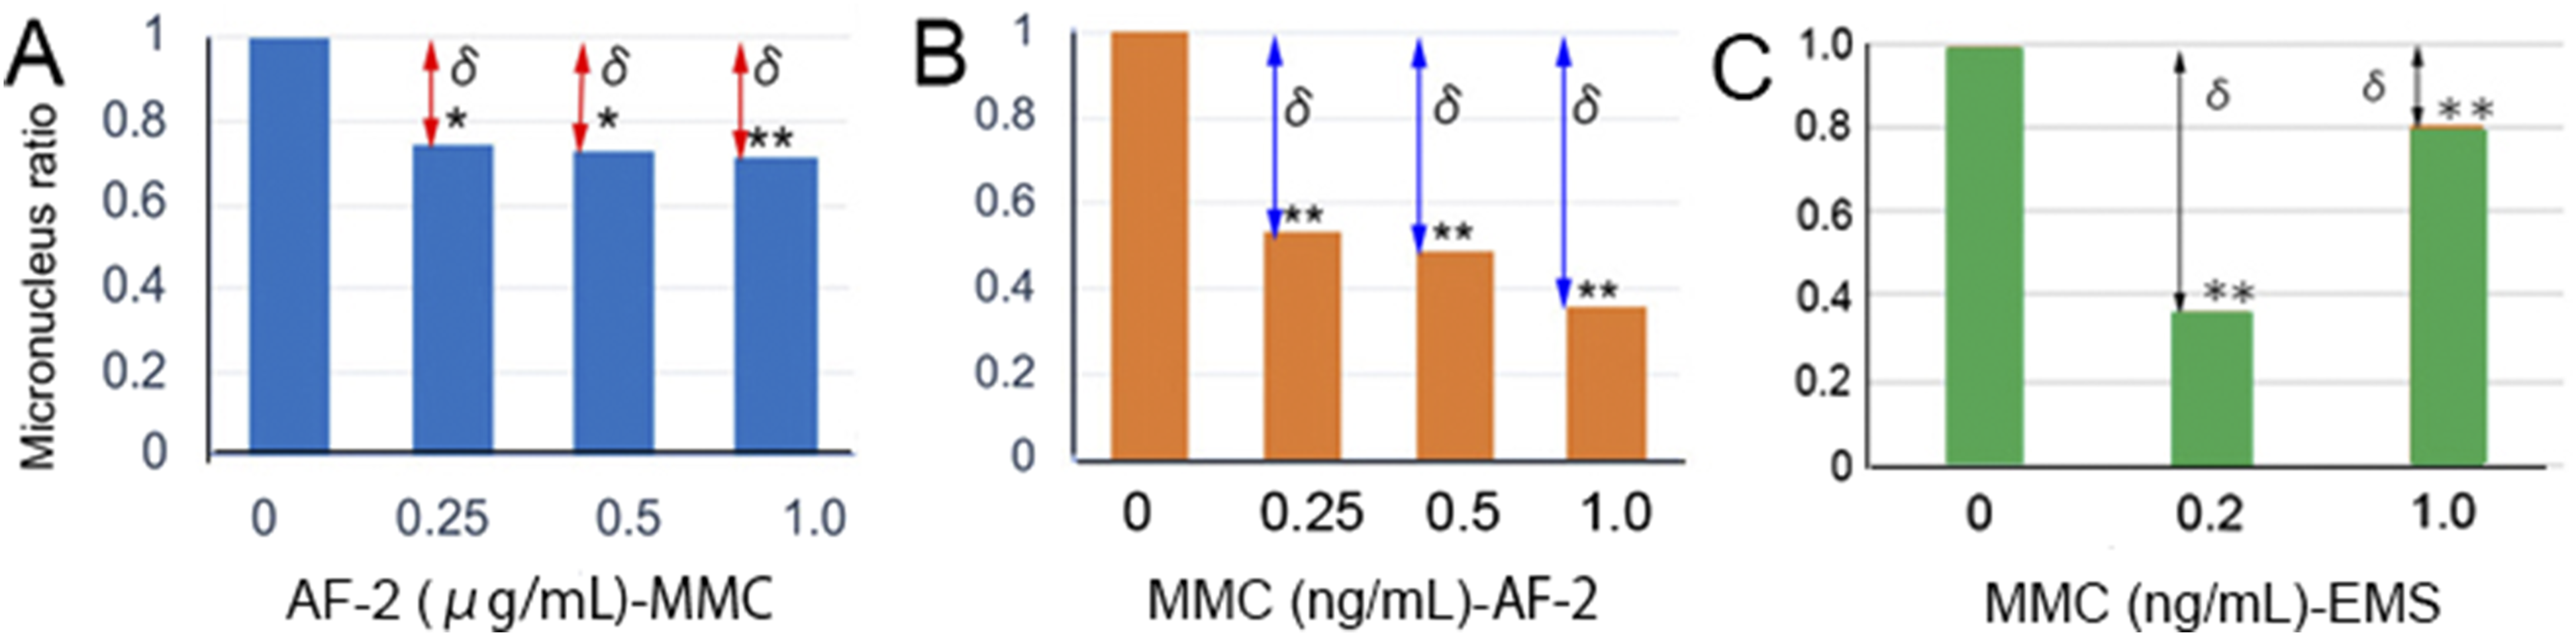
Discussion
Hormesis is a concept that describes the nature of dose-response relationships in biological systems as showing a stimulatory response at low doses and an inhibitory response at higher doses. 25 This definition applies to both radiation and chemicals.
Hormesis is observed in various endpoints across a wide range of life forms, including bacteria, protozoa, plants, and animals.12,14,15 Dose-response relationships in hormesis are non-linear, and dose-response curves have been described as biphasic, bell-shaped, U-shaped, inverted U-shaped, J-shaped, diphasic, bimodal, bidirectional, sinusoidal, and more. 26 Over 50 researchers studying these diverse dose-response patterns have recommended adopting more consistent terminology. They proposed the common use of the term “hormesis,” including specific categories like physiological conditioning hormesis, radiation conditioning hormesis, and chemical conditioning hormesis when preconditioning is involved. 27 Later, Calabrese, the lead author of the referenced paper, argued that “Preconditioning is hormesis”.28,29
The above definition corresponds exactly to the Yonezawa effect (Figure 1).23,24 The “Yonezawa Effect” is an example of preconditioning, where a small preconditioning dose administered before a high (challenging) dose protects against the harmful effects of the latter, and this can be considered a hormetic response. In this context, the hormetic responses observed in our micronucleus tests (Figures 3 and 4) should not be dismissed as merely adaptive responses.
In contrast, adaptive response is a broad and general concept encompassing most biological responses that deviate from a linear dose-response relationship, as also seen in hormesis. Unlike hormesis, adaptive responses are typically associated with generalized terminology like radioadaptive response or chemical adaptive response. A simplified definition is: “Radioadaptive response describes phenomena where small conditioning doses of ionizing radiation reduce the detrimental effects of subsequent higher IR doses”. 30 This definition can be precisely applied to the concept of hormesis. Minor changes of words used in this definition can be applied to chemical adaptive response as “Chemical adaptive response describes phenomena where small conditioning doses of chemicals reduce the detrimental effects of subsequent higher doses.”
Combining the above discussions, hormesis can be simply defined as either biological systems showing a stimulatory response at low doses and an inhibitory response at higher doses, or as small preconditioning doses reducing the detrimental effects of subsequent higher doses. In essence, there is no significant need to distinguish between hormesis and adaptive response. Consequently, whether you refer to a phenomenon as hormesis or adaptive response depends on how you define these terms.
Devic et al demonstrated that hormesis and adaptive response could be explained together through the mediation of ATM protein 31. It is interesting to note that their scheme of adaptive response closely resembles the δ plot (Figure 1). 32
Given that biological systems are complex and may not always exhibit a straightforward low-dose-stimulation and high-dose-inhibition relationship (see Figure 2), The definition that as small preconditioning doses reduce the detrimental effects of subsequent higher doses (see Figures 3 and 4) seems often more applicable. While these definitions suggest that hormesis is induced dose-dependently, the actual induction of hormesis appears to be mediated by the production of communication signals triggered by treatments and the receivers of these signals.31,33 Consequently, the induction of hormesis may vary depending on the specific cells, organisms, or detection systems involved. An example is that the sensitivity of the micronucleus test differs among mouse strains. 34 In addition, different radioadaptive responses were observed when wild-type p53 cells and p53-deficient cells derived from the human lung cancer H1299 cell line were irradiated with X-rays. 35
Yonezawa et al demonstrated a radiation-induced adaptive response in mice, where an initial low-dose radiation (priming dose, D1 in Figure 1) reduced acute lethality from a subsequent high-dose radiation (challenging dose, D2 in Figure 1). The survival rates of mice that received both D1 and D2 were higher than those that received only D2. Key factors in the Yonezawa effect include D1, D2, the time interval between D1 and D2, and the endpoint (mouse survival). The framework of the Yonezawa Effect, as shown in Figure 1, can essentially be applied to the micronucleus test (Figures 3 and 4). Therefore, we provided evidence for hormesis on micronucleus induction in the mouse lymphoma cell line L5178Y using EMS, AF-2, and MMC.
As for the mechanisms underlying preconditioning, our previous enzyme-induction experiments provide relevant insights. 18 TK6 cells were treated with EMS, H2O2, and MMC, and the expression of six genes—GADD45A, GSTP1, MCM, p21, TOP2A, and TP53—with GAPDH as an internal control, was examined by RT-PCR at 4, 10, and 24 h after treatment. EMS did not induce micronuclei at 31, 62, 125, or 250 μg/mL (Figure 2B). No gene induction was observed 4 h after treatment with 2, 5, 10, 20, 50, 100, 200, or 500 μg/mL EMS. However, at 10 h, p21 expression began to increase at doses above 20 μg/mL, and GADD45A at doses above 200 μg/mL. After 24 h, both p21 and GADD45A clearly increased at doses above 20 μg/mL. Following H2O2 treatment, both p21 and GADD45A were induced at doses above 10 μg/mL at 10 h, whereas induction was minimal at 4 and 24 h. In contrast, gene induction by MMC was greatest at 24 h; p21 expression began to increase at doses above 5 μg/mL and GADD45A at doses above 20 μg/mL. The dose levels required for gene induction were close to those for micronucleus induction. These preliminary findings suggest several important aspects of preconditioning: (1) gene induction patterns are chemical-dependent; (2) in the case of EMS, certain genes are induced at approximately one-tenth the dose required for micronucleus induction; and (3) gene induction is both time- and dose-dependent. Together, these results support the interpretation that preconditioning may, at least in part, reflect a preparatory cellular response activated in anticipation of forthcoming hazards.
The micronucleus test described here differs from the mouse survival test in several key ways. 1) The appearance of micronuclei is time- and dose-dependent—micronuclei tend to appear earlier with low-dose treatments, later with high-dose treatments, and disappear after a prolonged period. This necessitates determining the optimal expression time. The micronucleus test using suspended cells is particularly convenient, as samples can be collected consecutively (e.g., 18, 24, 30, and 36 h after treatment) from the same culture to estimate the optimal expression time. 2) The continuous presence of chemicals in cell cultures may affect both cell division and micronucleus formation, as demonstrated in the EMS experiment (Figure 2B), especially at higher doses. Some chemicals, such as microtubule disruptors like colchicine, complicate the micronucleus test due to their specific effects on cell division. In such cases, the chemicals can be removed by washing, as shown in the MMC experiment (Figure 2A). 3) When the toxicity of a test chemical reduces cell numbers, the cells can be concentrated through brief centrifugation, as described in the “Preparation of AO-Coated Slides for Supravital Staining” section in Materials and Methods. 4) Supravitally stained cells can be stored at -80°C for a month or longer until examination.
The δ plot can also be effectively applied to cross-adaptive responses between radiation and chemicals.36-38 These adaptive responses can similarly be referred to as hormesis. Very recently, one of the authors (SS) comprehensively reviewed hormesis from a broader perspective. 39
Conclusion
Cells and organisms respond dynamically to environmental stimuli such as radiation and chemicals, and these responses have been variously described as hormesis, adaptive responses, J-shaped responses, biphasic responses, and others. The Yonezawa effect—a radiation-induced adaptive response in which low priming doses mitigate the effects of subsequent higher challenging doses—represents a typical preconditioning phenomenon. In micronucleus tests with cultured cells, however, the intrinsically low baseline frequency of micronuclei hampers the demonstration of a clear J-shaped dose–response curve characteristic of hormesis. To overcome this limitation, we conducted challenge and cross-challenge experiments, where cells were pretreated with low doses of the same or different agents prior to high-dose exposure. Application of δ plot analysis, which quantifies the Yonezawa effect, showed that the results fit the model effectively. Since hormesis is defined to encompass both low-dose stimulation/high-dose inhibition and preconditioning effects, adaptive responses and hormesis are not separate entities but represent overlapping aspects of the same biological phenomenon. Thus, adaptive responses—though broad and nonspecific in concept—can be integrated into the unifying framework of hormesis.
Footnotes
Author’s Note
All authors are members of the Collaborative Study Group of Thresholds for Mutagens, a subgroup of the Mammalian Mutagenicity Study Group (MMS), Japanese Environmental Mutagen and Genome Society (JEMS).
Acknowledgements
On July 1, 2023, the Asia Research Awards, an organization headquartered in India, awarded SS the “International Distinguished Scientist Award” among scientists for his research on “biological effects of low-dose radiation.” On October 1, 2023, the organization awarded the “Asia’s Outstanding Researcher Award” to SS among scientists, researchers, doctors, and professors for his work on “research on radiation hormesis.” As a year-round recipient, the organization awarded SS “the International Innovative Scientist of the Year Award” on March 16, 2024 for his research on “radiation and chemical hormesis.” On October 20, 2024, the organization awarded the “Excellent Lifetime Achievement of the Year Award” to SS for his specialization in genes and the environment. On August 3, 2025, the organization awarded the “International Best Researcher Award” to SS for his work on “chemical hormesis research.”
Author Contributions
Funding
The authors received no financial support for the research, authorship, and/or publication of this article.
Declaration of Conflicting Interests
The authors declared no potential conflicts of interest with respect to the research, authorship, and/or publication of this article.
Data Availability Statement
The datasets used and/or analyzed during the current study are available from the corresponding author upon reasonable request.
Submission
S.S. submits this manuscript on behalf of all authors.