
Abstract
Background
We have been conducting a collaborative study on the thresholds of mutagens. In our previous examinations of cell activity and cell proliferation as endpoints, both displayed hormesis. This time, we conducted experiments to determine thresholds using the micronucleus test as an endpoint.
Methods
The micronucleus test was conducted using Chinese hamster CHL/IU cells and mouse lymphoid L5178Y cells. Additionally, we conducted preliminary investigations into the gene expression using human TK6 cells.
Results
When adhesive CHL/IU cells were treated with mitomycin C (MMC), and the hormetic response was examined, hormesis was not observed clearly. When L5178Y cells were treated with methyl methanesulfonate (EMS), AF-2, MMC, and colchicine, all of them exhibited an adaptive response. Additionally, cross-adaptive responses using AF-2 and MMC or EMS and MMC were conducted, both combinations showed a cross-adaptive response. When the gene expression patterns of six genes were investigated by RT-PCR after treatment with MMC, EMS, and H2O2 using TK6 cells, two genes, GADD45 A and P21, were induced in a dose- and time-dependent manner.
Conclusion
Adaptive responses arise from preconditioning. As hormesis is inherently linked to preconditioning, adaptive responses observed in this study strongly suggest that hormesis was induced, hence existence of thresholds.
Introduction
The Japanese Environmental Mutagen and Genome Society (JEMS) was established in 1972, and in 1982, the Mammalian Mutagenesis Study Group (MMS) was formed as a subgroup of JEMS. Within MMS, various sub-subgroups were created, one of which was the Protocol Examination Group. This particular subgroup scrutinized nine protocols, including those from the U.S. Environmental Protection Agency (EPA), the Ministry of Health, Labor and Welfare of Japan (JMHW), the Organization for Economic Cooperation and Development (OECD), and others.
The examination revealed that these protocols were largely theoretical and lacked substantial empirical data. In response, the Protocol Examination Group organized the Collaborative Study Group for the Micronucleus Test (CSGMT), focusing on collecting extensive data using murine bone marrow.
The initial investigation addressed the sex differences in the micronucleus test, followed by examinations of strain differences, administration route disparities, effects of dosing times, and the utilization of peripheral blood through acridine orange supravital staining.1-5 This staining method proved valuable for long-term micronuclei examination without sacrificing animals. 6 The CSGMT’s achievements over the first decade were compiled. 7
Subsequently, the CSGMT expanded its scope to include liver and gastrointestinal tract micronucleus assays. 8 Numerous publications by CSGMT members significantly contributed to the development of an OECD guideline. 9
The current collaborative study was conducted as a subgroup study of MMS. Previous examinations, utilizing cell activity and cell proliferation as endpoints, have confirmed the occurrence of hormesis with a reverse U-shaped dose-response curve.10,11 In this study, we aimed to determine if a hormetic reaction also occurs in the micronucleus test. To achieve this, we initially scrutinized historical data acquired through a conventional method involving adhesive cells. The data revealed that, given the low background incidence of micronuclei, detecting further reductions due to a hormetic response was challenging. Consequently, we conducted a detailed examination using suspension cells, a more flexible method than that of fixed cells, to evaluate its efficacy and investigate the presence of adaptive responses. As preliminary data, we explored whether gene induction occurred following mutagenic treatments using RT-PCR.
Methods
Cell
The cells utilized in this study were those recommended in the OECD guideline, which was also consulted for methodology. 12 Chinese hamster cells (CHL/IU), with a doubling time of 18 h, were cultured in 6 cm diameter Petri dishes. Two types of media were used: Eagle’s minimal essential medium (MEM) and Dulbecco’s modified MEM, both supplemented with penicillin and streptomycin (25 μg/mL) and enriched with either 10% calf serum or fetal calf serum (FCS). Mouse lymphoma cells (L5178Y) were grown in Petri dishes for subculturing and in well-plates for testing. These cells were maintained in RPMI 1640 medium, supplemented with FCS and antibiotics. Human lymphoblast thymidine kinase heterozygote cells (TK6) were cultured with RPMI 1640 medium supplemented with the 10% FCS in 25 cm2 flasks. All cell cultures were maintained in a 5% CO2 incubator at 37°C. Cell counts were performed using a hemocytometer, unless otherwise stated.
Chemicals
Acridine orange (AO, CAS: 494-38-2), Mitomycin C (MMC, CAS: 1950-07-7), (Z)-2-(2-furyl)-3-(5-nitro-2-furyl) prop-2-enamide (AF-2, CAS: 3688-53-7), and hydrogen peroxide (H2O2) were procured from Wako Pure Chemical Industries, Ltd, Osaka, Japan. Ethyl methanesulfonate (EMS, CAS: 62-50-0) was obtained from NAKALAI TESQUE, INC, Kyoto, Japan. Phosphate buffered saline (PBS) and colchicine (CAS: 64-86-8) were supplied by Sigma-Aldrich Co LLC, St. Louis, MO. Cell counting kit-8 (CCK-8) was obtained from DOJINDO LABORATORIES, Kumamoto, Japan. To administer these chemicals to the cells, a solution was prepared by either directly dissolving them in the culture medium or creating a 10-fold concentrated drug solution. The latter was then used to generate serial dilutions with a dilution factor of 2. Subsequently, the prepared solution was added to the cell culture medium at a ratio of 1:10.
Observation of Micronuclei in CHL/IU Cells by Giemsa Staining
CHL/IU cells in Petri dishes were harvested by trypsinization (.25%, 2 mL). These cells were subjected to treatment with a hypotonic solution (.135 M KCl) for 5 min at room temperature. After the hypotonic treatment, cells were fixed using a cold fixative (.5 mL, methanol: acetic acid = 3:1) and then collected via centrifugation at 500 rpm for 5 min. Cells were subsequently subjected to additional rounds of fixation with 5 mL of the fixative, repeating this step three times. After the rounds, they were stored in a refrigerator for over 1 h. Finally, the fixed cells were suspended in 1 mL of a cold fixative (methanol: acetic acid = 99:1). A few drops of this cell suspension were placed on a glass slide, which was positioned on a hot plate set at 37°C. The air-dried cells on the slide were stained using Giemsa’s solution (4% Giemsa’s fluid in PBS) for a duration of 15 to 30 min. Two plates were prepared for each treatment, and a total of 1000 cells were examined per plate under a microscope to detect micronuclei. To assess the toxicity of a test chemical, the number of cells was quantified using a cell counter, specifically the ScepterTM2.0 (Merck Millipore Ltd, Burlington, MA).
Observation of Micronuclei in CHL/IU Cells by AO Staining
An aliquot (5 mL) from a cell suspension (.8 × 104 cells/mL) was added to plastic dishes with a diameter of 6 cm and treated with MMC (two plates per treatment) after 48 h. Specimens were prepared 24 and 48 h after treatment. Cells were removed by trypsinization (.05% trypsin-.02% EDTA) and collected by centrifugation at 1000 rpm for 5 min at 20°C. Hypotonic treatment was done with 2 mL of .075 M KCl for 2-5 min. About 5 mL of a fixative (acetic acid: methanol = 1:3) was added to the cells. After 2 fixations, cells were collected by centrifugation and resuspended in 1 mL of a fixative (acetic acid: methanol = 1:99). A few drops of the cell suspension were placed on a glass slide on a 37°C hot plate. AO solution (40 μg/mL) was added to the slide just before microscopic examination.
Preparation of AO-Coated Slides for Supravital Staining Method
An AO stock solution was prepared by dissolving 10 mg of AO in 1 mL of PBS. The stock solution was diluted to a concentration of 1 mg/mL with PBS just before use. An aliquot (20 μL) of the solution was placed between two glass slides, and they were separated by pulling them apart horizontally in opposite directions. The AO-coated slides were quickly dried using a hair dryer. These AO-coated slides can be stored at room temperature in a dark environment for an extended period until needed. An aliquot (20 μL) of a cell suspension was placed onto the AO-coated slide, which was then covered with a cover slip (24 × 40 mm). Excess fluid was removed by gently pressing the slide between a piece of paper tissue. In cases where cell numbers are expected to be low due to toxic treatments, transfer a larger volume of the cell suspension (eg, 100 μL) to an Eppendorf tube. Cells were concentrated by centrifugation at 3000 rpm for 30 sec and then resuspended in a smaller volume of medium (eg, 20 μL). Code numbers were sealed with a “Post-it” note. Micronuclei were examined under a fluorescence microscope using a B excitation unit (450-490 nm) in conjunction with a broadband filter that cuts off light at wavelengths less than 520 nm.
Examination of Gene Expression by RT-PCR
TK6 cells were initially plated at a density of 15,000 cells per 100 μL per well in three separate 96-well plates. After 24 h, 10 μL of cells from each plate were taken and added to four wells. These cells were then treated with test chemical solutions (MMC, EMS, or H2O2). After 4, 10, and 24 h of treatment, CCK-8 (10 μL) was added to three out of the four wells from each set. OD450 was measured 2 h after the addition of CCK-8 using a plate reader (SH-1100R, Corona Electric Co, Ltd).
Extraction and Analysis of Gene Expression by RT-PCR
Cells were harvested from one of the four wells in each treatment group. RNA was extracted from the collected cells using the QIAzol reagent and the RNeasy Mini Kit, both provided by QIAGEN K.K., Tokyo. cDNA was synthesized from 100 ng of the extracted RNA using the High-Capacity RNA-to-cDNA Kit, manufactured by Thermo Fisher Scientific Inc. RT-PCR was performed using a thermal cycler (ViiA7 Real-Time PCR system from Thermo Fisher Scientific Inc.). The reaction mixture consisted of 5 μL of cDNA, 5 μL of primer mix, and 10 μL of reaction solution per well, with two reactions conducted per sample. The PCR conditions included 40 cycles: initial denaturation at 95°C for 10 min, denaturation at 95°C for 15 sec, followed by annealing and extension at 60°C for 1 min. A standard curve was generated by serially diluting control cDNA with a dilution factor of 5, ranging from .1 to .00016. Each data point was obtained through the ΔCq method, and the relative gene expression level compared to the control was determined.
Seven Genes Used for Gene Expression Analyses
Due to the limited understanding of genes involved in adaptive responses and the diverse actions of mutagenic mechanisms, we selected seven genes believed to be associated with fundamental cellular processes such as DNA repair, cell cycle regulation, apoptosis, and others in our preliminary testing. GAPDH (glyceraldehyde-3-phosphate dehydrogenase) codes for an enzyme that catalyzes the sixth step of glycolysis. It is commonly used as a reference gene in gene expression studies due to its stable expression across various conditions. p21 (cyclin-dependent kinase Inhibitor 1), also known as CDK-interacting protein 1, plays a crucial role in inhibiting cyclin-dependent kinases (CDKs), leading to cell cycle arrest. It acts as a regulator of cell cycle progression. GADD45 A (growth arrest and DNA damage inducible alpha) encodes a protein belonging to the GADD45 family. GADD45 A is involved in various cellular processes, including apoptosis induction, inhibition of microtubule stability, and translocation of Bim (Bcl-2 interacting mediator of cell death) to mitochondria. It functions as a stress sensor, responding to genotoxic stress by regulating cell cycle arrest, DNA repair, and apoptosis. TOP2A (DNA topoisomerase 2-alpha) encodes an enzyme responsible for the transient breaking and rejoining of two strands of duplex DNA. This activity relieves topological DNA stress during transcription, chromosome condensation, and chromatid separation. MCM (minichromosome maintenance protein) is a gene family consisting of six proteins (MCM 2 - 7) that are essential replication initiation factors in eukaryotic cells. They play a crucial role in assembling the prereplication complex at replication origins during the early G1 phase, contributing significantly to cell cycle progression. TP53 (tumor protein p53) codes for the tumor suppressor protein P53. P53 is involved in numerous cellular activities, including cell cycle arrest, DNA repair, apoptosis induction, and inhibition of angiogenesis. It functions as a key regulator of various processes associated with cancer prevention. GSTP1 (glutathione S-transferase Pi 1) encodes a member of the large glutathione S-transferase family. These enzymes play a critical role in detoxification by catalyzing the conjugation of hydrophobic and electrophilic compounds with reduced glutathione. The examination of the expression levels of these genes provides valuable insights into the cellular responses to different treatments and their potential effects on various cellular processes, including cell cycle regulation, DNA repair, and detoxification.
Statistics
To evaluate statistical differences, a table developed by Kastenbaum and Bowman was used. 13 For easy comparison, a table was generated by computer, displaying significance levels of .01 and .05%, P-values ranging from .01 to .99, along with the corresponding number of micronuclei from 1 to 1000. t test was utilized to compare the means of two groups.
Results
Direct Detection of Hormetic Responses Using MMC
Hormesis is characterized by stimulation at lower doses and inhibition at higher doses, typically resulting in reverse U- or J-shaped dose-response curves.
10
We initially examined historical data acquired through a conventional method involving adhesive cells. When CHL/IU cells were treated with MMC, we observed a reduction in micronuclei at a dose of .2 ng/mL (Figure 1(A) and (B)), but statistical significance was not detected. However, when results from nine experiments were combined, a significant difference was seen at .2 ng/mL 24 h after treatment (Figure 1(A), indicated by a triangle, the mean ± SD of micronuclei: control, .83 ± .22; MMC .2 ng/mL, .56 ± .27; n = 9; P = .023; by t test). These results indicate that hormetic responses in the micronucleus test, in which the background incidence is as low as around 1% or less, are difficult to identify directly. Comparison of responses at 24 and 48 h suggests that 24 h is better for micronucleus detection (Figure 1(A) and (B)). A similar dose-response was also confirmed in experiments using AO staining (Figure 1(C) and (D)) instead of Giemsa staining (Figure 1(A) and (B)). Direct detection of hormesis in the micronucleus test. CHL/IU cells were treated with MMC and analyzed 24 h (A, C) or 48 h (B, D) after treatment. Micronuclei were detected by Giemsa staining (A, B) or AO staining (C, D). Cell numbers were measured using a cell counter Scepter TM2.0 (A, B) or a hemocytometer (C, D). RICC (relative increase in cell count) is defined as increase in the number of cells in treated cultures [final - starting]/(increase in the number of cells in control cultures [final - starting]) x100. RCC (relative cell count) is (the number of cells in treatment group)/the number of cells in negative control) x100. RPD (relative population doubling) is (PD of treated group/PD of control group) x100, where PD = [log(X1/X0)]/log2, X1 = the number of cells after treatment, and X0 = the number of cells before treatment. Vertical lines in A and B represent the percentage of micronuclei (MN%) obtained from 1000 cells in two plates. In C and D, 2000 cells were observed on a single plate. * and ** indicate statistical significance between the control and observed MN (%) at P < .05 and P < .01, respectively.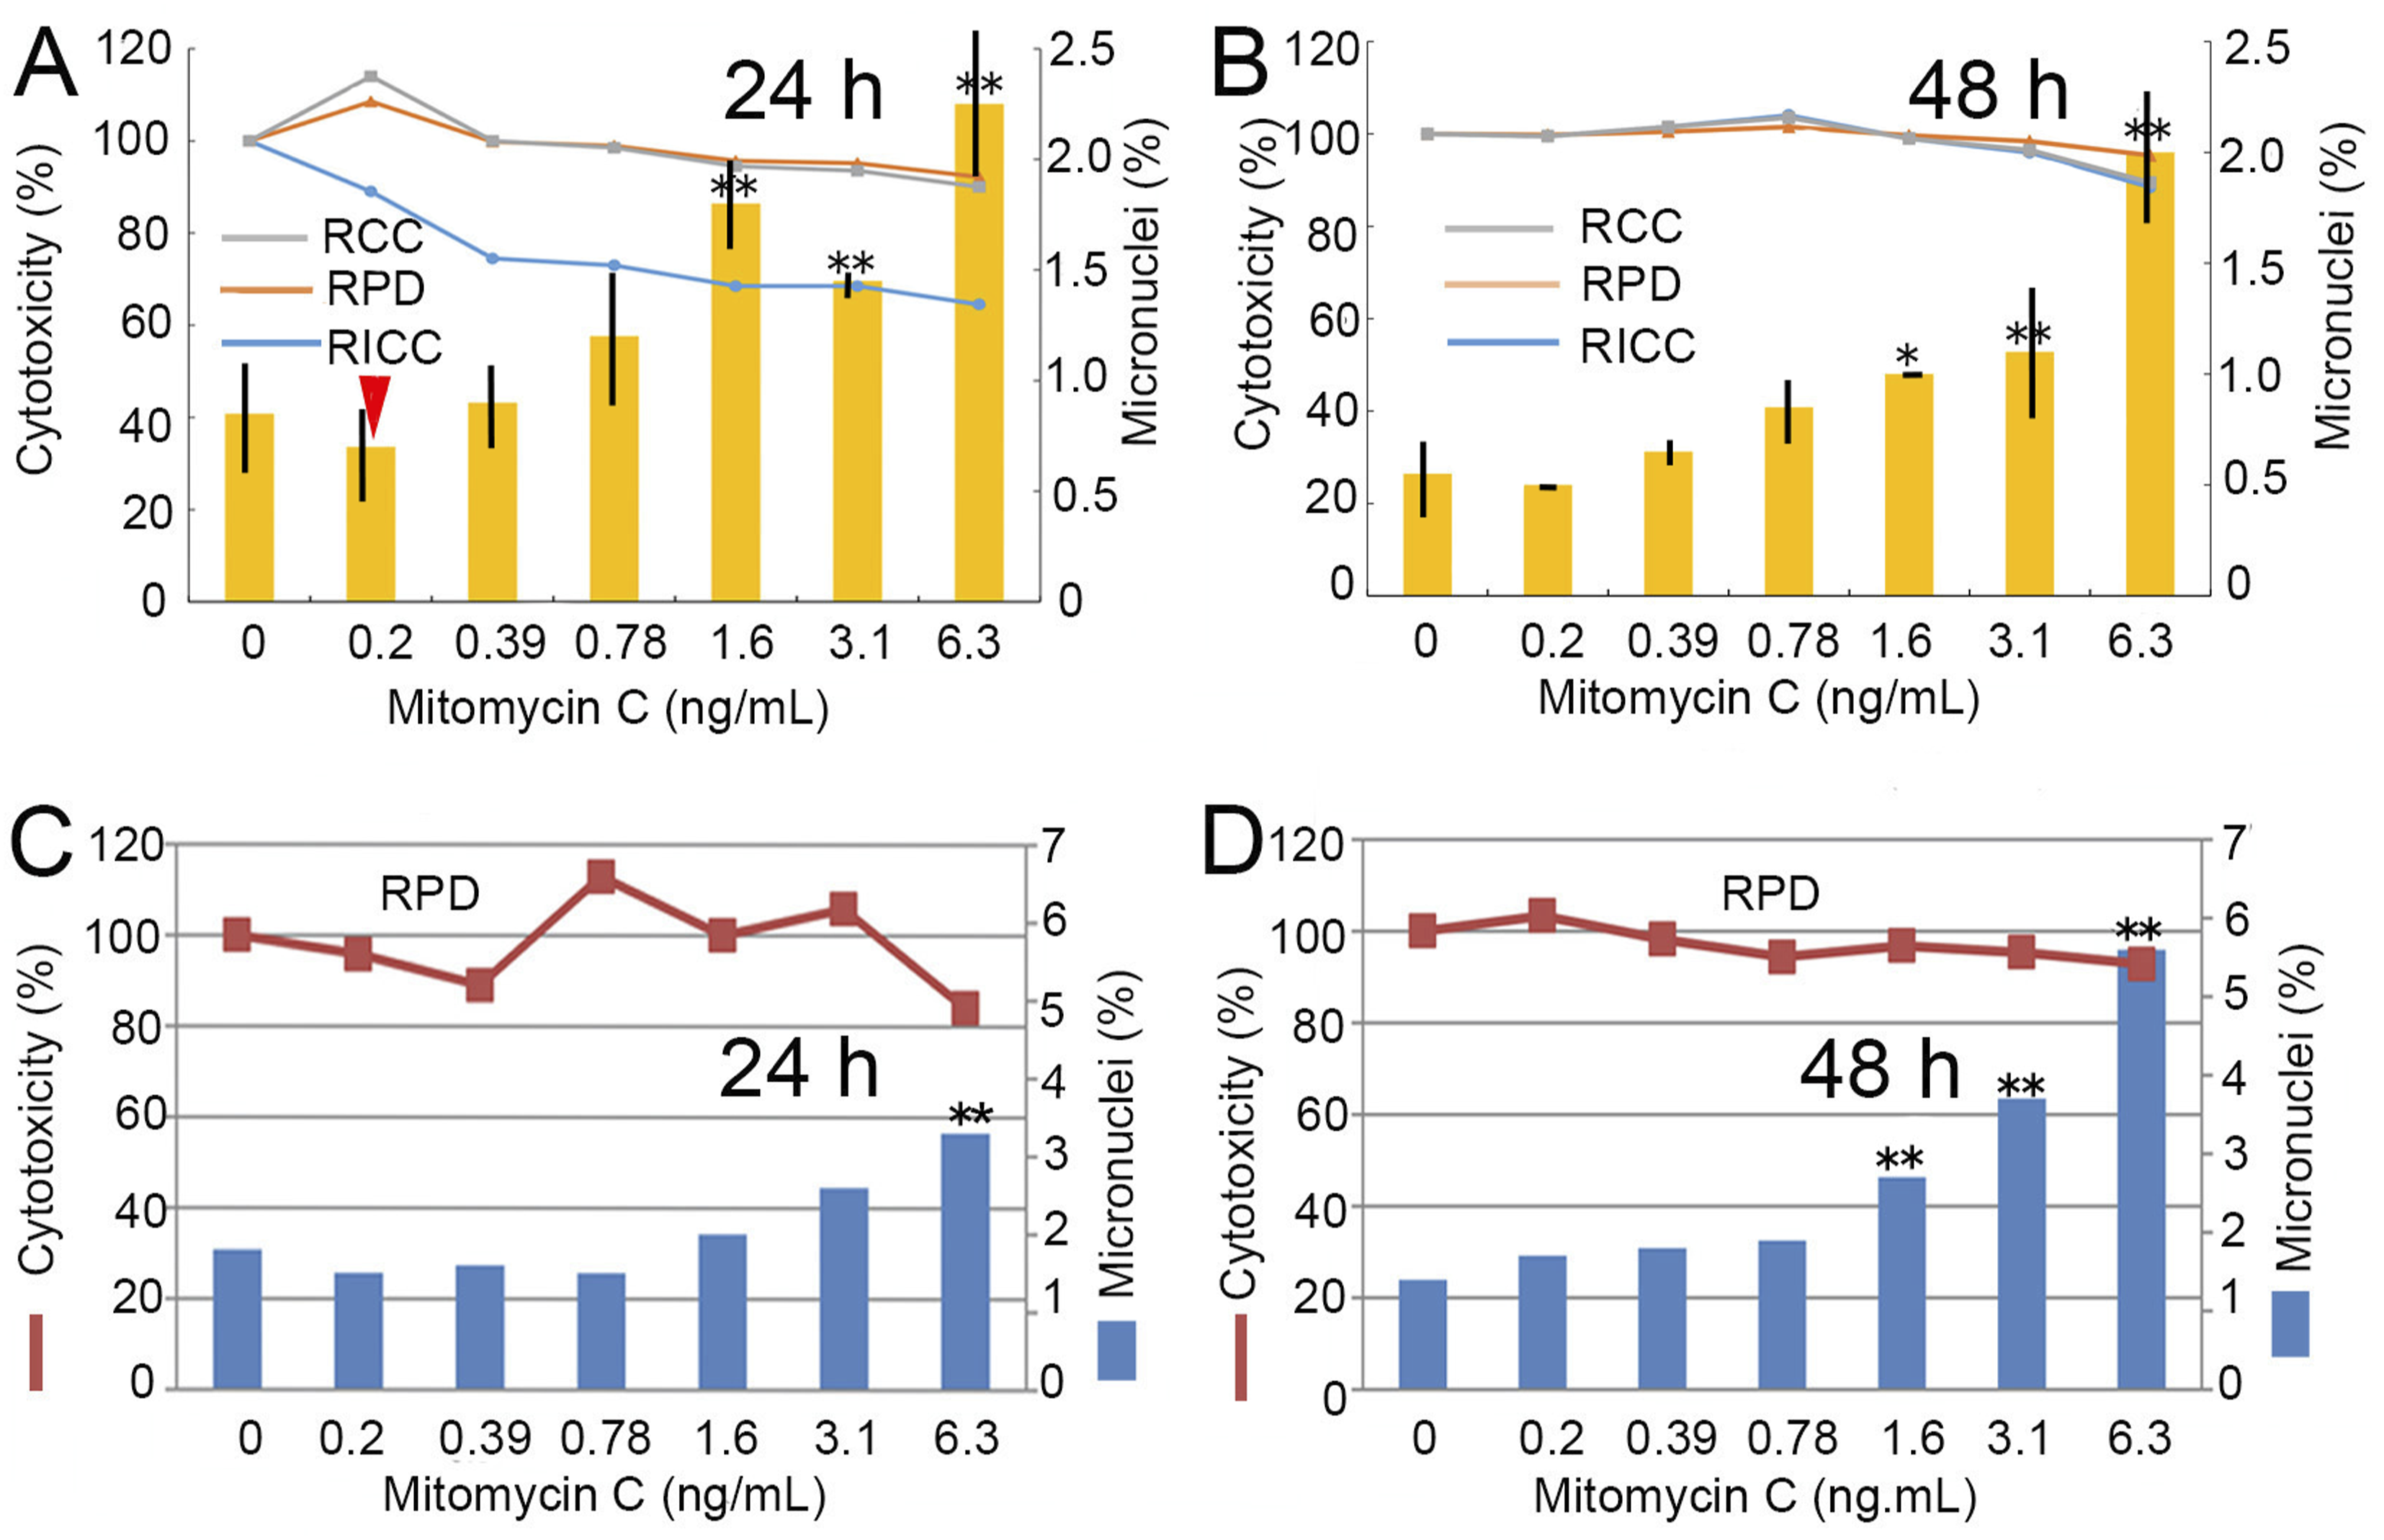
Micronucleus detection at 24 h appeared superior to that at 48 h for the following reasons: (1) When attempting to construct dose-response curves from Figure 1, the curves derived from the 24 h data (Figure 1(A) and (C)) appear to resemble J-shaped curves more closely than those from 48 h (Figure 1(B) and (D)), which tend to show linearity. (2) Particularly in Figure 1(C) and (D), fewer micronuclei were induced than in the negative control at three dose levels (.2, .39, and .78 ng/mL) after 24 h (Figure 1(C)), while all treatments induced more micronuclei than the control after 48 h (Figure 1(D)). (3) Micronucleus incidence was frequently lower than in the control 24 h after treatment with .2 ng/mL, even though it was not statistically significant. However, when nine experimental results were combined, statistical significance was detected (Figure 1(A), .2 ng/mL, triangle). (4) Cytotoxicity exhibited fluctuation 24 h after treatments, possibly indicating stimulation or inhibition by adaptive responses (Figure 1(A) and (C)). Almost no changes in cytotoxicity were observed 48 h after treatments, suggesting a return to steady conditions (Figure 1(B) and (D)).
Notably, cellular growth parameters (RCC and RPD) were stimulated at doses of .2 ng/mL (Figure 1(A)) and .78 ng/mL (Figure 1(C)), aligning with hormetic responses observed in a previous study. 11 RICC deviated from RCC and RPD (Figure 1(A)), but this was exceptional, and the three parameters usually showed similar patterns as shown in Figure 1(B).
Adaptive Response Tests Using EMS and AF-2
Traditional micronucleus tests with adherent cells necessitate trypsin treatment for cell subculture and specimen preparation, requiring one plate for each treatment. In contrast, the use of suspension cells is more convenient, as subculture only involves diluting the cells. Moreover, multiple treatments can be conducted using a single multi-well plate, and samples can be obtained from one well at different times. Consequently, as detailed in the Methods section, we developed a micronucleus test using suspended cells and proceeded with the following experiments.
Detecting hormetic responses directly in the micronucleus test, where background incidence is low (Figure 1), posed challenges, we conducted adaptive response tests: cells initially exposed to low-dose levels insufficient to induce micronuclei were later exposed to high-dose levels (Figure 2). Both EMS and AF-2 exhibited adaptive responses. We also observed adaptive responses when cells were treated with MMC and colchicine. Adaptive response tests using EMS (A) and AF-2 (B). (A) 2.5 × 10⁵ L5178Y cells/well/0.5 mL were inoculated and soon pretreated with 12.5, 25, and 50 μg/mL of EMS for 12 h. Cells were challenged with 500 μg/mL of EMS for 12 h. Cells were centrifuged at 3000 rpm for 30 sec and cultured in 500 μL of fresh medium. Specimens were prepared 18 h after the challenge. Two specimens were prepared from a treatment and 1000 cells/specimen were examined. Blue bars represent the results of pretreatments, red bars indicate those of challenge tests, and purple bars show the expected values E obtained by adding the values of pretreatments to the control value. (B) The method was the same as in A except that cells were pretreated with .5, 1.0, and 2 μg/mL of AF-2 and challenged with 20 μg/mL of AF-2. The vertical line shows the range of the two observations. * and ** indicate statistical significance between expected and observed MN (%) at P < .05 and P < .01, respectively. + indicates statistical significance between the control and the challenged MN (%) at P < .05. # indicates statistical significance between the control and the pretreatment MN (%) at P < .05.
Since the same test compound induces the opposite reactions depending on doses in hormesis, selection of dose levels for pre-treatments and post-treatments is critically important. In this sense, pre-treatments with 1.0 and 2.0 μg/mL of AF-2 were not very appropriate, because these doses induced significantly micronuclei (P < .05, Figure 2(B)). Although cells were pretreated with micronucleus-inducing doses, adaptive responses were observed (Figure 2(B)).
Cross-Adaptive Response Tests Using EMS and AF-2
Following the observation of adaptive response tests (Figure 2), we conducted cross-adaptive response tests (Figure 3). In these tests, cells were first exposed to low-dose levels of one mutagen, insufficient to induce micronuclei, and then challenged with a high-dose level of another mutagen, sufficient to induce micronuclei. In Figure 3(A), cells were pretreated with AF-2 and then challenged with MMC, resulting in cross-adaptive responses. Conversely, in Figure 3(B), cells were pretreated with MMC and then challenged with AF-2, also demonstrating cross-adaptive responses. Notably, even a low dose of .25 ng/mL of MMC induced a hormetic response in Figure 3(B). This observation brings to mind the results of the MMC test, where nine tests were amalgamated (Figure 1(A), triangle). Additionally, cross-adaptive responses were detected when cells were pretreated with MMC and then challenged with EMS, and vice versa. Cross-adaptive response tests using AF-2 and MMC. (A): 2.5 × 10⁵ L5178Y cells were seeded in each well with .5 mL of medium. They were then pretreated with .25, .5, and 1.0 μg/mL of AF-2 for 12 h. Afterward, MMC (20 ng/mL) was added to the cultures. Following 12 h, cells were centrifuged at 3000 rpm for 30 sec and cultured in 500 μL of fresh medium. Two specimens were prepared from a treatment 18 h after the medium change, and 1000 cells/specimen were examined. Blue bars represent the results of pretreatments, red bars indicate those of challenge tests, and purple bars show the expected values E obtained by adding the values of pretreatments to the control value. The vertical line shows the range of the two observations. (B): The procedure was the same as in A, with the exception that cells were pretreated with .25, .5, and 1.0 ng/mL of MMC and then challenged with 20 μg/mL of AF-2. * and **, indicate statistical significance between the expected and observed MN (%) at P < .05 and P < .01, respectively. + and ++ indicate statistical significance between the control and observed MN (%) at P < .05 and P < .01, respectively. # indicates statistical significance between the control and pretreatment MN (%) at P < .05.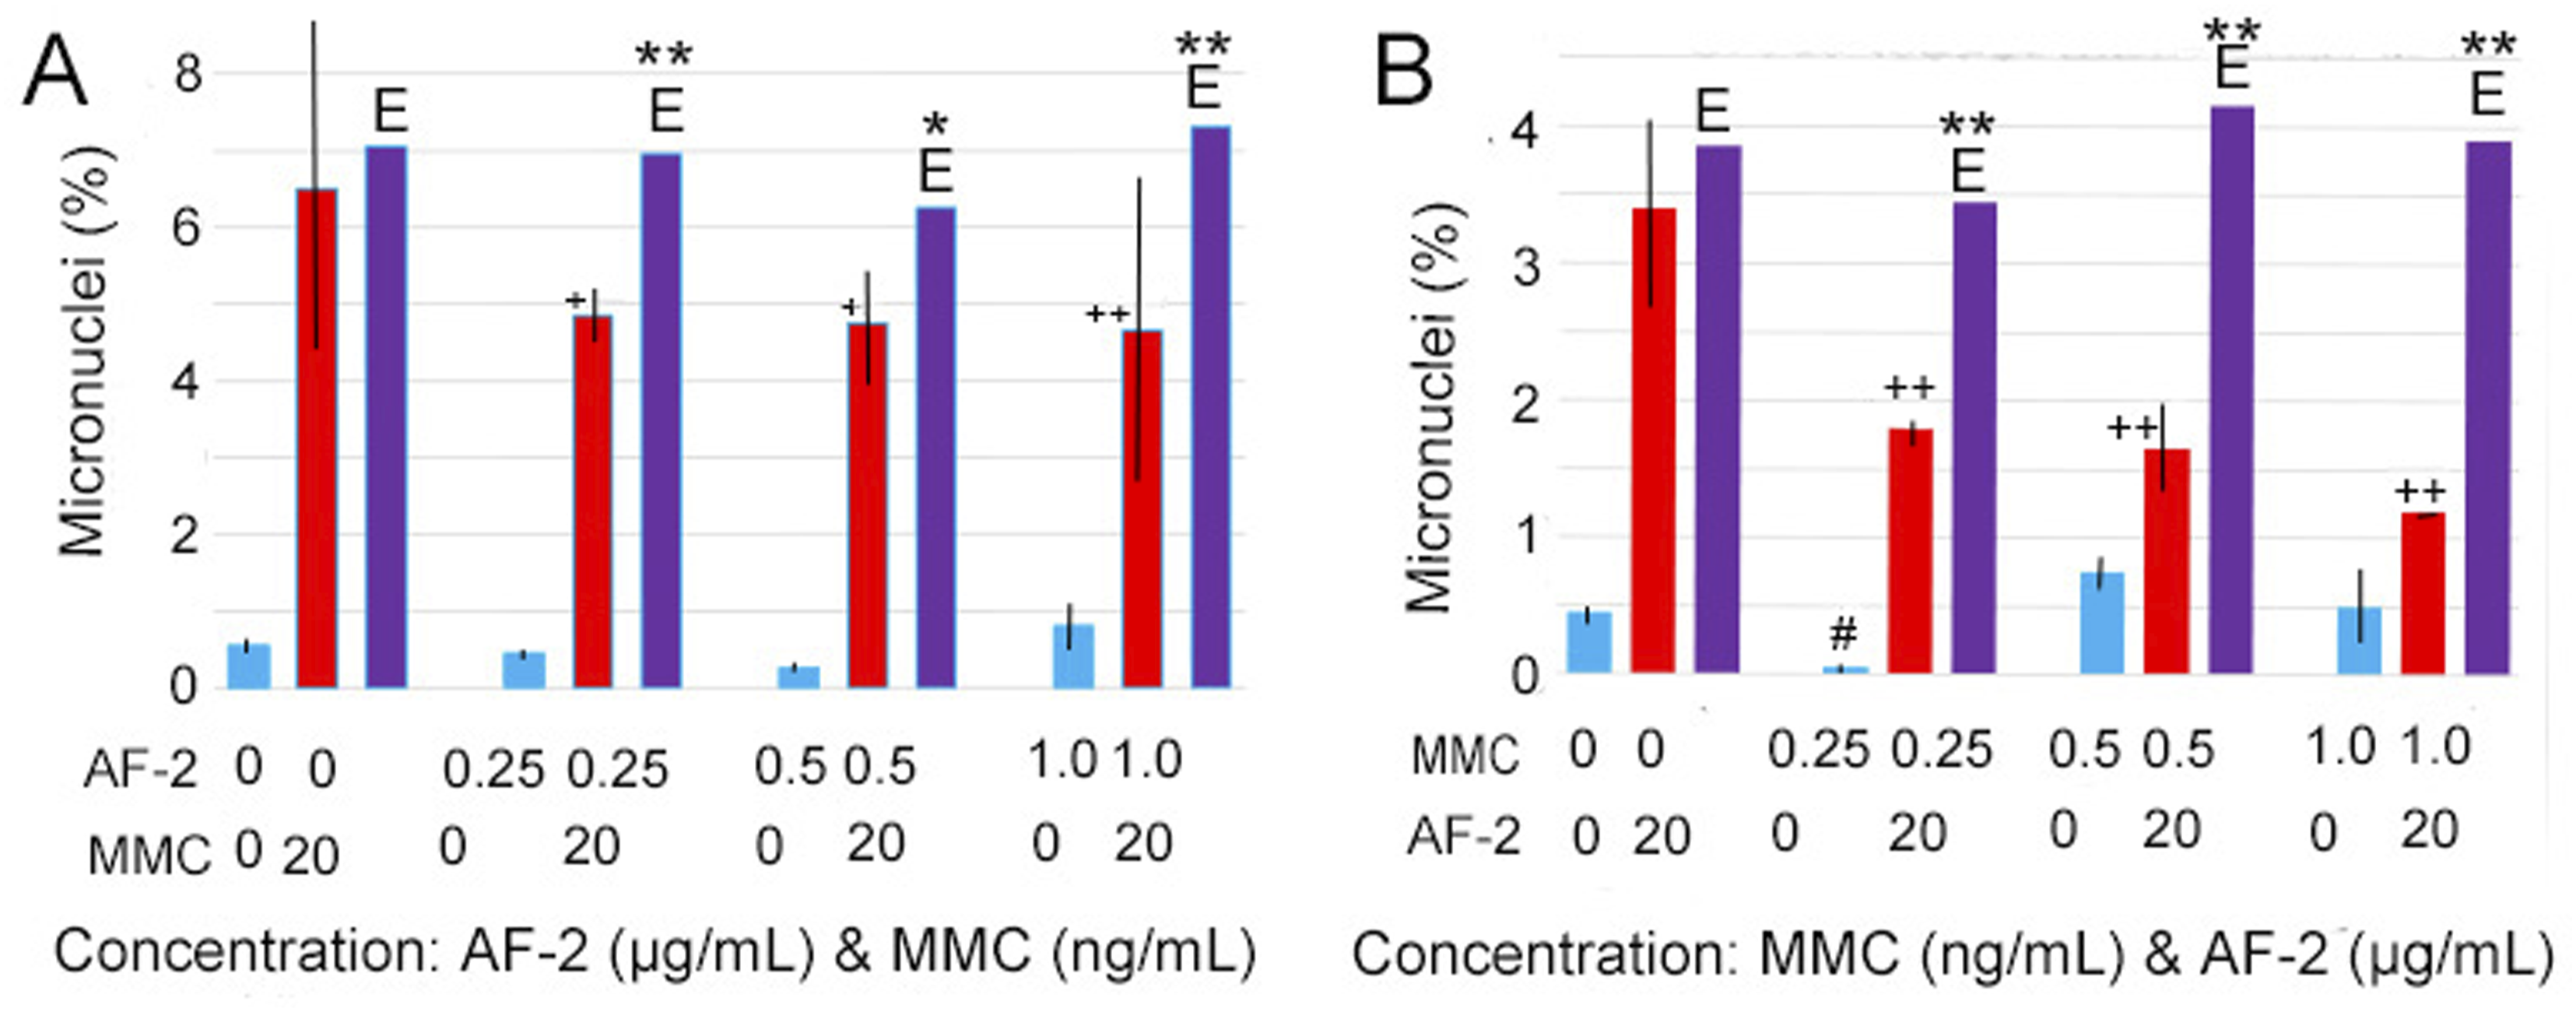
Gene Expression in TK6 Cells Treated with MMC
In our earlier experiments exploring hormesis with cell activity and cell proliferation as endpoints, we utilized TK6 cells.10,11 This time, in preliminary experiments aimed at gaining insights into gene expression, we employed TK6 cells with which we were familiar.
First, we estimated the effect of MMC on the gene expression of six genes other than the reference gene (Figure 4). Cytotoxicity and P21 gene expression began to increase slightly at 500 ng/mL for 4 h exposure (Figure 4(A) and (B)). At 10 h of exposure, cytotoxicity and GADD45 A gene expression began to increase dose-dependently at 200 ng/mL, and P21 gene expression began to increase at 50 ng/mL (Figure 4(A) and (C)). At 24 h exposure time, the starting dose level of cytotoxicity, GADD45 A gene expression level, and P21 gene expression level were approximately 20, 50, and 10 ng/mL, respectively (Figure 4(A) and (D)). Effects of MMC on cytotoxicity and gene expression of 6 genes. (A) MMC cytotoxicity is shown as a percentage of the control. (B, C, and D): Ratios of mRNA levels of 6 genes to GAPDH for 4, 10, and 24 h of exposure time, respectively. RPD is a parameter of cytotoxicity.
As shown in Figure 1, MMC significantly induces micronuclei at a concentration of 6.3 ng/mL after 24 h of exposure. Notably, cytotoxicity and gene expression changes occur at higher dose levels than those required for micronucleus induction. The p21 gene encodes a protein known as an inhibitor of cyclin-dependent kinases (CDKs), which leads to the cessation of cell proliferation. On the other hand, GADD45 A encodes a protein that functions as a stress sensor for various cellular processes such as cell cycle arrest, DNA repair, and apoptosis in response to genotoxic stress. Therefore, it appears that the cytotoxic doses of MMC induce these genes associated with cell cycle arrest and DNA repair. In cases where repair is unsuccessful, apoptosis may occur to eliminate damaged cells. Notably, p21 responds more sensitively to MMC compared to GADD45 A.
Gene Expression in TK6 Cells Treated with EMS
The effect of EMS on the gene expression of 6 genes was estimated by measuring the mRNA levels relative to the housekeeping gene GAPDH (Figure 5). At a 4-h exposure time, almost no cytotoxicity and no gene induction were observed with EMS treatment (Figure 5(A) and (C)). At 10 h of exposure, cytotoxicity and gene expression of p21 began to increase at 50 μg/mL and 20 μg/mL, respectively. Gene expression of GADD45 A began to increase at 200 μg/mL (Figure 5(A) and (D)). For the exposure time of 24 h, cytotoxicity and gene expression of p21 and GADD45 A began to increase at approximately 20 μg/mL (Figure 5(A) and (E)). Genes induced by EMS were p21 and GADD45 A as well as MMC. It is noteworthy that the dose-response of p21 expression showed a J-shaped curve, even at 4 h exposure time (Figure 5(B)). If this is true, it is indicated that hormesis could occur without gene expression. Effects of EMS on gene expression of 6 genes. (A): Cytotoxicity of EMS is expressed as a percentage relative to the control. (B): The ratio of P21 mRNA levels to GAPDH mRNA levels is shown for exposure times of 4, 10, and 24 h, respectively. (C, D, and E): Ratios of mRNA levels of 6 genes to GAPDH for 4, 10, and 24 h of exposure time, respectively. RPD is a parameter of cytotoxicity.
Gene Expression in TK6 Cells Treated with H2O2
The effect of H2O2 on the gene expression of six genes was estimated by measuring the mRNA levels relative to the housekeeping gene GAPDH (Figure 6). Cytotoxicity and gene expression of p21 and GADD45 A began to increase slightly at 10 μg/mL after 4 h of exposure (Figure 6(A) and (B)). At 10 h exposure time, cytotoxicity and gene expression of p21 and GADD45 A began to increase clearly and dose-dependently at approximately 10 μg/mL (Figure 6(A) and (C)). Little increase in p21 and GADD45 A gene expression was observed at 24 h exposure time, probably because the treatment was too toxic (Figure 6(A) and (D)). Thus, cytotoxic dose levels of H2O2 induced some genes associated with cell cycle arrest and DNA repair as well as MMC and EMS. Effects of H2O2 on gene expression of six genes. (A) Cytotoxicity of H2O2 is shown as a percentage of the control. (B, C, and D): The ratios of mRNA levels to GAPDH for 4, 10 and 24 h of exposure, respectively. RPD is a parameter of cytotoxicity.
Discussion
The linear no-threshold model (LNT) was endorsed by the US National Academy of Sciences (NAS) in 1956, primarily relying on Drosophila data while overlooking human data from A-bomb survivors.14,15 The Linear No-Threshold (LNT) model posits that the genetic effects of ionizing radiation are linear in proportion to doses, extending down to single ionizations. In 2006, NAS reaffirmed the use of LNT for assessing cancer risk from radiation, citing data from A-bomb survivors. 16 However, A-bomb survivors have exhibited longer lifespans and lower cancer risk. 17 Accumulated data suggest that low-dose radiation is essential, mid-dose radiation is hormetic, and high-dose radiation is hazardous. 18
EPA was established in 1970 and sought guidance from NAS on how to regulate carcinogens. NAS recommended applying LNT to carcinogens. 19 However, dose-responses for mutagenic and carcinogenic effects may not necessarily conform to the LNT model. Due to challenges in directly establishing thresholds, our research has been focused on investigating hormetic dose-responses, as hormesis can contradict the LNT model. 18 In prior studies, we demonstrated the feasibility of establishing hormesis in both cell activity and cell proliferation tests.10,11 In the current study, we did not detect hormetic responses but confirmed the presence of adaptive and cross-adaptive responses in the micronucleus test. Since adaptive responses stem from preconditioning, and preconditioning is a form of hormesis, our findings of adaptive responses strongly suggest that hormesis is induced by mutagenic treatments, implying the existence of thresholds. 20
Of particular significance is the observation that cross-adaptive responses occur not only among different chemicals but also between chemicals and radiation sources.21,22 This suggests that adaptive responses and hormesis are not distinct entities but rather the same phenomenon described with different terminology. Other terms such as biphasic dose response, U-shaped dose response, preconditioning, overcompensation responses, rebound effect, repeat bout effect, and so on may be categorized under a single term such as hormesis or adaptive response. 23
Given that living organisms have evolved over approximately 4 billion years to sense environmental information and respond to it, they utilize common defense mechanisms to address a variety of external stressors and challenges. The Keap1-Nrf2 pathway serves as a cellular defense system against oxidative and xenobiotic stresses caused by reactive oxygen species (ROS) and electrophiles, respectively. Under normal, unstressed conditions, Nrf2, a transcription factor, is continuously captured by Keap1 and subsequently degraded through the ubiquitin-proteasome pathway. However, when cells encounter ROS or electrophiles, the degradation of Nrf2 is halted. Consequently, Nrf2 translocates to the nucleus, where it stimulates the transcription of over 100 genes associated with antioxidation and detoxification. Ionizing radiation itself may be imperceptible, but its primary biological impact lies in the generation of ROS. ROS, functioning as signal mediators, are recognized by the Keap1-Nrf2 system, one of the two major systems responsible for regulating ROS. 24
Another major system responsible for managing reactive oxygen species (ROS) is the NF-κB/IκB system. 25 NF-κB proteins form a family of transcription factors that regulate the expression of numerous genes crucial not only in ROS management but also in inflammation, immunity, cell growth, differentiation, development, and apoptosis. Despite its essential role in sustaining life, oxygen can paradoxically be one of the most toxic substances in our environment. Mitochondria, crucial cellular components, are a significant source of ROS production, estimated at a staggering 109 ROS/cell/day. 26 To provide perspective, the rate of double-strand DNA breaks per cell per day caused by background radiation (1 mGy) is calculated to be 10−4, whereas those induced by endogenous ROS are calculated to be 10−1. This highlights that endogenous ROS pose a substantially greater hazard than natural radiation.
Given this context, it is reasonable to assume that many of the enzymes induced by the NF-κB/IκB system play vital roles in hormetic responses. The Keap1-Nrf2 and NF-κB/IκB systems govern numerous genes, and they do not function independently. For instance, enzymes like glutathione-S-transferase, which regulates ROS levels along with other enzymes like superoxide dismutase, catalase, and glutathione peroxidase, are induced by both systems. This interplay underscores the complexity of cellular responses to oxidative stress.
To gain insights into gene expression changes following mutagenic treatments, we conducted cDNA analyses using RT-PCR. The examined genes included GAPDH (control), p21, GADD45 A, TOP2A, MCM, TP53, and GSTP1, which play roles in cell cycle regulation, apoptosis, DNA repair, and other crucial cellular processes. Among these six genes, p21 and GADD45 A exhibited dose- and time-dependent induction in response to MMC, EMS, and H2O2 treatments. Notably, this induction was observed at relatively higher dose levels where cytotoxic effects became apparent, whereas micronuclei induction occurred at lower dose levels. This observation suggests that hormesis occurs under physiological conditions, and cellular responses, accompanied by gene induction, manifest at higher dose levels coinciding with cytotoxicity.
While it may be tempting to simplify this induction as a response to halt the cell cycle for DNA repair, it is essential to acknowledge the limitations of our study. We examined a relatively small number of genes, and our analysis relied on a single detection system. Therefore, the full complexity of cellular responses to these mutagenic treatments may not be fully captured in this simplified preliminary explanation.
Calabrese and Baldwin have defined two distinct types of hormesis: Direct Stimulation Hormesis (DSH) and Overcompensation Stimulation Hormesis (OCSH). 27 DSH represents a steady-state adaptive response, reflective of normal physiological dynamics. In contrast, OCSH begins with the disruption of homeostasis, followed by modest overcompensation, reestablishment of homeostasis, and the adaptive nature of the process. DSH typically results in a dose-response curve that exhibits a reverse U-shaped or J-shaped pattern, as observed in our prior studies.10,11 On the other hand, when OCSH occurs, it leads to various curve shapes, including an S-shaped curve consisting of concave and convex segments, a J-shaped curve, or a typical reverse U-shaped curve. To generate a J-shaped curve in challenge tests, for instance, we would need to conduct experiments with various pretreatment dose levels alongside a challenge dose, with the resulting J-shaped curve derived from combining all results. However, we did not perform these experiments this time. Given the involvement of numerous mechanisms in hormesis induction, the expression patterns are intricate, and responses are both time- and dose-dependent. Considering these factors, our current tests are limited in terms of the variety of cell types, the range of mutagens, and the analysis of gene expression.
Conclusion
As part of a collaborative study on mutagen thresholds, we investigated whether mutagens induce hormesis—a phenomenon characterized by a J-shaped dose-response curve and serving as an indicator of threshold presence—in the micronucleus test. Conducting this test with adherent CHL/IU cells, we found that the background incidence of micronuclei being 1% or less made it difficult to observe further reductions due to hormetic responses. Consequently, we explored adaptive responses instead, using challenge tests and cross-adaptive response tests with L5178Y cells—suspension cells that are easily subcultured and allow for continuous sampling from a single culture. These tests revealed clear detection of adaptive responses when cells were pretreated with a low dose of a test chemical and subsequently challenged with a high dose of the same or another chemical. Since adaptive responses stem from preconditioning, which is fundamental to hormesis, our findings strongly suggest that mutagenic treatments induce hormesis, thus indicating the presence of thresholds. Additionally, when we investigated the gene expression patterns of six genes via RT-PCR after mutagen treatment using TK6 cells, we found that two genes, GADD45 A and p21, were induced in a dose- and time-dependent manner.
Supplemental Material
Supplemental Material - Collaborative Study of Thresholds for Mutagens: Adaptive Responses in the Micronucleus Test and Gene Induction by Mutagenic Treatments
Supplemental Material for Collaborative Study of Thresholds for Mutagens: Adaptive Responses in the Micronucleus Test and Gene Induction by Mutagenic Treatments by Shizuyo Sutou, Akiko Koeda, Kana Komatsu, Toshiyuki Shiragiku, Hiroshi Seki, Toshiyuki Kudo and The Collaborative Study Group of Thresholds for Mutagens in Dose-Response.
Footnotes
Acknowledgments
All authors are members of the Collaborative Study Group of Thresholds for Mutagens in JEMS. MMS. Regrettably, we mourn the passing of KT on June 28, 2023, due to colon cancer at the age of 57. On a positive note, on July 1, 2023, the Asia Research Awards (ARA), an organization headquartered in India, awarded SS “the International Distinguished Scientist Award” among scientists for his research on “Biological effects of low-dose radiation.” On October 1, 2023, ARA awarded “the Asia’s Outstanding Researcher Award” to SS among scientists, researchers, doctors, and professors for his work on “Research on radiation hormesis.” As a year-round recipient, ARA awarded SS “the International Innovative Scientist of the Year Award” on March 16, 2024 for his research on “Radiation and chemical hormesis.”
Authors’ Contribution
In addition to email communication, participants discussed the study during the biannual meeting of J.E.M.S.,M.M.S. The micronucleus test using CHL/IU cells with Giemsa staining was conducted by H.S. and T.S., while A.K. and K.K. performed the micronucleus test using CHL/IU cells with AO staining and carried out the gene expression experiments. S.S. and T.K. conducted the micronucleus test using L5178Y cells. The initial manuscript was prepared by S.S., and all authors reviewed and approved the final version except for T.K.
Declaration of Conflicting Interests
The author(s) declared no potential conflicts of interest with respect to the research, authorship, and/or publication of this article.
Funding
The author(s) disclosed receipt of the following financial support for the research, authorship, and/or publication of this article: This study is supported by Each organization to which participants belong supported research fund individually.
Ethical statement
Supplemental Material
Supplemental material for this article is available online.
References
Supplementary Material
Please find the following supplemental material available below.
For Open Access articles published under a Creative Commons License, all supplemental material carries the same license as the article it is associated with.
For non-Open Access articles published, all supplemental material carries a non-exclusive license, and permission requests for re-use of supplemental material or any part of supplemental material shall be sent directly to the copyright owner as specified in the copyright notice associated with the article.