
Abstract
Antibiotics are widely used in veterinary and human medicine, but these compounds, when released into the aquatic environment, present potential risks to living organisms. In the present study, the activated carbon (AC) used for their removals is characterized by FT-IR spectroscopy, BET analysis and Scanning Electron Microscopy (SEM) to determine the physicochemical characteristics. Response surface methodology (RSM) and Box-Behnken statistical design (BBD) were used to optimize important parameters including pH (2-12), temperature (20-45°C), and AC dose (0.05-0.20 g). The experimental data were analyzed by analysis of variance (ANOVA) and fitted to second-order polynomial using multiple regression analysis. The optimal conditions for maximum elimination of Amoxicillin (Amox) are (Dose: 0.124 g, pH 5.03 and 45°C) by applying the desirability function (df). A confirmation experiment was carried out to evaluate the accuracy of the optimization model and maximum removal efficiency (R = 89.999%) was obtained under the optimized conditions. Several error analysis equations were used to measure goodness of fit. Pareto analysis suggests the importance of the relative order of factors: pH > Temperature > AC dose in optimized situations. The equilibrium adsorption data of Amox on Activated Carbone were analyzed by Freundlich, Elovich, Temkin and Langmuir models. The latter gave the best correlation with qmax capacities of 142.85 mg/g (R2 = 0.999) at 25°C is removed from solution. The adsorption process is dominated by chemisorption and the kinetic model obeys a pseudo-second order model (R2 = 0.999).

Introduction
Although pharmaceutical compounds such as antibiotics are necessary for animals and humans, their overuse has become a global problem due to the resistance of pathogens to these drugs. 1 The release of pharmaceuticals into natural waters is one of the main environmental concerns; these compounds mainly come from the pharmaceutical industry and hospitals, and threaten water resources. 2 Even in small quantities, antibiotics and emerging contaminants generate microbial resistance 3 and municipal wastewater treatment plants are not efficient enough to eliminate them completely. 4 To this end, adsorption remains attractive and showed its effectiveness in removing these pollutants from wastewater, as it is simple to apply with low cost, it is currently well known that (Amox) is used in the modern medicine, possessing significant ecotoxicity. Amoxicillin is a broad-spectrum beta-lactam antibiotic that belongs to penicillin class used as veterinary medicine for treatment of bacterial infections encountered in gastro-intestinal and systemic infections. Relatively few reports have been published on their elimination. Amoxicillin (Amox) is a widely consumed antibiotic; its structure is based on β-lactam ring, responsible for its high bacterial resistance against microorganisms.5,6 To assess the risks associated with medical wastewater, it is currently well known that amoxicillin possesses significant ecotoxicity. 7 It is a broad-spectrum beta-lactam belonging to the penicillin class used in veterinary medicine for the treatment of bacterial and gastrointestinal and systemic infections. 8 It is commonly prescribed for infections caused by bacteria. 9 Recent studies have reported the presence of amoxicillin at concentrations between ng/L and mg/L in in domestic 10 and industrial waters 11 and many antibiotics have a toxic nature towards algae and other organisms which may have a long-term indirect effect on ecological sustainability. 12 Indeed, due to its bioaccumulation in natural environments, Amox can induce toxic effects influencing the fauna and the flora, which contributes to the destruction of the ecosystem. 13 It is included on the World Health Organization’s list of essential medicines, as one of the most effective medicines in a health system. 14 The presence of antibiotics in the environment has been associated with chronic toxicity and their resistance to antibiotics in bacterial species. 15 Therefore, its elimination by an effective process is crucial before its release into the aquatic environment. To date, many methods have been tried to eliminate antibiotics in conventional treatment plants, like filtration,16,17 photocatalytic degradation,18-20 ozonation, 21 chlorination, 22 biological degradation, 23 and advanced oxidation processes (AOPs)24,25 have been applied to remove drugs from sewage streams. However, the adsorption remains attractive and Activated carbon production requires carbon precursors which are usually agricultural wastes, such as rice husk, peach pits, date palm, lotus stem, rice straw, almond shell, macadamia nut shell, walnut shells, tea waste, sugar beet pulp, peanut shells. , wood chips, and olive stones etc… In this study, commercial activated carbon is used as an adsorbent for the removal of Amox in aqueous solution due to its porosity. Experimental design for variable optimization has a few advantages i) it reduces the number of experiments, resulting in the use of less material and reagents and ii) provides information about interactions between variables. 26 The Response surface methodology (RSM) with BBD design is a widely used mathematical optimization the analytical parameters (temperature, adsorbent dose and pH) with the desirability method (dl) through to simultaneous analysis of interactions of several parameters with the minimum of experimental trials. BBD is a spherical type design which consists of central point and middle points of the edges of the cube circumscribed on the sphere,27,28 the mutual influence of the parameters is studied by the method Pareto and the analysis of variance (ANOVA) method is used as a criterion for the validation of the mathematical model. Response surface methodology (RSM) with BBD design is a mathematical optimization of analytical parameters (temperature, adsorbent dose and pH of the medium) with the desirability method (df) through the simultaneous analysis of the interactions of several parameters with the minimum of experiments.
Materials and methods
Reagents
Technical Characteristics of the Studied Amoxicillin (Amox).

Characterization of the Activated Carbon
The FT-IR spectroscopy, performed using a Bruker spectrometer (Perkin Elmer 200P), was used to obtain the qualitative identification of the functional groups present on the adsorbentsurface; the spectra were obtained between 4000 and 400 cm−1 (resolution of 4 cm−1). 29 The N2 adsorption/desorption isotherms were performed using a Tri Star II 3020 Micrometrics instrument, obtain the textural characterization of the CCP.600 and CCP.700 adsorbent. The adsorbent samples were firstly dried (12 h) at 120°C in an internal oven of the apparatus, and then the surface analyzer was run at − 196°C for the N2 isotherms. 30 The pore size distribution was calculated by the DFT method using the N2 adsorption branch. 31 The surface areas were calculated using the BET method. 32 The textural surface of AC was captured by Scanning electron micrograph (SEM), taken with different resolutions thanks to FEI Quanta650FEG equipment. 33 The Point of Zero Charge (pHpzc) was determined by pH titration procedures. 34 50 cm3 of KNO3 (0.01 M) solutions was poured into erlenmeyer flasks; the pH of solution within each flask was adjusted between 2 and 9 by addition of HCl or NaOH (0.1 M) solution. Then, 0.15 g of adsorbent was added to the flasks and the final pH was measured after 48 h. The pHpzc is defined as the intersection point where the curve pHfinal vs pHinitial crosses the line pHfinal = pHinitial.
Adsorption Experiments
The batch equilibration method was followed for the optimization of the Amox adsorption according to the CCD matrix
Adsorption Process Optimization by Response Surface Method

Independent Variables and Their Levels Used for Box-Behnken Design.

Ce is the initial and equilibrium concentration of the Amox (mg/L) and Co the initial concentration. The experimental matrix of CCD was proposed by Minitab Software 16 which was also used to determine the regression analysis of designed model and graphical analysis of each response. The total number of experiments calculated using the following equation:
Box-Behnken Experimental Design Matrix and Responses (Rexp (%) and Rpred (%) for Elimination of (Amox) Onto AC.

Modeling and Statistical Analysis
In order to verify the quality of the mathematical model through the experiments, we used the Student tests (T value), and Fisher tests (F value) as well as the coefficient of determination (R2), obtained by the Minitab 16 software.
The Student’s test makes it possible to statistically verify the hypothesis of equality of the expectation of two random variables following a normal distribution and an unknown variance. It is also used to test the nullity of a coefficient in the context of a linear regression. The Fischer test is a statistical hypothesis which verifies the equality of two variances, by the ratio of the two variances which does not exceed a certain theoretical value, sought in the Fisher table. In our case, the software gives the ratio between the adjustment variance and that of the experimental error.
The R2 coefficient is an indicator for judging the quality of a linear, simple or multiple regressions. For a value between 0 and 1, it measures the adequacy between the model and the observed data.
ANOVA was performed to verify the statistical significance of the experimental design and establish interactions between independent variables and response effects. 37 It subdivides the total variation into two components, with variation associated with either the model or experimental error. 38 F- and P-values (prob > F, confidence interval = 95 %) for the model were obtained. ANOVA is a statistical approach that subdivides the total change of the data set into ingredient parts concomitant with a defined source to test the target hypotheses on the model parameters. 39 The value of Fisher’s F test, which is the ratio between the mean square of the model and the residual error, allows this comparison and was applied in this study. 40
Adsorption Equilibrium Isotherms
Adsorption isotherms are of primary importance for optimizing the removal of hazardous molecules. The equilibrium relationship between adsorbent and adsorbate is best explained, and the maximum uptake capacity is obtained from the adsorption isotherm. To assess the AC performance, different equations and isotherms exist, out of which the Langmuir,
41
Freundlich ,
42
Temkin
43
and Elovich
44
isotherms are presented in the following equations respectively:


qmax (mg/g) is the monolayer adsorption capacity and K L the Langmuir separation constant related to the free adsorption energy (L/mg), AT, BT, ΔET (kJ/mol), KF, n and KE (L/mg) are the Temkin, Freundlich and Elovich constants. Furthermore, the isothermal models were applied under optimal parameter conditions. The Langmuir model is the best known and widely applied, it is represented in the non linear form.
Results and Discussions
Surface Functional Groups of the Activated Carbon
The functional groups of AC contribute significantly to its adsorption capacity, with selectivity to attract cations to the adsorbent surface.
45
These functional groups are consisted mainly of acidic and basic groups which affect the surface charges and adsorption properties of activated carbon. Adsorption on activated carbon therefore not only relies upon its pore structure as the change of surface charges is also a crucial factor affecting the adsorption capacity. The FTIR spectrum can reveal the functional groups on activated carbon surface qualitatively based on the characteristic energy absorbed for each bond in certain groups,
46
although some particular peaks may overlap. The FTIR spectrum gives the functional groups on the activated carbon surface based on the energy absorbed for each bond,
46
although some particular peaks may overlap. The presence of C = O peaks around 1685 cm−1 comes from the carboxylic functional groups, as well as the chromene and pyrone structures (Figure1). The peak 1025 cm−1 comes from C–O bonding while the broad band (3550-3200 cm−1) is assigned to be O–H functional groups for caboxyl and phenol. The presence of phenol is confirmed by the presence of peak around 1578 and 1610 cm−1 which was the absorption energy of benzene rings. FTIR spectra for activated carbon before and after Adsorption.
Physical Characteristics of Adsorbent
The isotherms of AC (Figure 2) reveals different structures for activated carbon, the curves is rather confused and shows rapid N2 adsorption at low relative pressure (P/Po< 0.4), indicating that the activated carbon is mainly made up of micro pores (pore size < 20 A°).
47
The BET surface area of activated carbon determined on the basis of nitrogen sorption is 1092.951 m2/g. Nitrogen sorption and desorption isotherms for activated carbon.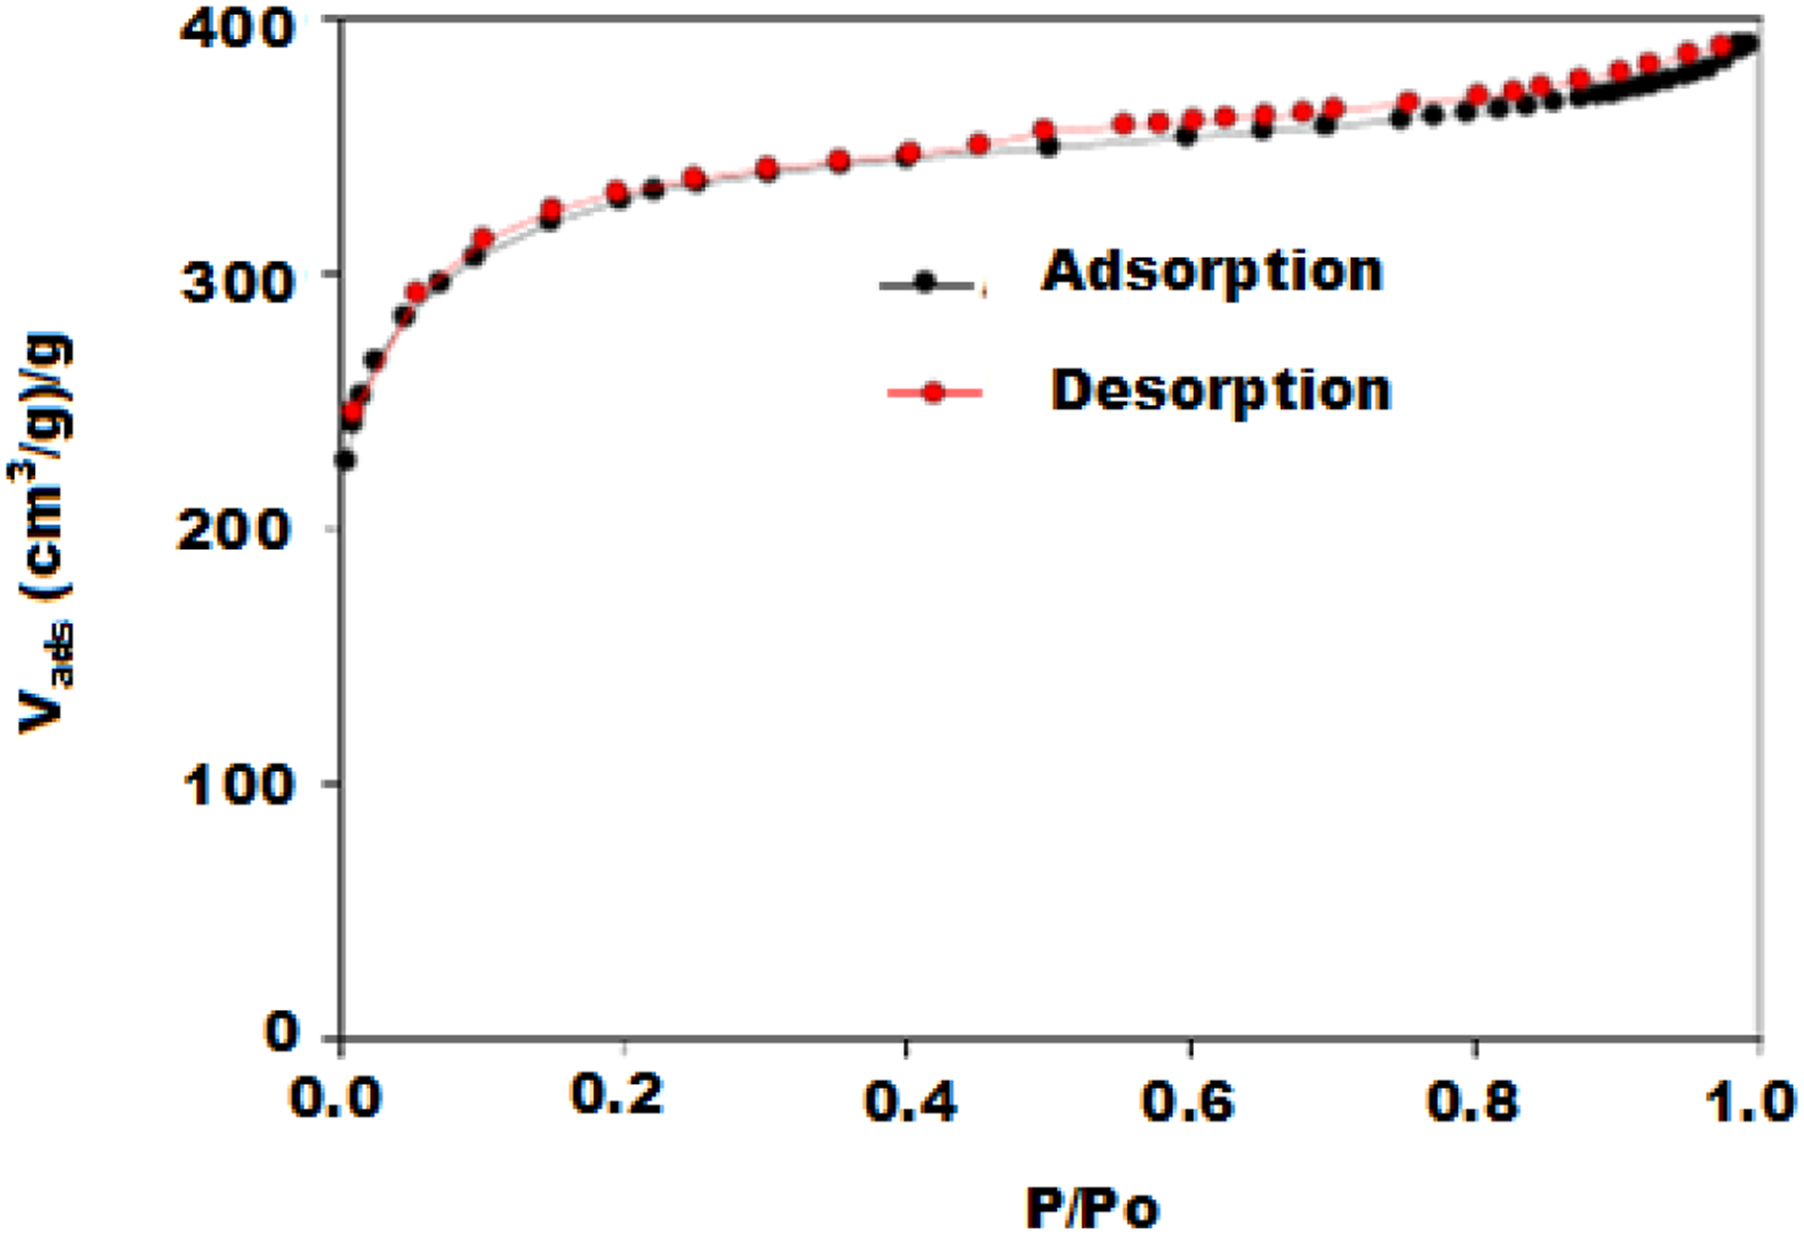
Analyses of the AC Surface Morphology
To confirm the adsorption of Amoxicillin, SEM images were captured before and after adsorption (Figure 3) where we notice a difference in the arrangement of the cavities. The SEM micrographs of the active carbon before and after adsorption are shown in; AC presents a micro-porous structure with different pore diameters with a rough surface and numerous protrusions. After adsorption, the AC surface became smoother, with the roughness significantly reduced and the pores less visible, indicating an adsorption on both the surface and inside the pores. The SEM images also reveal that the exterior surfaces of AC are filled with more or less homogeneous cavities of different sizes and shapes. The cavities are the external pores and represent the main channels of AC to access the internal surface (micropores and mesopores). The highest magnification clearly shows that the adsorbent surface contains a considerable number of pores with a high probability that Amox molecules are adsorbed inside these pores. Microscopic images of the Activated Carbon before and after adsorption.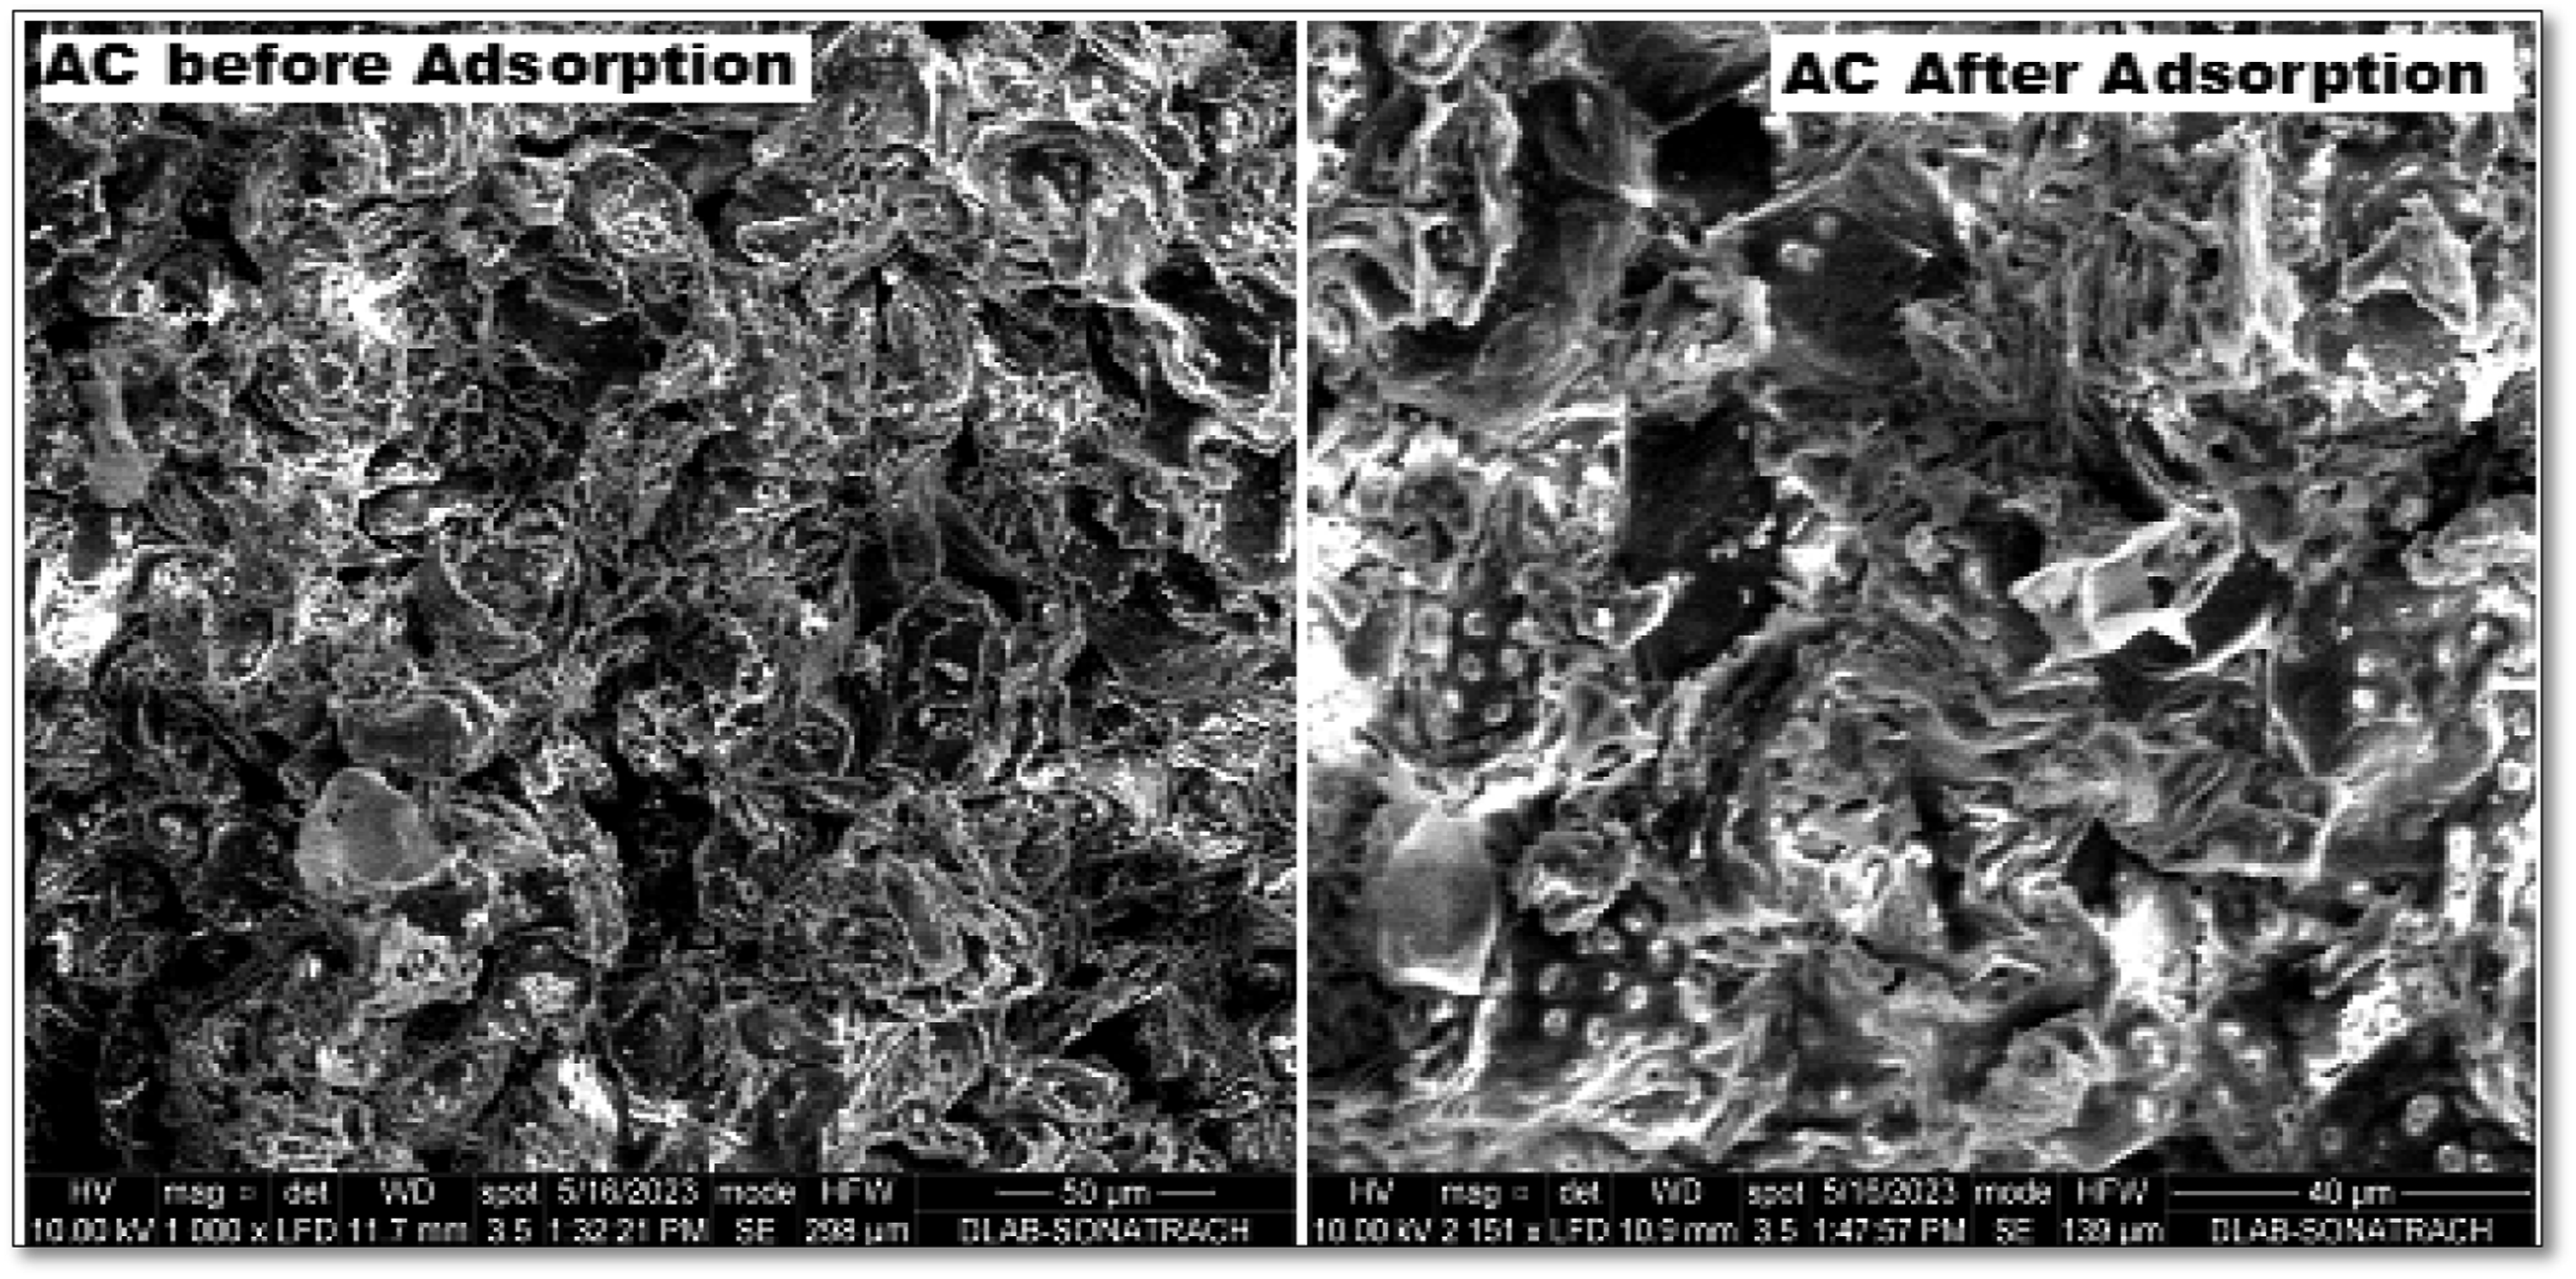
Point of Zero Charge (pHpzc)
pHpzc is a point where an adsorbent has a zero charge on its surface and the presence of H+ or OH− ions in solutions may change the surface charges of the adsorbent. Above pHpzc, the surface functional groups on adsorbents are protonated by the excess H+ ions; on the contrary, below pHpzc, the surface functional groups are deprotonated by the OH− ions presence in the solution. 48 pHpzc of our activated carbon is equal to 5.00.
Mechanism of Action of Amoxicillin
Amox is commonly used due to the broad spectra in terms of its mechanism of action as it stops the proliferation of different bacteria.49,50 In general, the penicillin inhibits a bacterial, an enzyme involved in the synthesis of the bacterial cell wall.
51
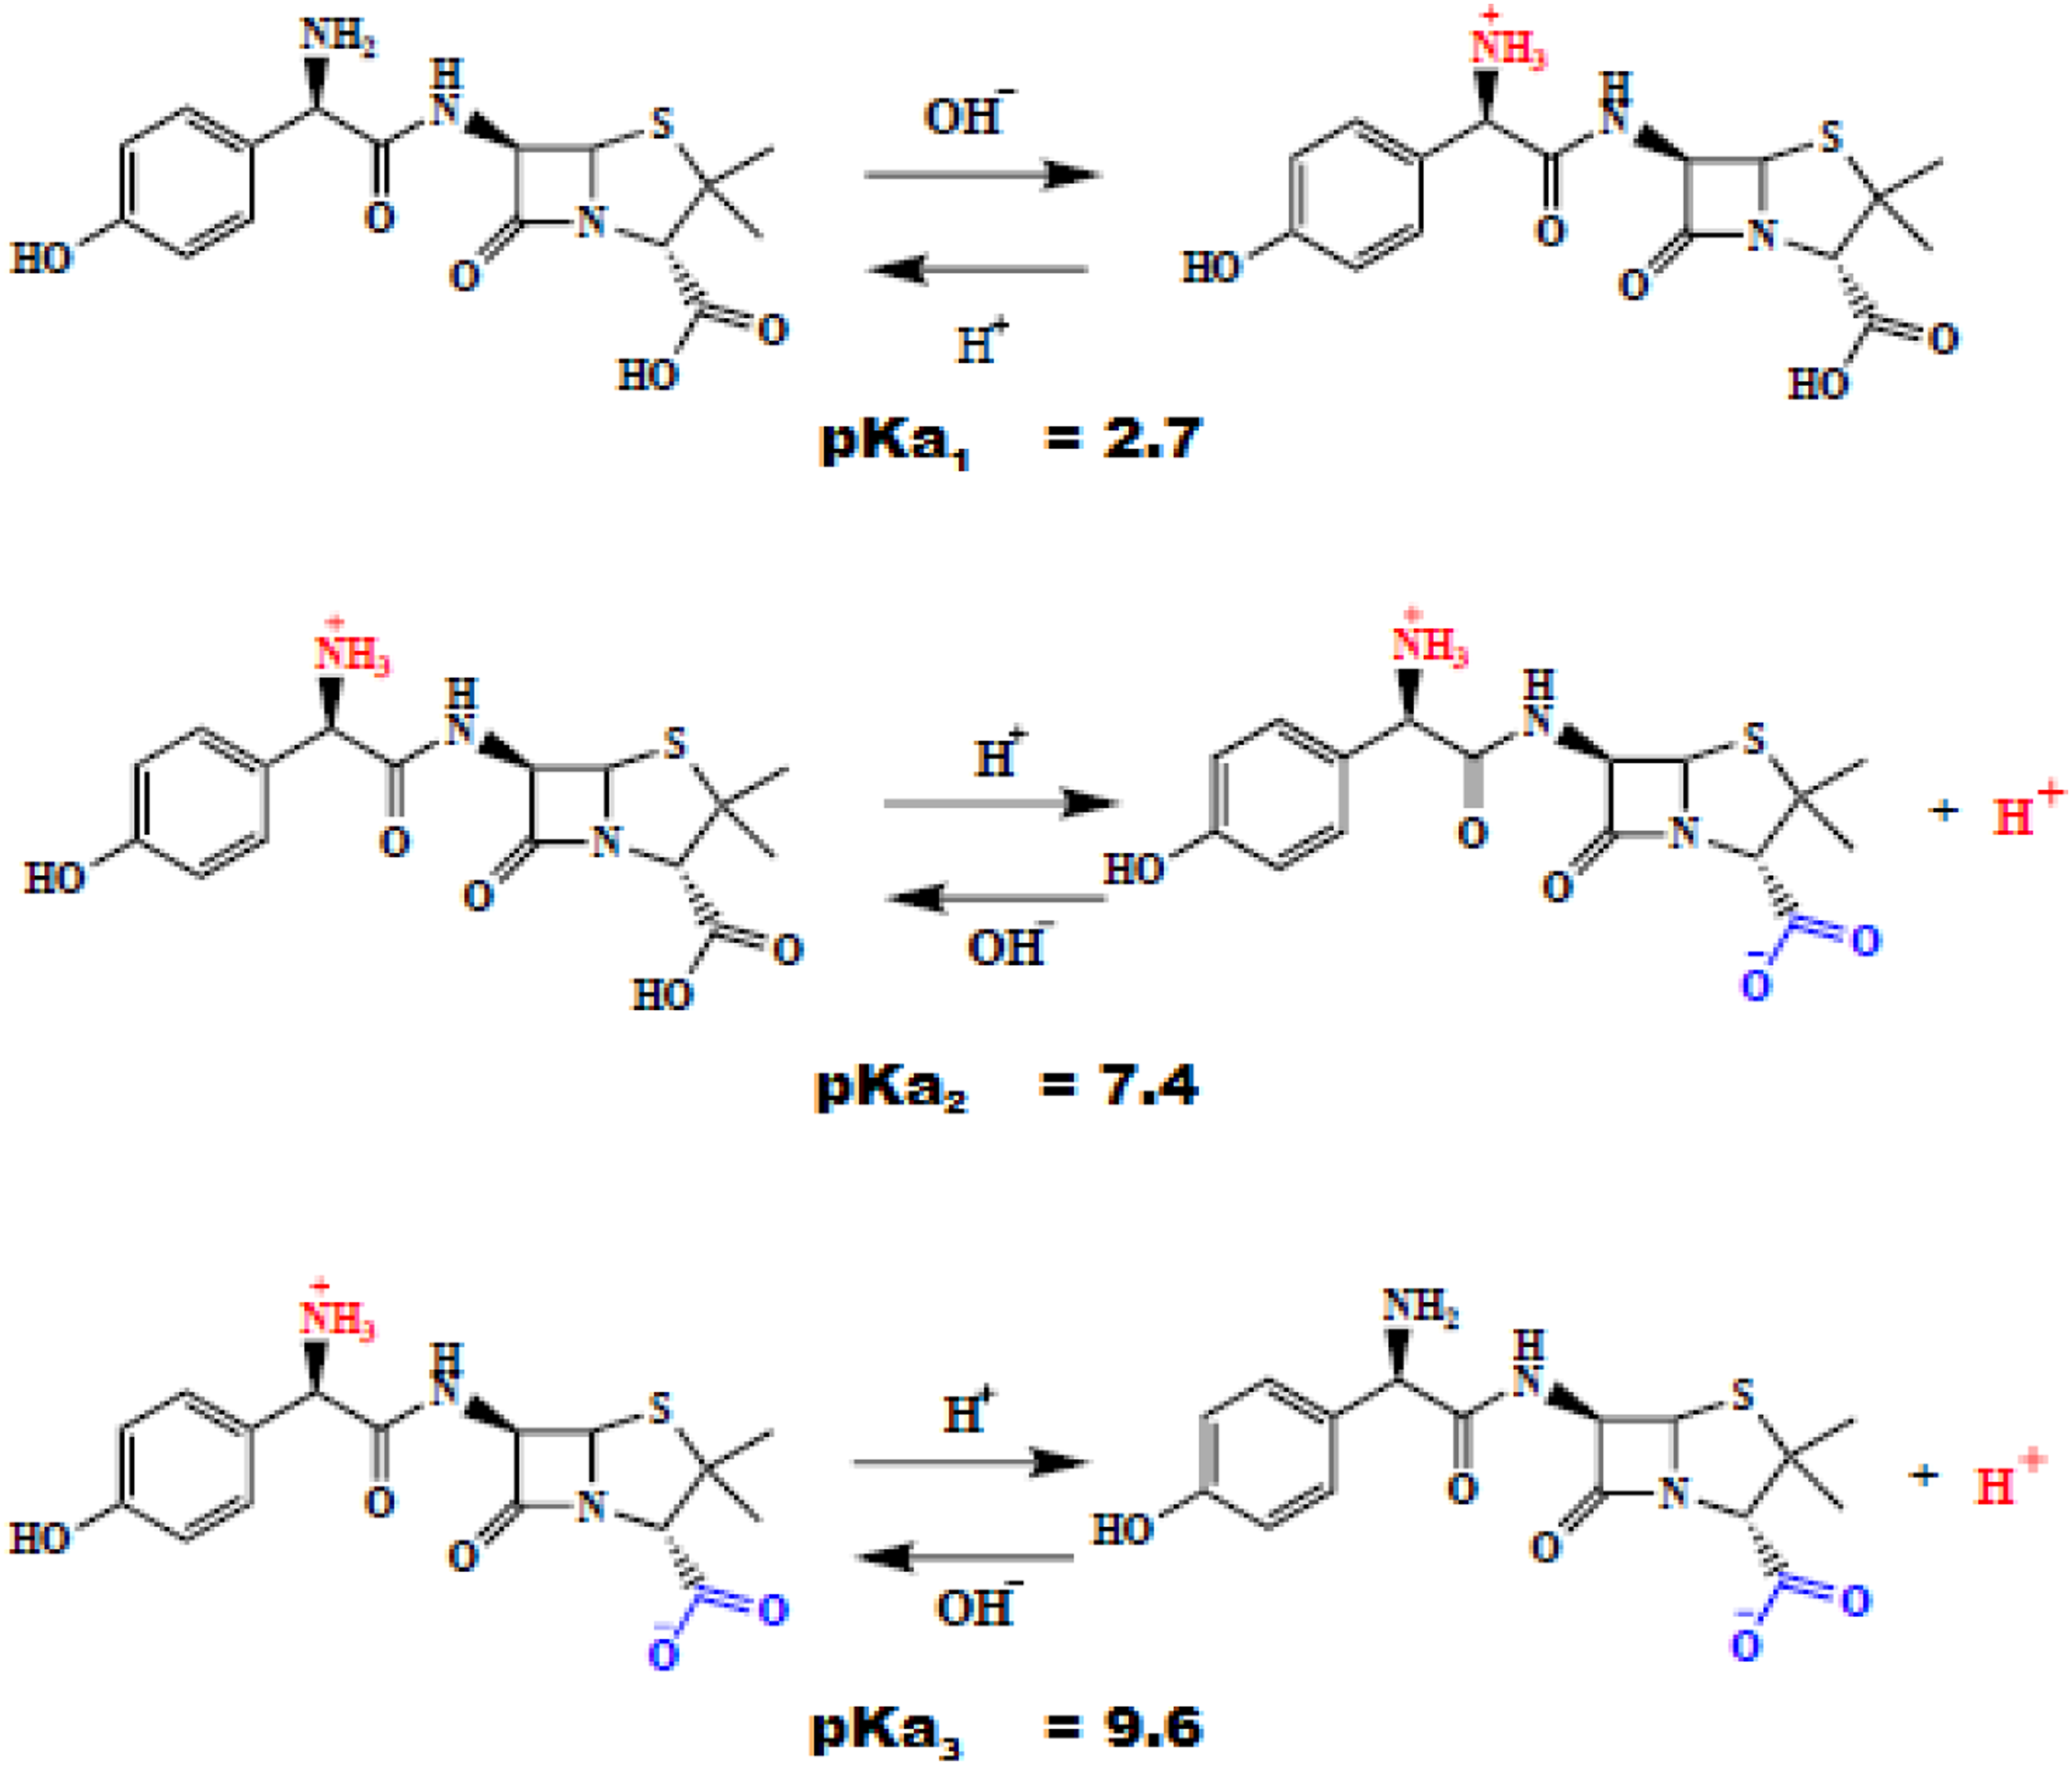
The β-lactam rings are involved in the inhibition mechanism. Penicillin covalently binds to the active site of the enzyme, leading to an irreversible inhibition. It is worth while to mention that Amox has amphoteric properties,
52
due to its three main functional groups (Figure 4), -COOH (pKa1 = 2.7), -NH2 (pKa2 = 7.4) and -OH (pKa3 = 9.6).53,54 The mechanisms of interaction Amox/AC should occur according to the proposals reported in the literature,55,56 it is compatible with the polar groups that exist in the AC surface and Amox (Figure 5). i) ii) Donor-acceptor complex formation between the surface carbonyl groups (electron donors) and the aromatic ring of Amox acting as the acceptor. iii) Hydrogen bonds between the -OH and -NH groups of Amox and the -OH and -NH groups of AC Mechanism of action of amoxicillin. The contours plots of (solution pH - adsorbent dosage), (adsorbent dosage - Temperature) and (solution pH - Temperature).

At pHpzc, AC gave the highest removal performance. At pHpzc of AC (4.91), Amox exists in its neutral form (the pH range where amoxicillin exists in neutral form is 3-6) 57 Similar observations were also noted by other researchers 58 At pHpzc of adsorbent (pKa1< pHsol < pKa2, pKa3), amine functional groups of Amox present in the form of –NH3+ and carboxyl functions can be found in the form of –COO-. Therefore, the electrostatic force would enhance the adsorption since AC contains both positive and negatively functional groups which attract the Amox groups. Another possible mechanism, also worth to be mentioned is the reaction between the amine functions of Amox with carbonyl functional groups on activated carbon. C = O in carbonyl groups are converted by the NH2 groups to C = N while H2O is released in solution.
Experimental Design Analysis by Central Composite Design
The effect of temperature, adsorbent and pH on Amox uptake by AC was investigated using RSM. Fifteen sets of experiments with different experimental conditions were generated by RSM
According to the model, the Temperature independent variable, and the interaction pH*Dose and pH*T have a positive sign, indicating a good impact on the response, with enhanced elimination of Amox. Validation of this model was carried out using the desirability function (df) where the most desirable experimental conditions generated by the software were achieved. The results obtained for the comparison of experimental yields and those calculated by the mathematical model during the eliminations of Amox on activated carbon are shown in Figure 6 and Table 3 to confirm the correlation of the results, a plot of the Rexp = f (Rpred) curve is carried out (Figure 7), the latter clearly shows that the experimental results and those deduced by the model are in perfect correlation (R2 = 0.984). The CCD responses were analyzed and the results of analysis of variance, and RSM were analyzed by Minitab software (version 16) for adsorption study. To determine the comparative significance (Figure 8) of each term in the model, Pareto analysis was applied using the following equation: Comparison of elimination yields. Plot of the experimental and predicted response. Pareto graphic analysis.


Were a i is the regression coefficient of individual process variable. The influence of factors and their interactions is studied through the postulated model which indicates which coefficients should be retained and which could be eliminated from the final mathematical model. To evaluate the importance of a coefficient, statistical theory compares this coefficient to its standard deviation thus indicating the T- Student which determines the P-value.
Analysis of Variance (ANOVA) for Response Surface Quadratic Model.
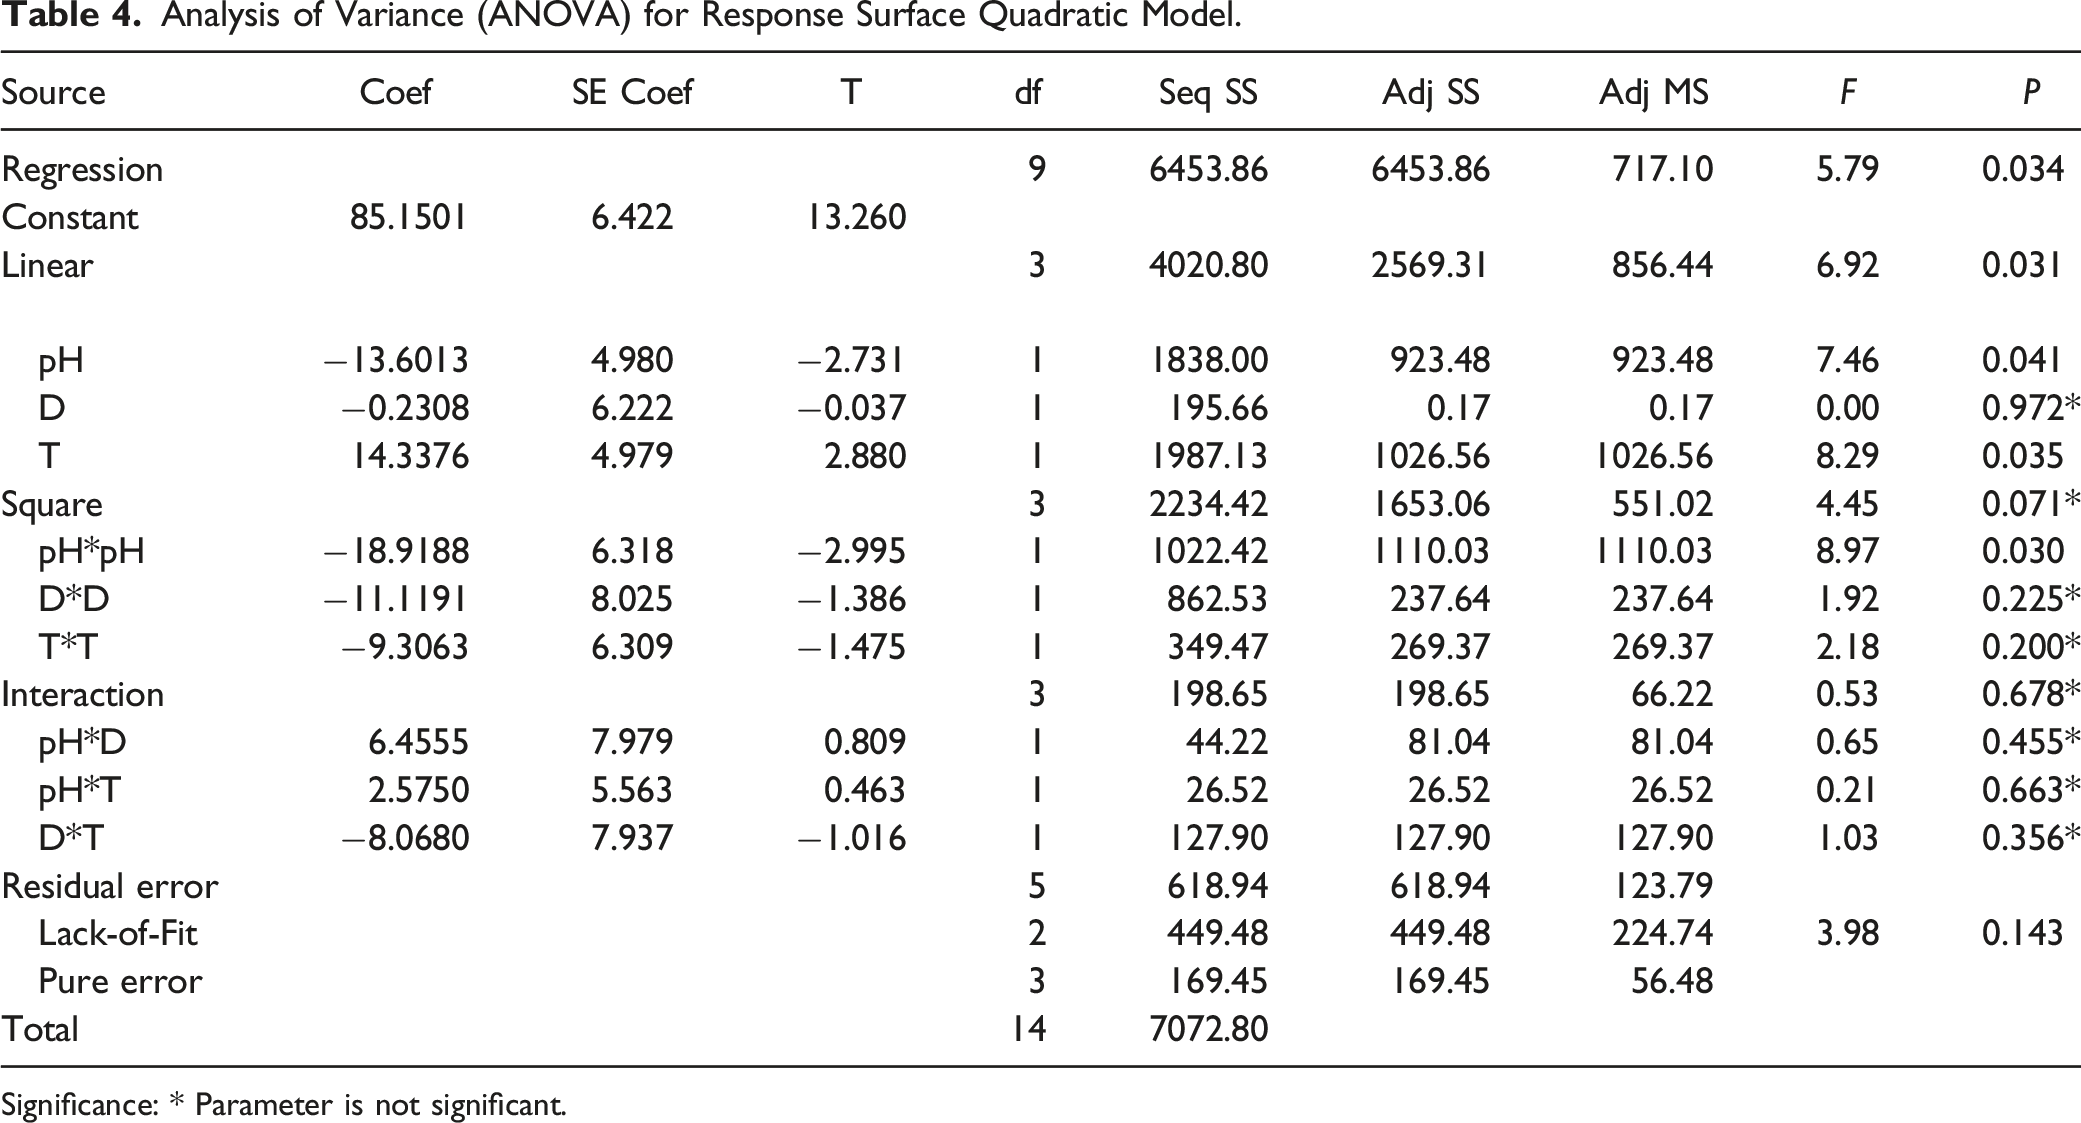
Significance: * Parameter is not significant.
The significance of the effects of the factors can also be identified by the Pareto analysis, in which the effects are ordered from most influential to least. The reference line for statistical significance is automatically indicated by the software. The large T-value and small P-value indicates a high significance of regression models. Some interactions for Amox pollutant (pH, T, and pH*pH
The effects of factors are identified by Pareto analysis, in which they are ranked from most influential to least, the reference line for statistical significance is indicated by the software. The large
Main Effects Diagram for Amoxicillin
Figure 9 shows the simultaneous influence of factors on the elimination rate of Amox. The adsorption rate increases with pH with a maximum pH of 7 then decreases. Adsorption with dose increases in the range (0.025 - 0.1125 g) and then decreases by this value. Temperature also has a positive effect on the elimination of Amox. Main effects diagram for Amoxicillin.
Diagram of the interaction effects of pH and dose factors
For a dose of 0.025 g requires an acidic medium to achieve an elimination rate of 75%, while a maximum elimination rate at pH 7 and an adsorbent dose of 0.1125 g, then it decreases by increasing the dose up to 0.2 g (Figure 10). Diagram of the interaction effects of pH and temperature T (°C).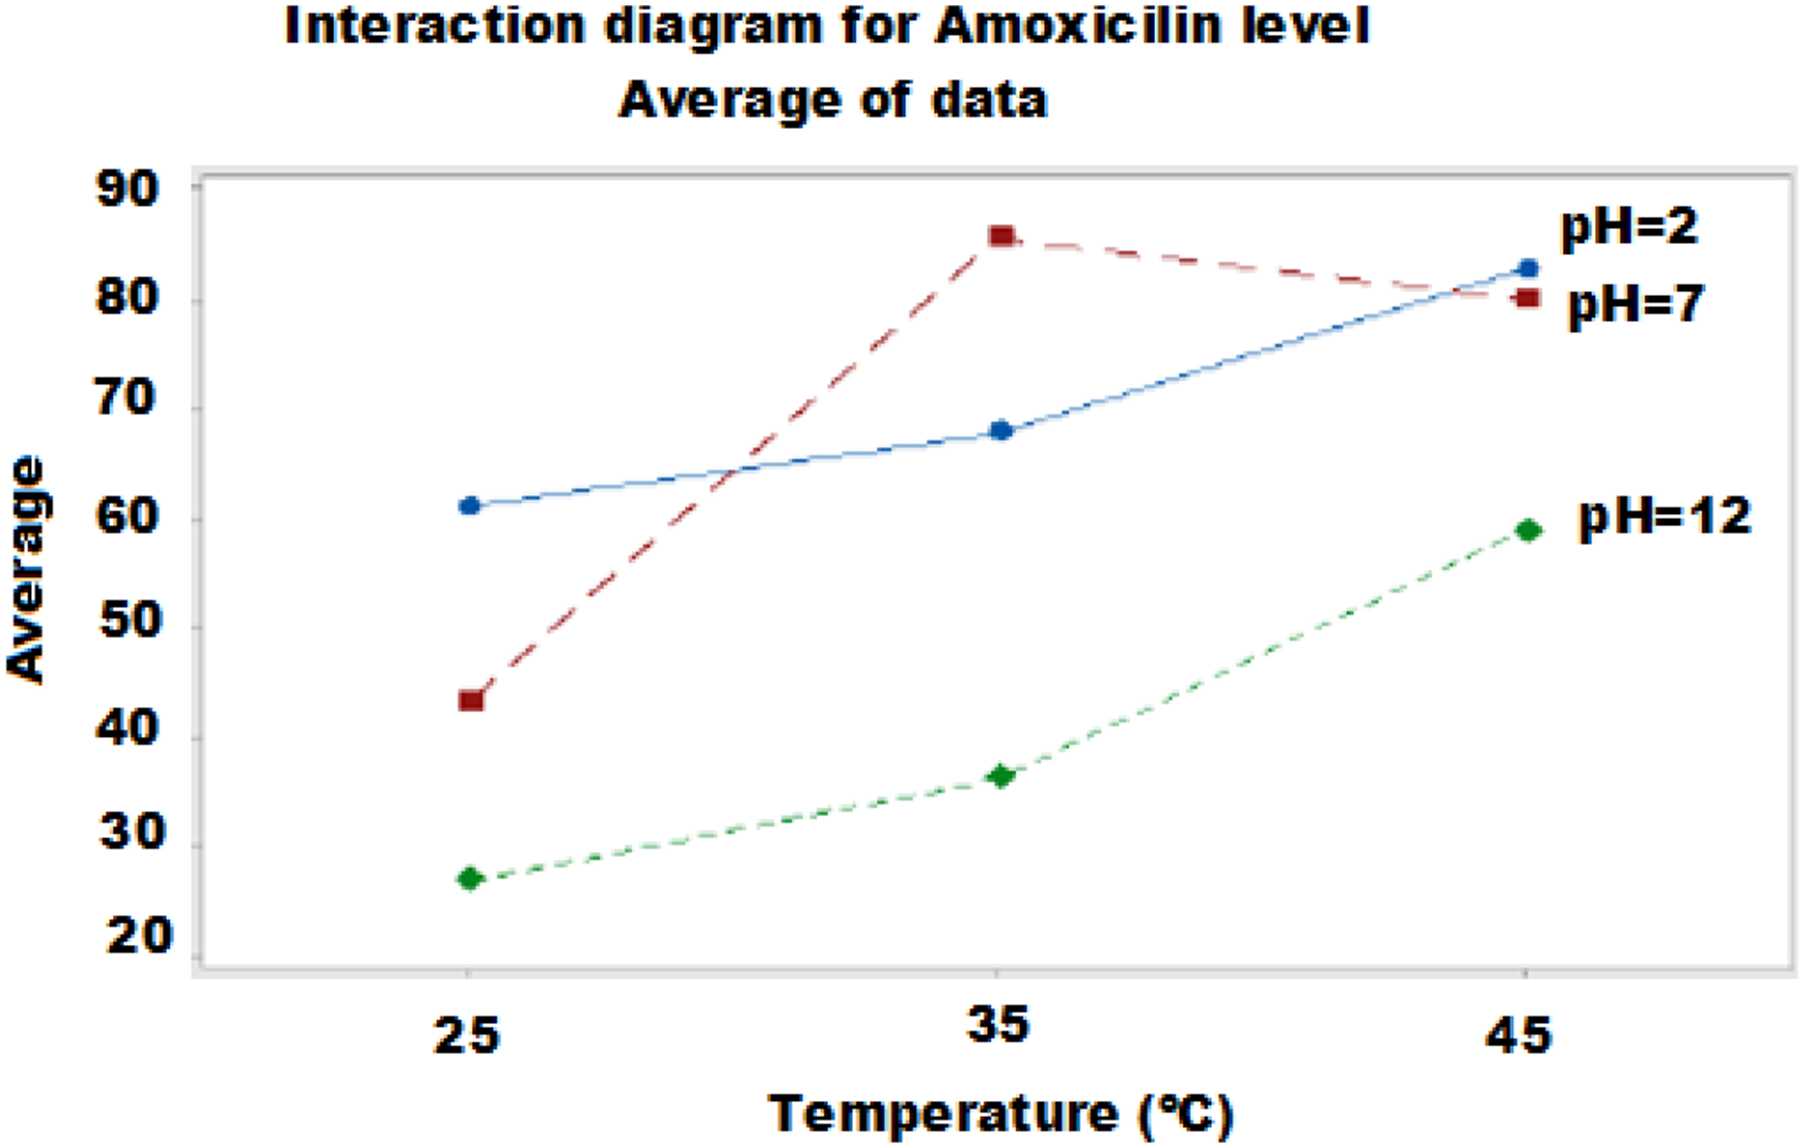
Diagram of the Interaction Effects of the Factors pH and Temperature T (°C)
For a dose of 0.025 g requires an acidic medium to achieve an elimination rate of 75%, while a maximum elimination rate at pH 7 and an adsorbent dose of 0.1125 g, then it decreases by increasing the dose up to 0.2 g; the results are summarized in Figure 11. Diagram of the interaction effects of pH and dose factors.
Optimization by RSM and with Desirability Function
The Minitab software offers a graphical route to study the interactions of the terms of the 2D contour model, adapted to binary interactions. Contour plots of the second order polynomial equation in two independent variables (pH - temperature, pH - adsorbent dose, pH - temperature, pH - Co); the other parameters are kept at fixed values. Contour plots of the second order polynomial equation in two independent variables (pH and temperature, pH and Co, pH and adsorbent dose for Amox). It can also include the main factor and the interaction impacts of two independent factors. 59
Examination of the 2D curves of the binary variables allows us to delineate the following optimal conditions to obtain maximum elimination of Amox (pH 6, T = 45°C; and AC dose = 0.125 g/L). The desirability function (Figure 12) makes it possible to simultaneously know the optimal parameters (pH 5.03, T = 45°C; AC dose = 0.125 g/L with R (%) = 89.99) of the variables of input that determines the optimal value. Performance levels for one or more responses occur in two stages: i) Find the levels of the independent variables that simultaneously produce the most desirable, predicted responses on the dependent variables. ii) Maximize overall desirability with respect to controllable factors, the desirability function approach was initially introduced by Harrington.
60
Predicted responses using desirability function.

Adsorption Isotherms
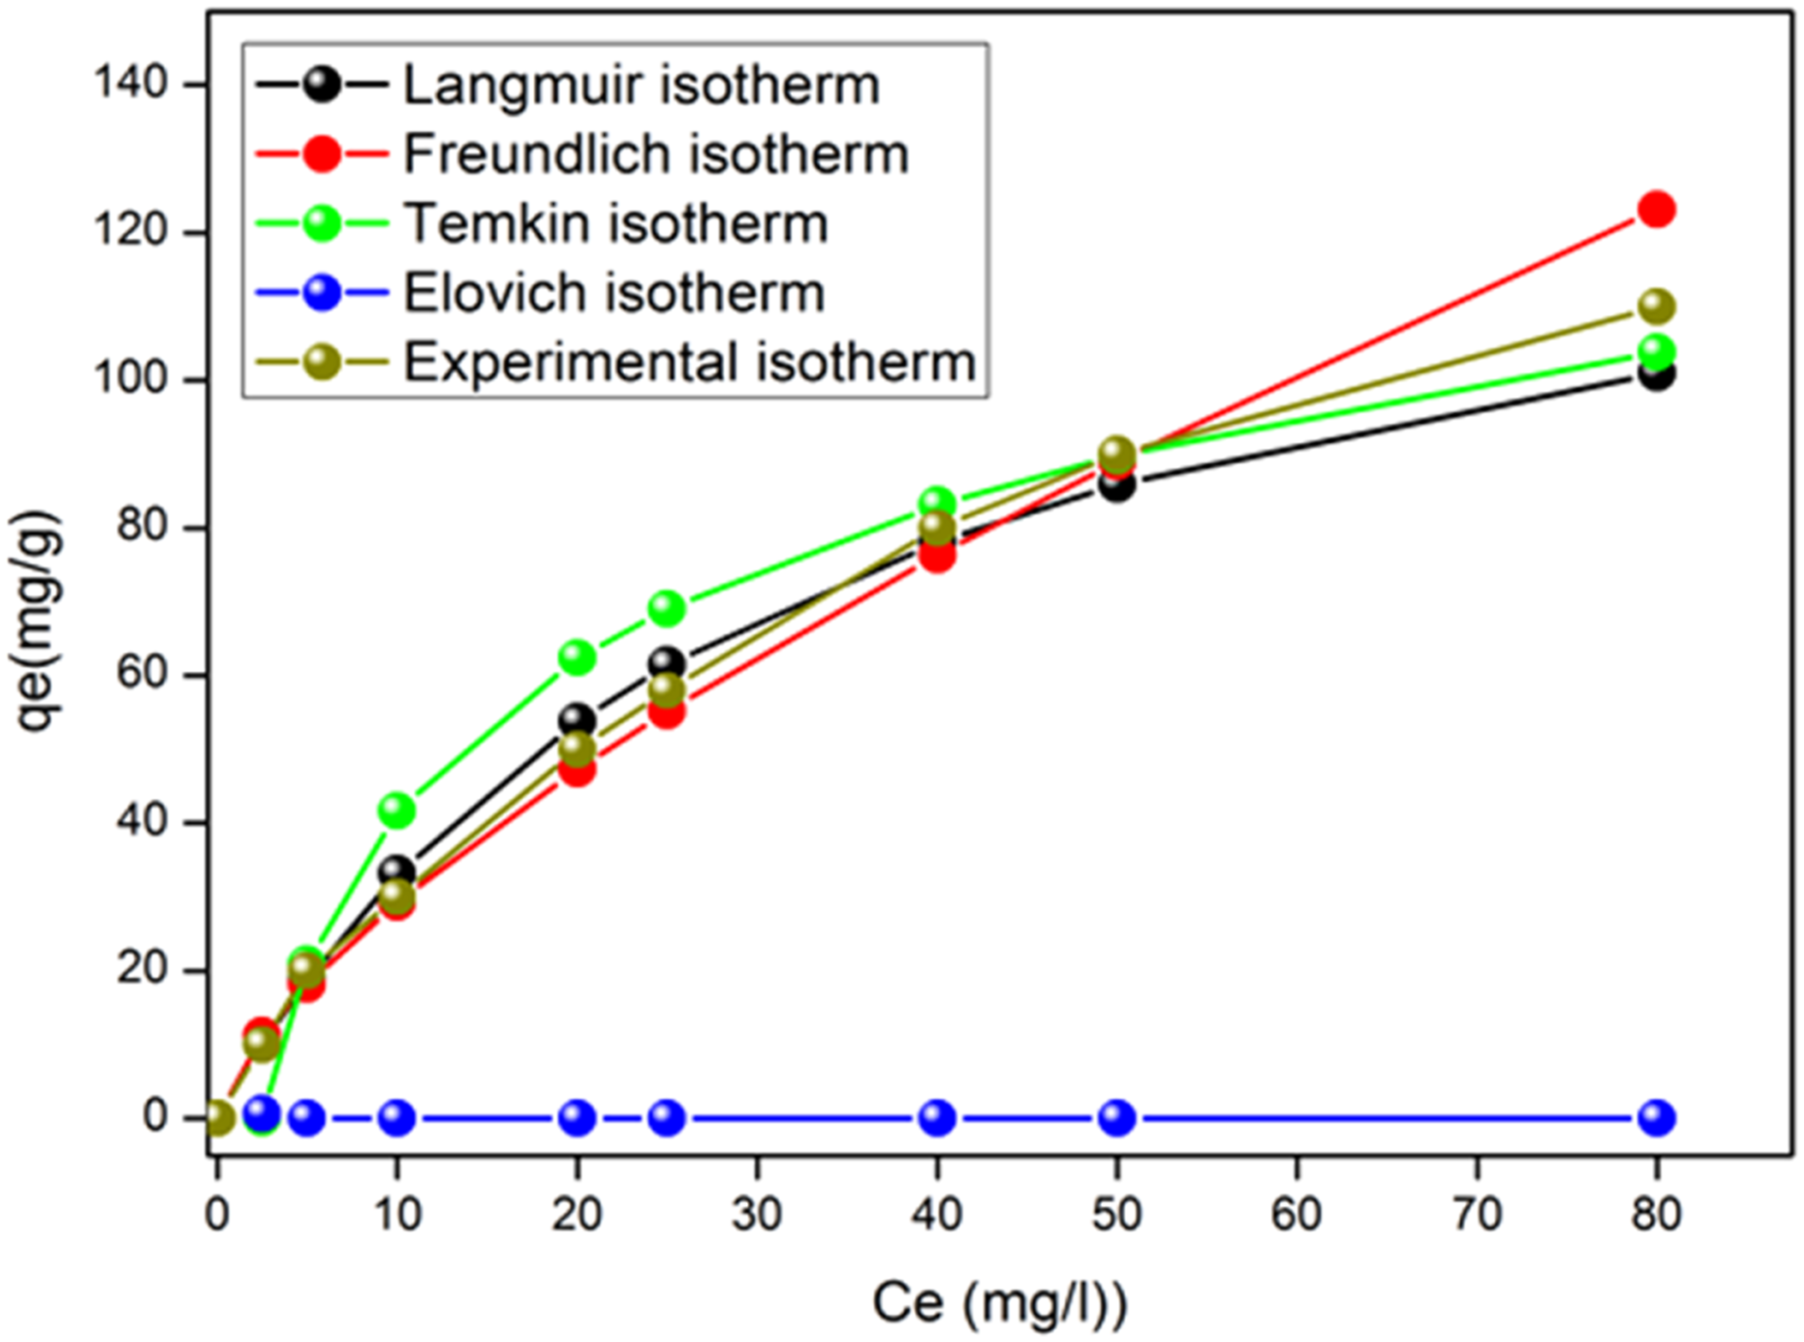
Adsorption isotherms were applied to evaluate the amount of Amox adsorbed on AC surface and the type of interaction. The graphical representation of the linearized forms of the four isotherms (Figure 13) allowed us to calculate the constants of the different models (Table 5). The evaluation of the physical condition of the data at equilibrium, based on the coefficient R2 as a criterion, shows the applicability of the Langmuir and Temkin models to interpret the data with a maximum adsorption capacity i) The adsorption sites have identical adsorption energy. ii) The adsorbate occupies only one site on the surface, with no interaction between the adsorbate molecules iii) The adsorption is mostly confined to the adsorbent surface. Isotherms Adsorption for the different models in the optimum conditions. Different Parameters for Adsorption Isotherm Models for the Removal of Amox Onto AC.

Comparison with Other Adsorbents Used for the Removal of Amoxicillin
Comparison of Maximum Adsorption Capacity With Other Adsorbents Reported in the Literature.

Desorption constitutes an intermediate step towards the regeneration of the adsorbent. It is an essential tool to evaluate the reuse of any adsorbent for large-scale applications, due to ecological concerns and sustainable development needs. This study gave encouraging results. We wish to extend our study to column adsorption tests under conditions applicable to the treatment of industrial effluents.
Adsorption Kinetic Modeling
The kinetics of Amox adsorption is crucial to determine the optimized operating conditions for a large-scale process. It gives the absorption rate of the adsorbate, controls the residual time of the overall process and predicts both the adsorption rate and the adsorption design. Different models have been proposed to study the behavior of adsorbents and propose the mechanisms controlling adsorption. The adsorption kinetics is examined using pseudo 73 and second-order 74 kinetic models given by:
Pseudo first order model:
Pseudo second order model:

Where q
t
(mg/g) is the adsorbed amount at the time t (min), K
1
(min−1) and K
2
(g/mg.min) are the pseudo-first order and pseudo-second order rate constants respectively. The slope and intercept of the plots ln(q
e
-q
t
) vs time (t) are used to calculate the constants K
1
and q
e
while K
2
and q
e
are deduced from the plot of t/q
e
vs. t (Figure 14). For the pseudo-first-order kinetic, the experimental data deviate from linearity, suggesting the inapplicability of the model for the present system. On the other hand, the pseudo-second order kinetic model presents the best correlation (R = 0.999), and the adsorption process is predominated by chemisorption. The kinetic constants K1, K2, and the calculated adsorption capacities deduced after modeling are grouped together in Table 7. Effect of pH on the Adsorption Kinetic. Different Parameters for Adsorption Kinetics Models for the Removal Of Amox Onto AC.

Conclusion
The removal of pollutants from wastewater is an environmental concern, particularly pharmaceutical effluents, which pose risks to human health and the ecosystem. In this regard, activated carbon constitutes a promising adsorbent for which optimization of adsorption is essential to maximize efficiency.
In this study, statistical methodology and Box–Behnken Response Surface Design were found to be effective and reliable in finding the optimal conditions for the adsorption of amoxicillin onto activated carbon. The response surface design with desirability function (df) was applied to evaluate the interactive effects of three independent variables namely pH, temperature and adsorbent dose on the response R (%).
The experimental data were treated by analysis of variance (ANOVA) and adjusted by a second order polynomial using multiple regression analysis. The optimal conditions: adsorbent dose (0.125 g), T (45°C) and pH (5.037) led to a maximum removal of amoxicillin of 89.99%. The isotherms were analyzed by different models and the Langmuir equation, gave the best fit to the equilibrium, where 142.85 mg/g of amoxicillin (R2 = 0.999) at 25°C was removed from the solution.The pseudo-second order kinetic model gave the best correlation (R2 = 0.999), and adsorption of amoxicillin is predominated by chemisorption.
This study demonstrated that activated carbon has a high adsorption capacity compared to adsorbents reported in the literature and the study of the photodegradation of Amoxicillin in the presence of a semiconductor constitutes a logical continuation of this study.
Footnotes
Authors Contribution
M.ABBAS conceived and designed the study, performed the experiments and analyzed the data. And M.Trari revise and correction of the manuscript. All authors reviewed and approved the final version of the manuscript.
Declaration of Conflicting Interests
The author(s) declared no potential conflicts of interest with respect to the research, authorship, and/or publication of this article.
Funding
The author(s) received no financial support for the research, authorship, and/or publication of this article.
Data Availability Statement
All data presented in this study are included in the manuscript by the corresponding author.