
Abstract
Adsorption techniques are widely used to remove some classes of pollutants from waters, especially those which are not easily biodegradable. The removal of Methylene blue (MB), as a pollutant, from waste waters of textile, paper, printing and other industries has been addressed by the researchers. The aim of this study is to eliminate MB by Activated Coconut Shells (ACS) produced at low cost by adsorption in batch mode. The ACS was characterized by the FTIR spectroscopy and point of zero charge (pHpzc: 5.06). Some examined factors were found to have significant impacts on the MB uptake of ACS like the initial dye concentration Co (40-120 mg/L), solution pH (2-8), ACS dose (1-12 g/L), agitation speed (50-500 r/min), particles size (1.0-1.2 mm) and temperature (298-333 K). The best capacity was found at pH 6 with an adsorbent dose 8 g/L, an agitation speed 200 r/min and a contact time of 60 min. Modeling Kinetics and Isotherms shows that the pseudo-second-order kinetic model with R2 (0.935 -0.998) and Langmuir adsorption isotherm model provide better fitness to the experimental data with the maximum adsorption capacity of 30.30 mg/g at 25°C. The separation factor RL (0.933-0.541) in the concentration range studied (10-120 mg/L) shows a favorable adsorption. The isotherms at different temperatures have been used for the determination of the free energy ΔG° (198-9.72 kJ/mol); enthalpy ΔH° (82.082 kJ/mol) and entropy ΔSo (245.689 J/K mol) to predict the nature of MB adsorption process. The positive values of (ΔGo) and (ΔHo) indicate a non-spontaneous and endothermic MB adsorption with a chemisorption. The adsorbent elaborated from Coconut Shells was found to efficient and suitable for the removal of MB dye from aqueous solutions, due to its availability, low cost preparation and good uptake capacity.
Introduction
Water contamination by dyes can lead to various environmental problems. Colored water can affect plant life and thus an entire ecosystem can be destroyed by contamination of various dyes in water. 1 Although MB is used in some medical applications, it can also be used in textile, leather, food processing, dyeing, cosmetics, paper, dye manufacturing and printing. With the increasing focus on environmentally friendly industry, it is important to move towards the low-cost and effective methods for wastewater treatment. MB causes eye burns, which can be responsible for permanent damage and can cause several health hazards, such as nervous system and liver damage when ingested. Therefore, the treatment of effluents containing this dye is of interest because of its aesthetic impacts on receiving waters. The presence of dyes in water increases the chemical and biochemical oxygen demand. The global demand for water and the amount of wastewater produced continues to increase, creating an urgent need for purification methods. Wastewater is often discharged into rivers and lakes or seeps into aquifers, significantly affecting freshwater quality. Globally, more than 80% of wastewater returns to the environment untreated with negative consequences for the marine environment. 2 Indeed, A about 600 organic and inorganic pollutants has been listed in water along with biological species. 3 The presence of dyes, even in low concentrations, weakens the penetration of light through the water surface, significantly inhibiting the photosynthetic process of aquatic flora, according to the Beer-Lambert law. Currently, there are about 10 000 types of synthetic dyes with a global production of 7 × 10⁵ tons per year. 4 MB is a cationic dye appears as a green crystalline powder, highly soluble in water. MB is a cationic dye that comes in the form of a green crystalline powder, highly soluble in water. It is used for dyeing cotton, paper, silk, wood and leather products. 5 Therefore, many treatments were applied to limit the its concentration in aqueous medium like adsorption,6–14 biological treatment, 15 detoxification, 16 photo catalysis17,18 and electrochemical degradation. 19 Adsorption is attractive for the removal of pollutants because of its low cost, simplicity of design, removal efficiency, and ease of use and availability of materials. In this respect, agricultural wastes have advantages as adsorbents, they are readily available, cost-effectiveness, renewable, require less processing time, with an uptake capability and can be easily regenerated. They can be modified by treating it with chemical agents, alkalis, acids, organic compounds, etc., or thermally, this modification could have beneficial effects on chemical/physical properties like increasing surface area, improved pore structure and functional group. This has prompted a growing research interest in the production of activated carbons from renewable and cheaper precursors which are either industrial or agricultural by-products, for the water treatment. Modified carbons exhibit adsorption capacity with selectivity and sensitivity. 20 In this optic, agricultural wastes such as cotton stalk, 2 olive stones, 21 coconut shell, 22 rice husk, 23 orange peel, 6 pistachio shell 24 wheat bran 25 titanium dioxide 26 mesoporous silicate. 27 Modified Tetra selmis sp, 28 hybrid polymer 29 and Chitosan30,31 are used in recent years for their availability. The aim of this study is to eliminate Methylene blue by adsorption on Activated Coconut Shells (ACS), produced at low cost by adsorption in batch mode. The characteristic of ACS was investigated and the influences of operational parameters namely pH, adsorbent dose, contact time, temperature, particle size and initial dye concentration were also reported. The equilibrium adsorption data were fitted to various equations to obtain the constants related to the MB elimination. Finally, this study focuses on the important points, namely the synthesis of low-cost activated carbon from waste and its valorization in water treatment. This is in order to contribute to the reduction of environmental pollution which remains a global problem, to move from batch mode to column mode, to carry out tests on a semi-pilot scale and to carry out theoretical simulations of adsorption phenomena. The tests of homogeneous photodegradation of the dye on the TiO2 semiconductor will be a logical continuation of this study in the near future.
Materials and Methods
The spectrophotometry is a technique which owes its development to progress in the quantum mechanics allowing, among other things, to identify a chemical substance and to determine the concentration in solution. Two light sources were used: a visible tungsten halogen lamp and a UV deuterium lamp; the scanning speed was set at 1200 nm min−1. Blanks were performed in a quartz cell (10 mm) and calibrated with ultrapure water. Residual concentration measurements were obtained by linear interpolation from a calibration graph. The pH of the solutions was accurately measured with a microprocessor-based pH meter of the HANNA HI 8521 type, calibrated with commercial buffers of pH 4, and 10. The pH was adjusted to by using H2SO4 and NaOH obtained from Sigma - Aldrich Company (respectively for acidic and basic media.
The FT-IR spectroscopy was used to identify the functional groups of ACS. 5 mg of adsorbent were mixed with dry KBr (Extra pure) of spectroscopy quality and pressed under 4 kbar to form thin pellet. Then, the FTIR spectra were plotted with a Perkin Elmer 2000 infrared spectrometer in the range (4000-400 cm−1) for 16 times to increase the “signal / noise” ratio.
The Zero Point Charge (pHzpc) of the adsorbent, ie, the pH for which the surface charge is zero, is obtained using a procedure reported elsewhere. 32 20 mL of KNO3 (99.40%) solutions (0.01 M) were placed in closed conical flasks; the pH of each solution was adjusted between 2 and 14 by addition of HCl (37%) or NaOH (97%) solution. Then, 0.1 g of adsorbent was added to each solution and the final pH was measured after 24 h under magnetic stirring at 25°C; pHpzc is the point of intersection of the final pH and initial pH lines.
Methylene Blue Adsorbate
Methylene Blue Properties.

Preparation of Adsorbent
Almond shell is the lignocellulosic material forming the thick endocarp of the almond fruit and represents more than 50% of the total weight of the seed and constitutes a significant percentage as raw material used for the preparation of activated carbons. The shells obtained are washed thoroughly with distilled water to remove any kind of dust or adhering impurities until clear washing water was obtained. The material was dried at 110°C (24 h) to avoid possible alteration of the physicochemical properties of the material. Several researchers have practiced moderate drying of the biosorbent, in particular using solar energy. The particle sizes used for the adsorption tests were isolated mechanically by means of a sieve whose mesh size corresponds to diameters [0.71- 0.22 mm], and the samples were stored in bottles. Pyrolysis is necessary to transform the raw material; the carbonaceous raw materials are very characteristic with an infinite number of pores clogged by organic matter. This carbonaceous material must be freed from all these organic products. To do this, it is heated to a high temperature of 700°C in a rotary kiln. After washing and drying, part of the material is subjected to a heat treatment. The material is carbonized at a temperature of 700°C (5°/min., 1 h. This process gives a carbon with narrow pores and generates microscopic alveoli on the surface of the carbon, thus increasing its active surface and its adsorption power.
Adsorption Experiment
The effects of the initial MB concentration (Co:40-120 mg/L), pH (2-8), adsorbent dosage(1-12 g/L), stirring speed (50 - 500 r/min) and temperature (20-60°C) on the MB adsorption was investigated in batch mode for a specific contact time (0-60 min). The MB solutions were prepared by dissolving the accurate amount MB (99 %) in distilled water, used as a stock solution and diluted to the required initial concentrations. Adsorption was carried out at room temperature under atmospheric pressure. It was performed by introducing a mass of adsorbent into a glass Erlenmeyer (100 mL capacity), containing 100 mL of an aqueous solution of determined concentration. The mixture was magnetically stirred at 150 r/min for a fixed time.
Then, separation was performed by centrifugation (6000 r/min, 5 min) and the suspension was analyzed by UV-Visible spectroscopy (λmax = 662 nm) to determine the residual concentration of MB. The amount qt (mg/g) yield R (%) of adsorbed MB (qt) was calculated from the relations:

To confirm the correlation, a statistical error calculation is essential, among the most used error functions are the following. Due to the inherent bias resulting from linearization of the isotherm and kinetic models, for non-linear regression, the determination coefficient (R
2
) is insufficient for evaluating the fit goodness, thus, the error models, Chi-Squares 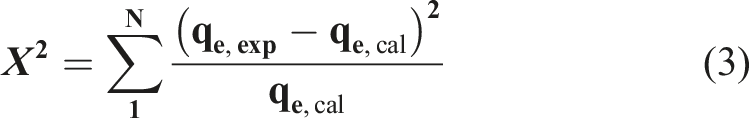
Results and Discussion
Characterization of Adsorbent
Figure 1 shows that the FT-IR spectra have similar profiles, but with different band intensities. A broad band at around 3420 cm−1 corresponding to the elongation of O-H groups, the wide band at 2926 cm−1 is related to the elongation of C−H group, the band at 1739 cm−1 corresponding to the C = O group while that band at 1605 cm−1 is characteristic of the elongations of C = C bonds of olefins and aromatics, the band located at 1383 cm−1 is linked to the C-H deformations in the aliphatic chains whereas that centered at 1045 cm−1 characteristic of the deformation in the plane of Aliphatic C-O. These bands result from the presence of cellulose, hemicelluloses and lignin, major constituents of coconut shell. FTIR spectra for Activated Coconut shell (ACS).
Analyses of the ACS Surface Morphology
The SEM micrographs of ACS before and after adsorption are shown in Figure 2; the prepared ACS presents a microporous structure with different pore diameters and a rough surface and many protrusions. The higher magnification shows that the adsorbent surface contains a considerable number of pores with a high probability that MB molecules are adsorbed. After adsorption, the ACS surface became smoother where the roughness was considerably reduced with less visible pores, indicating a clear adsorption on both the surface and in pores. The images also reveal that the exterior surfaces of the ACS are filled with inhomogeneous cavities of different sizes and shapes. These cavities differ from carbon to carbon in the reaction of the activating agent; they are the external pores which represent the main channels for accessing to internal surface (micropores and mesopores) of the activated carbon. Microscopic images of the adsorbent (ACS): (a) Before adsorption of MB (b) After adsorption of MB.
Influence of contact time and MB concentration of on the adsorption capacity
MB concentrations and the adsorbent dose are important factors for adsorption. To demonstrate the effect of the initial concentration (Co), experiments were performed in the range Co (40-120 mg/L) and ACS dose of 5g/L. The temperature was kept constant at 25°C and the mixture was stirred at 200 r/min. Samples were collected at regular time intervals, centrifuged and analyzed spectrophotometrically.
Figure 3 shows a very rapid adsorption, where a saturation level is reached after 60 min.; the latter indicates the formation of a monolayer. It is noted that the adsorption capacity increases with Co; this is due to the fact that the diffusion of MB molecules towards the surface of the adsorbent is accelerated by the concentration gradient according to the diffusion law; a similar result has already been obtained for the adsorption of MB on apricot kernels.
23
By increasing the concentration Co (40 - 120 mg/L), the MB removal efficiency decreases from (79 to 41%) and it can be deduced that the adsorption of MB on ACS occurs in three stages: (i) In range (0-20 min) fast adsorption of MB due to the presence of free sites on the adsorbent surface which translates the linear increase of the adsorption capacity over time. (ii) In range (20-50 min) reduction of the adsorption rate, reflected by a small increase in the adsorption capacity attributed to the decrease in the quantity of MB in solution and the number of available unoccupied sites (iii) In range (50-60 min) stability of the adsorption capacity is observed, due to the complete occupation of adsorption sites: the establishment of the stable level therefore reflects this stage. The adsorption capacity of MB increases over time to reach a maximum after 60 min. and thereafter tends toward a constant value indicating that no more MB are removed from the solution. Effect of contact time and concentration on the adsorption of MB onto ACS: (Adsorbent dose: 5 g/L, Co: (40-120 ppm), Particle size: 0.2 mm, pH: 6, Agitation speed: 200 r/min, and T: 25°C).

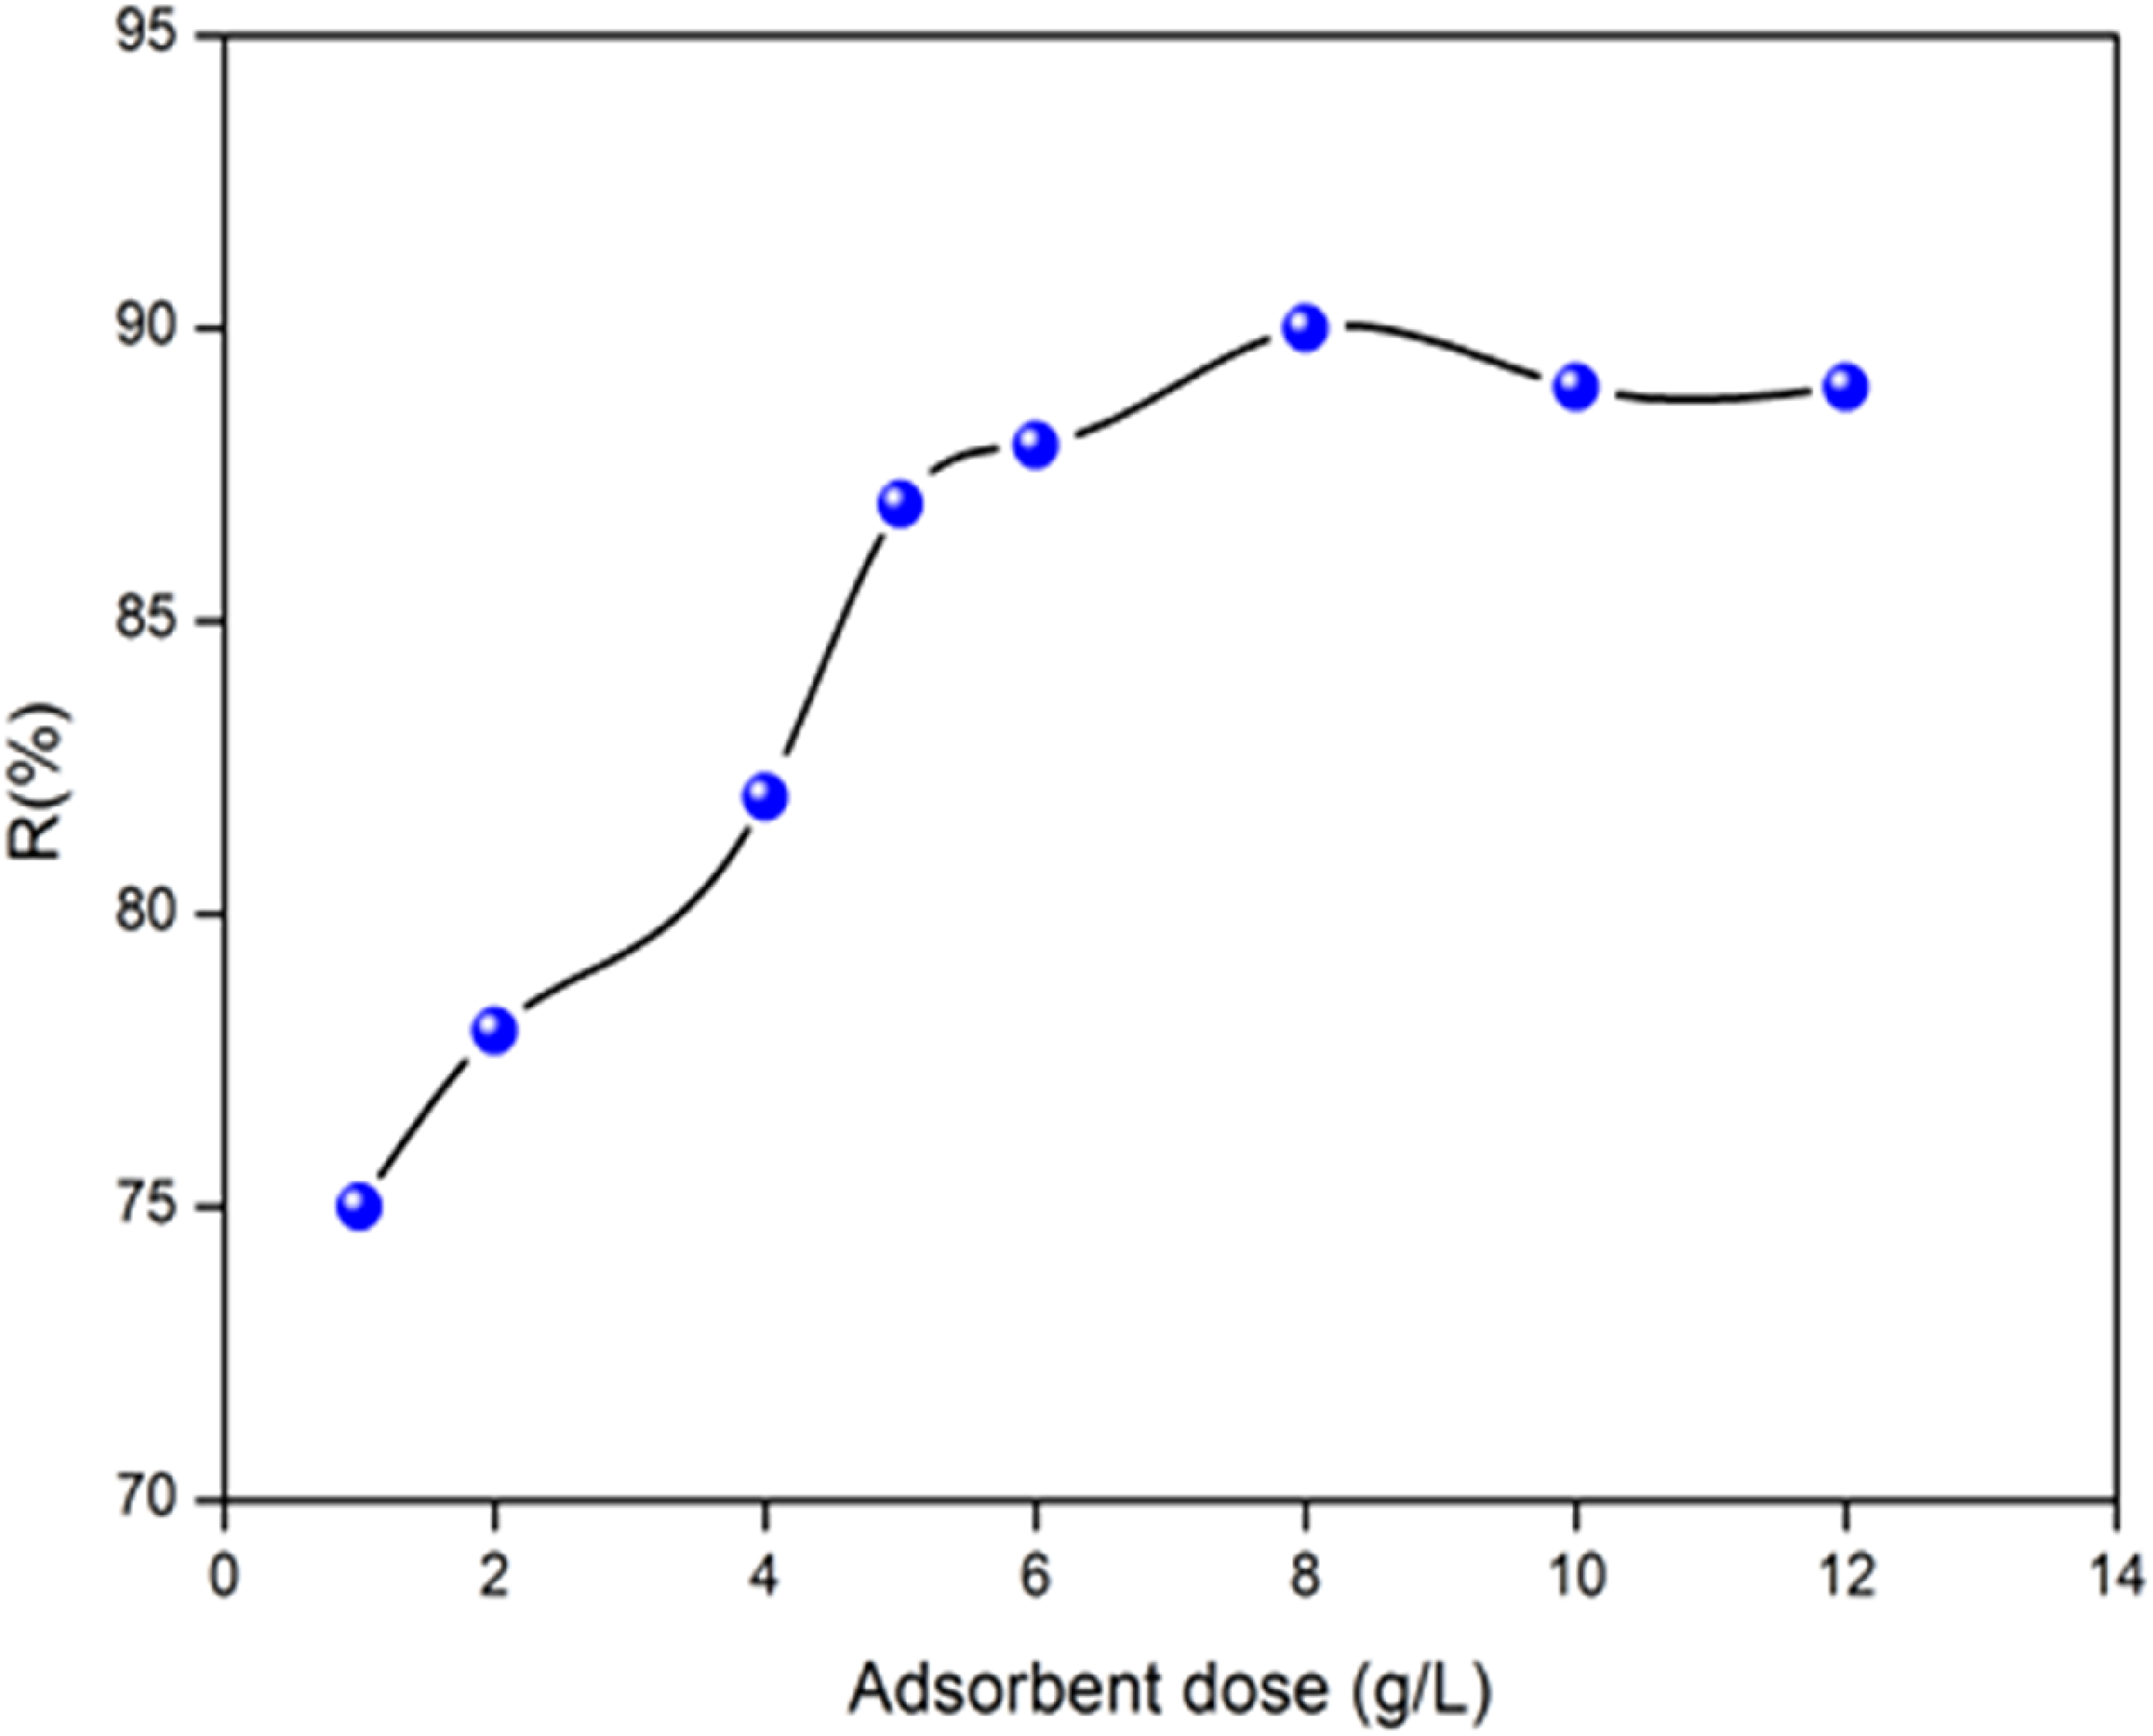
Influence of adsorbent dosage
Determination of the minimum mass of a material required to adsorb a given pollutant is an essential step in adsorption. We started this step on the removal of MB and to evaluate the optimal ACS content, test experiments were performed on a MB solution (10 mg/L), to which different amounts of adsorbent were added in the range (1 - 12 g/L). The variations of the amount of MB adsorbed during the contact time, as a function of the ACS dose, are illustrated in Figure 4. As expected, the amount of MB adsorbed increases in the range (1 - 8 g/L), due to the number of available sites that increases with the amount of ACS and decreases in the region (9 - 12 g/L), where the number of sites becomes stable33,34; this behavior can be explained by: (i) As long as the amount of adsorbent added to the MB solution is low, the MB molecules can easily access the adsorption sites. The addition of adsorbent increases the number of available sites but the dye charges, depending on its functional groups, have difficulty approaching these sites due to steric hindrance (the electrical state of the surface of the adsorbent with the dye); (ii) A large amount of adsorbent promotes particle agglomeration, resulting in a reduction of the active adsorption surface and a decrease in the amount of adsorbate per unit mass of adsorbent. Therefore, an adsorbent dose of 8 g/L was selected for subsequent experiments. Effect of adsorbent dose on the adsorption of MB onto ACS: (Co = 10 ppm, Particle size: 0.2 mm, pH = 6, Agitation speed: 200 r/min, time 60 min, and T = 25°C).
Influence of pH
Adsorption is a surface phenomenon, which depends on the morphology of the adsorbent and is linked to the net charge on the surface. The latter is conditioned by the nature of the functional groups present, which are a combination of positive and negative groups. Indeed, at low pHs, the predominance of H+ ions in solution favors the neutralization of negative surface charges and the total charge is dominant and positive. On the other hand, at basic pH the surface charge is negative. Monitoring the evolution of the surface charge shows that it passes through a state of neutrality, the corresponding state of which is known as the zero point charge (pHpzc). Indeed, pHpzc represents the boundary where the surface charge is zero and changes sign. ACS has pHpzc of 5.06 Figure 5.
35
At low pH, ACS is characterized by an anion exchange capacity: The addition of H+ cations generates a positive charge, the anions in solution are therefore more attracted to this surface, which slows down adsorption.
36
At alkaline pH, a cation exchange capacity develops: OH− ions bind more and a negative charge develops, where the cations in solution are attracted to the surface. Figure 6 shows the evolution of the amount of MB adsorbed as a function of pH and reached with an optimum value at pH 6. Determination of load predominance zones (pHzpc). Effect of pH on the adsorption of MB onto ACS (Adsorbent dose: 8 g/L, Co: 10 mg/L, Particle size: 0.2 mm, Agitation speed: 200 r/min, time: 60 min, and T: 25°C).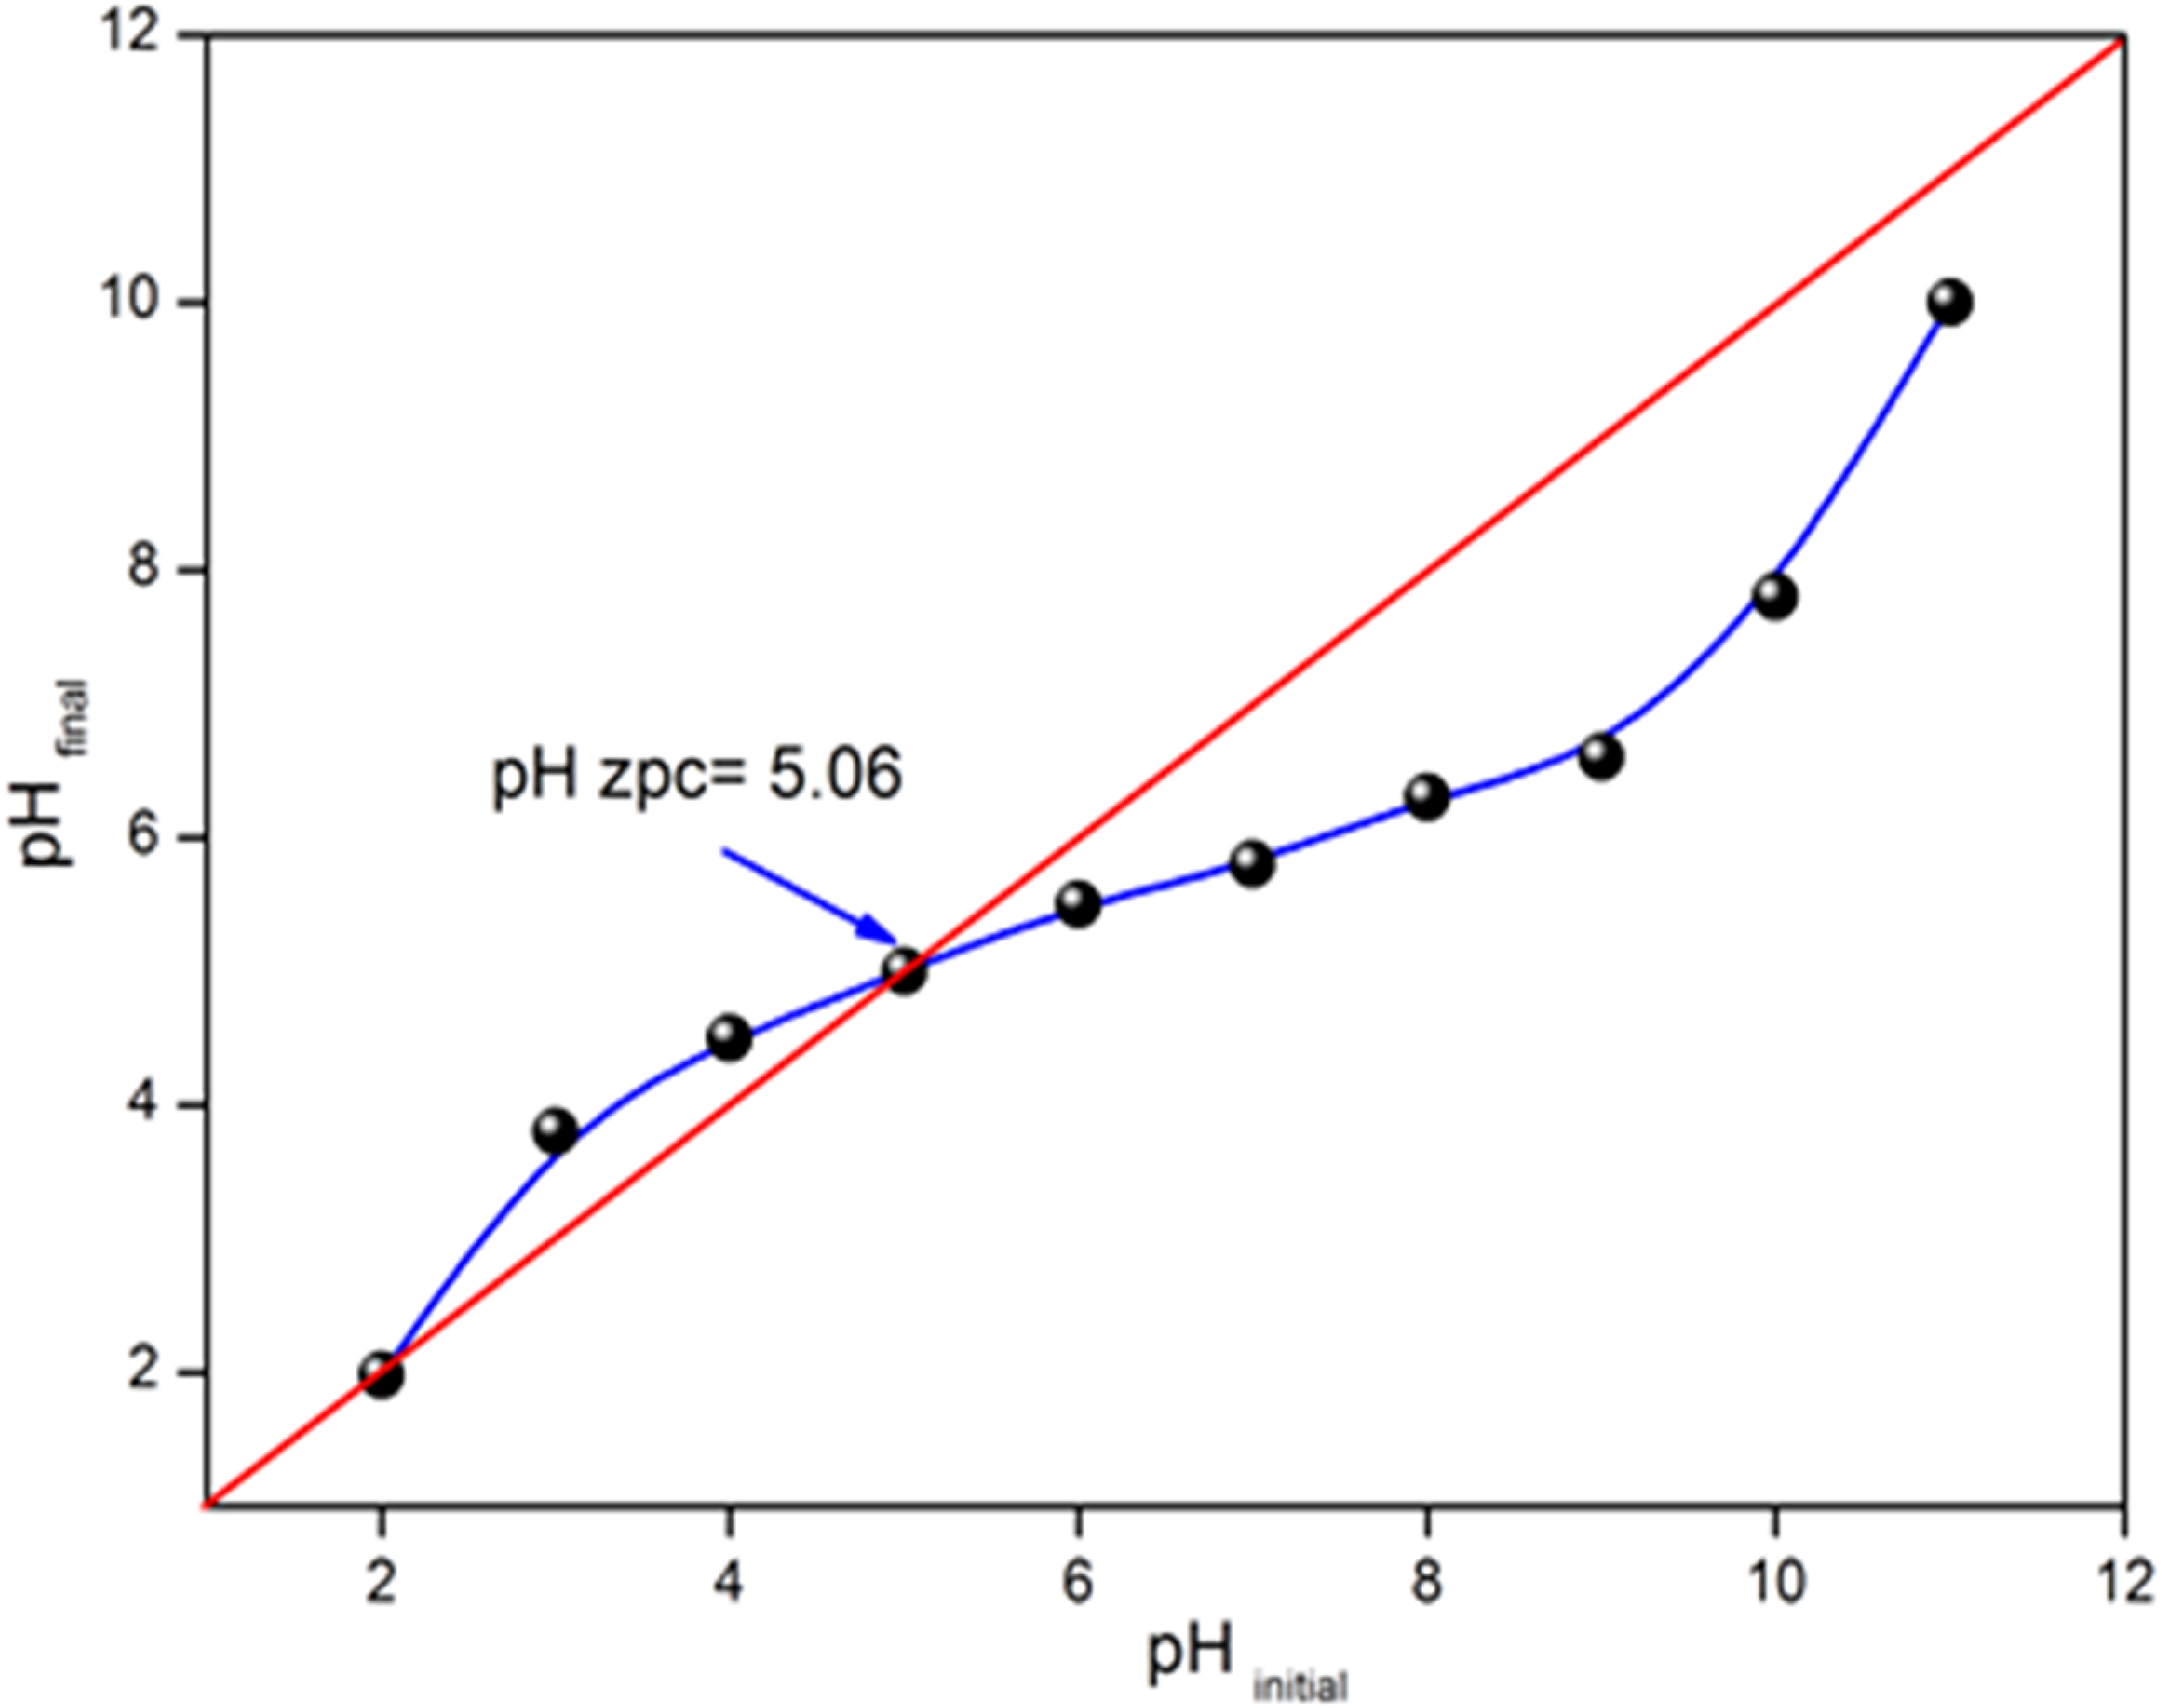

Effect of Agitation Speed on the Adsorption of MB
The effect of the stirring speed (50-500 r/min) on the adsorption capacity of MB onto ACS is also investigated. The optimal uptake capacity is obtained for a speed of 200 r/min (Figure 7) which gives the best homogeneity of the mixture suspension. Therefore, a speed of 200 r/min was selected for further experiments. Effect of agitation speed on the adsorption of MB onto ACS: (Adsorbent dose: 8 g/L, Co: 10 mg/L, Particle size: 0.2 mm, pH: 6, time: 60 min, and T: 25°C).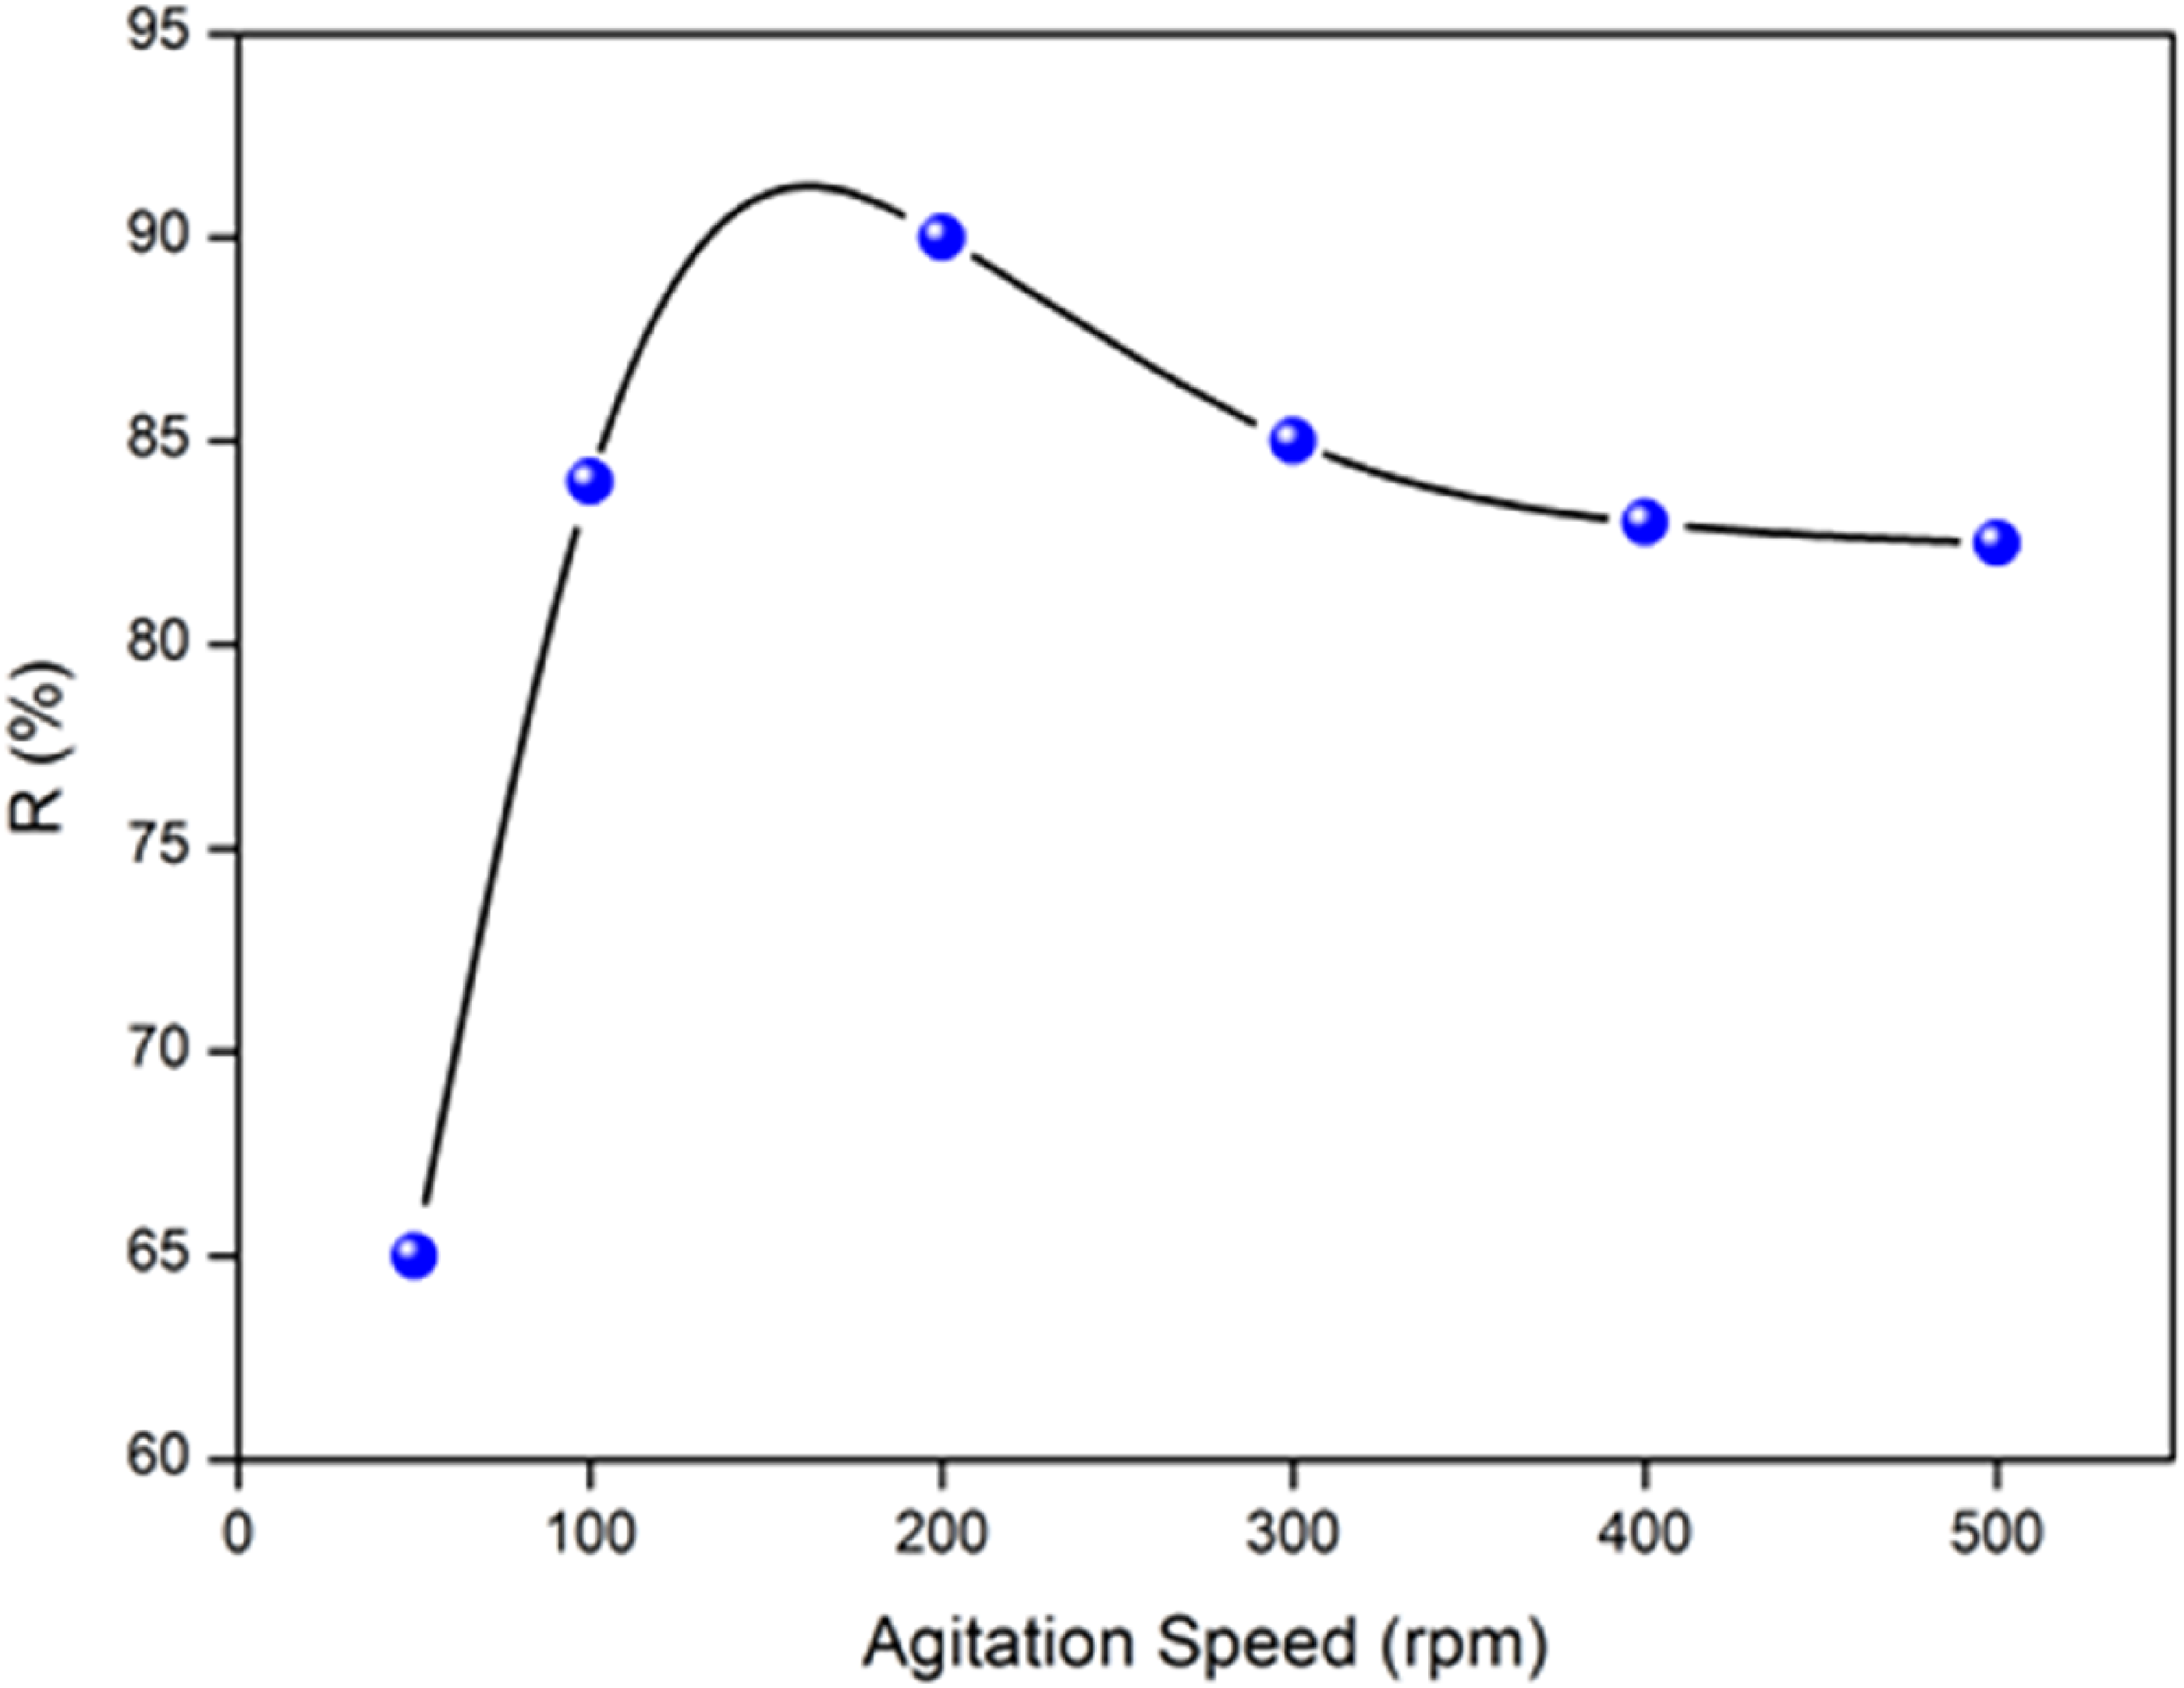
Influence of Particles Size
In the first stage of the batch adsorption experiments, the effect of the particle size on the MB adsorption onto ACS is examined. Significant variations in the MB uptake capacity and removal efficiency are observed for different particles sizes (0.2-1.20 mm); Figure 8 shows that the best performance is obtained for smaller sizes (0.20 mm). In general, smaller particles provide large surface areas, thus resulting in high MB uptake performance and removal efficiency. Therefore, the class 0.2 mm was subsequently used in all other adsorption experiments. Effect of particles size on the adsorption of MB onto ACS: (Adsorbent dose: 8 g/L, Co: 10 mg/L, pH: 6, Agitation speed: 200 r/min, time: 60 min, and T: 25°C).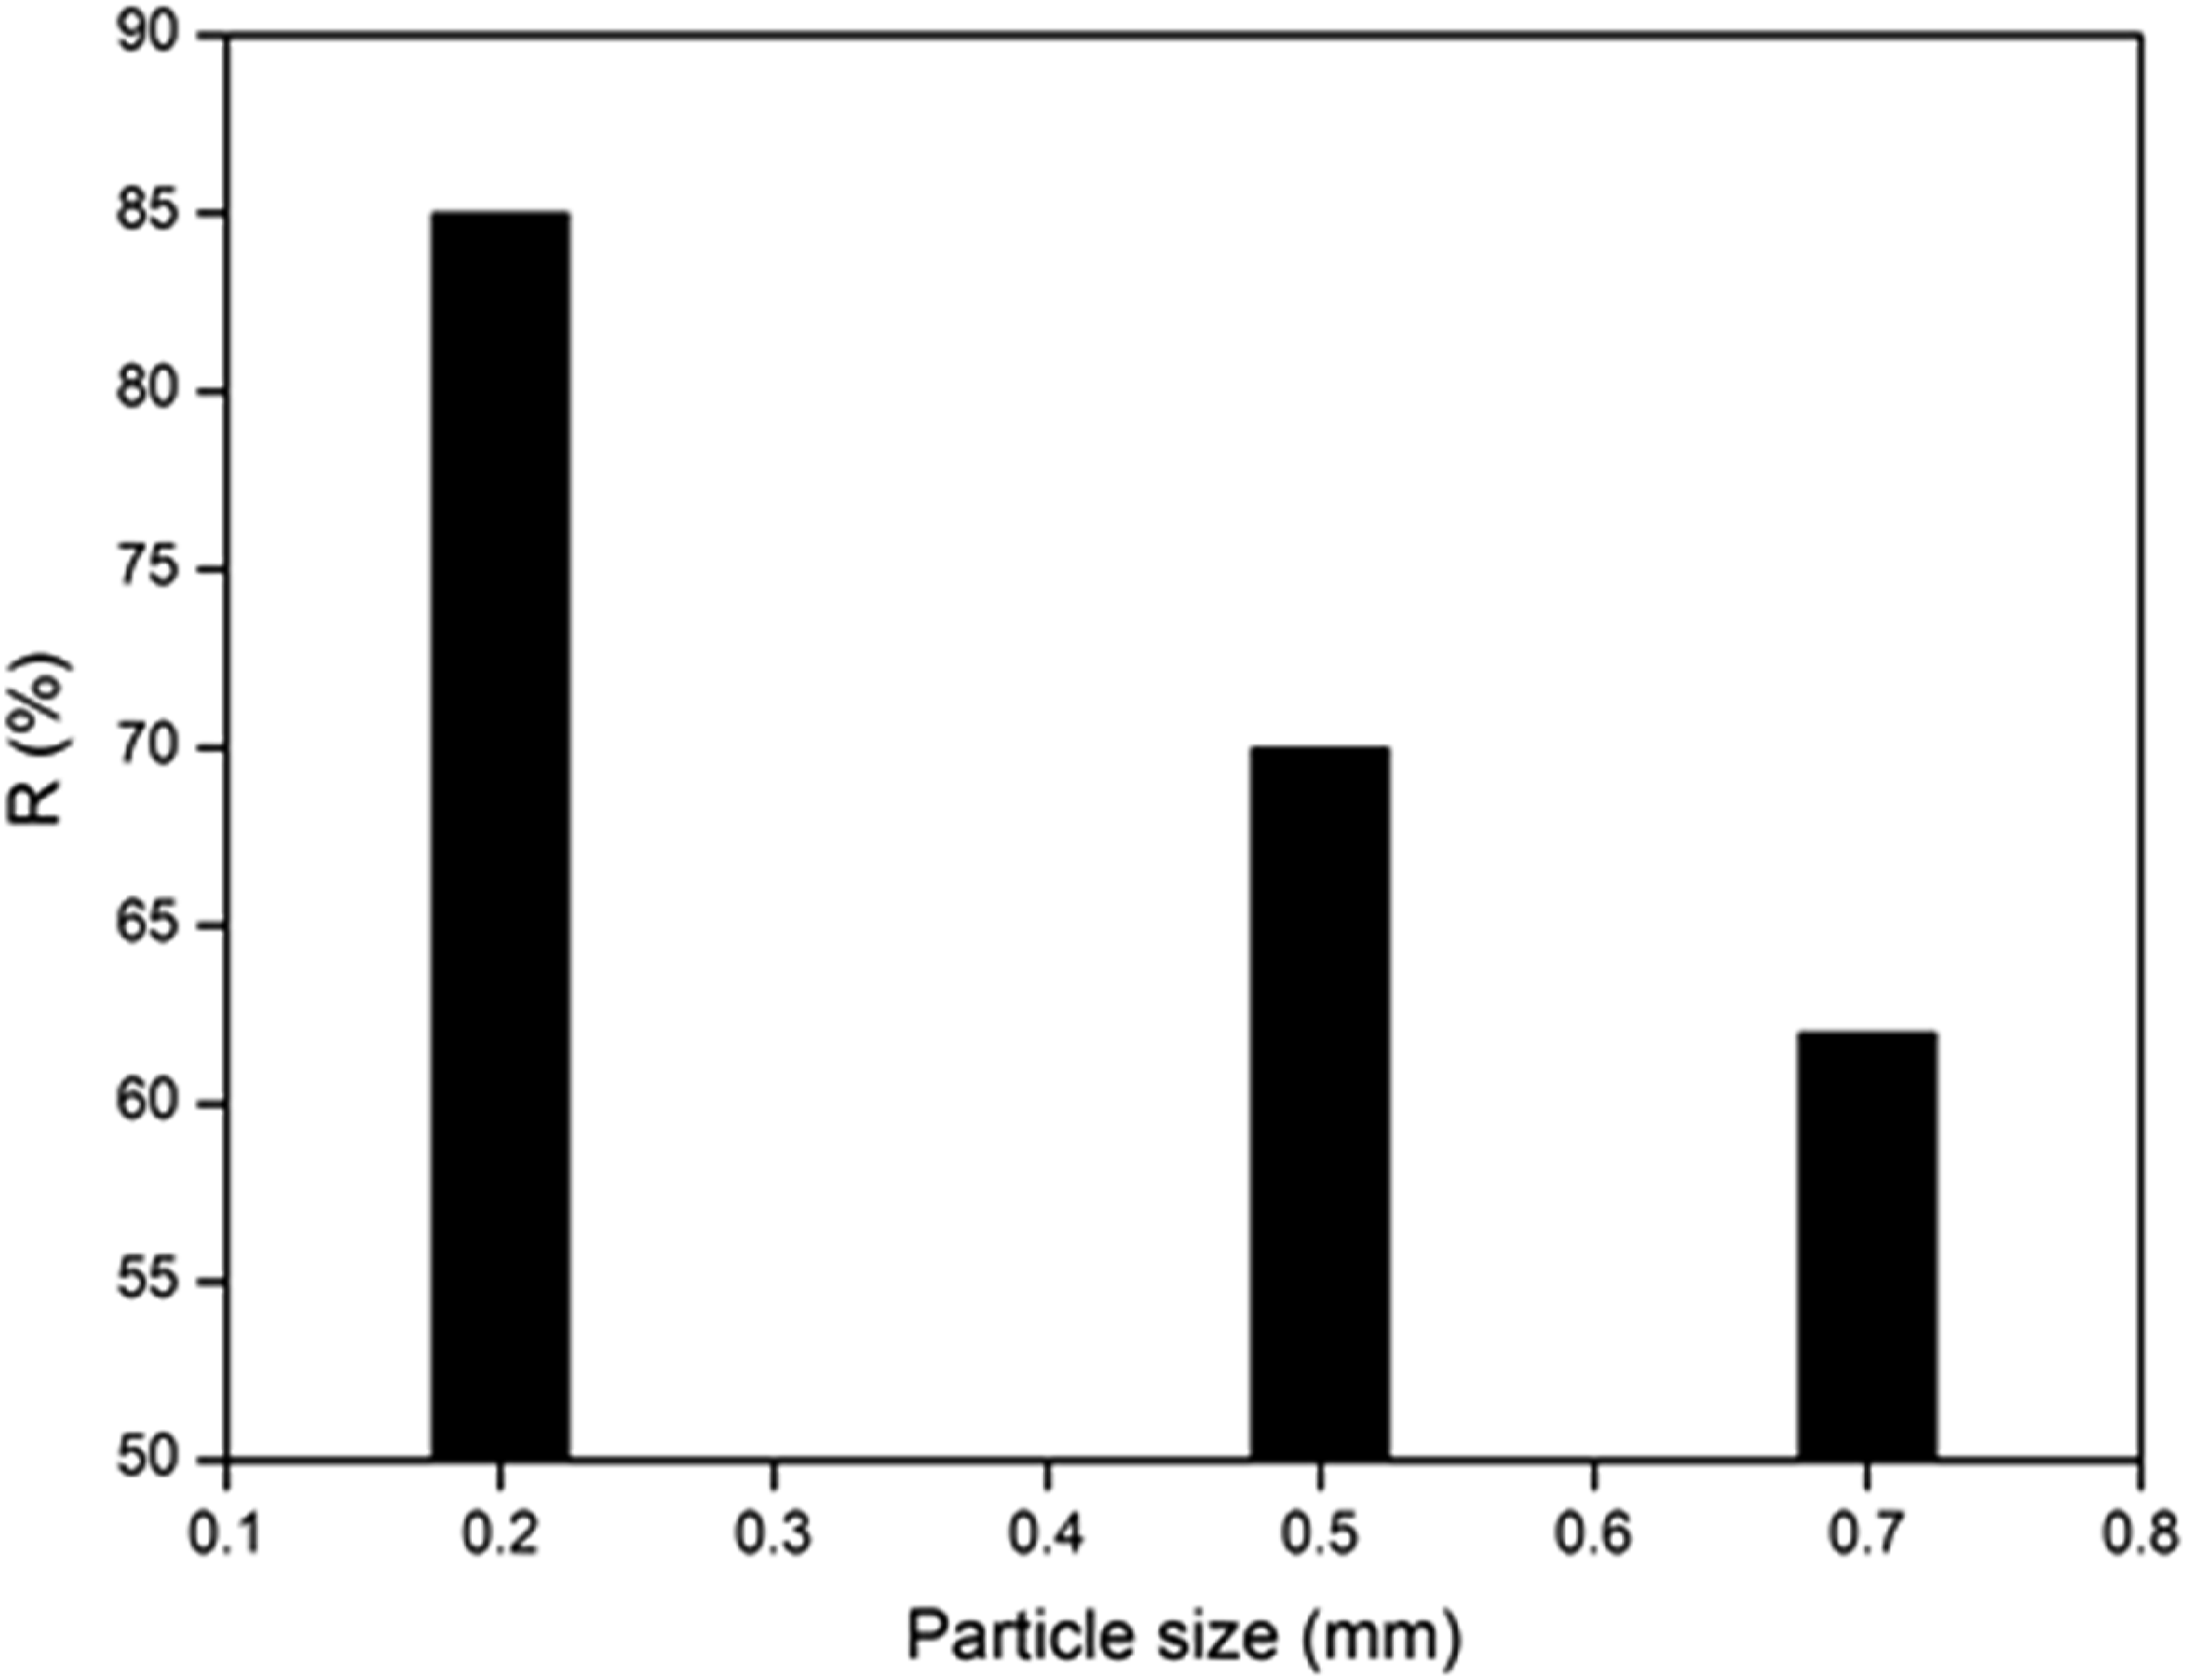
Sorption Kinetic Models
Adsorption kinetics is crucial for the design of the adsorption systems, which determines the time required to reach the steady state and many models describing the diffusion of solutes on the surface and in the pores of the adsorbent have been developed. Pseudo-first-order, pseudo-second-order, Elovich, and intraparticle diffusion are used to examine the adsorption rates of MB on ACS.
Pseudo-first-order model: It is based on the assumption that the absorption rate is directly proportional to the gradient, ie, of concentrations.
37
This model is generally applicable to the initial stage of an adsorption process and the nonlinear form of the model is given by the following equation:
The pseudo-second-order model: This kinetic model, proposed by Ho and McKay,
38
assumes that the rate-limiting step is the chemisorption, where electron sharing or exchange occurs between the solute and the sorbent. This involves the adsorption of an adsorbate molecule onto two active sites on the sorbent surface where the nonlinear form of the model is given:
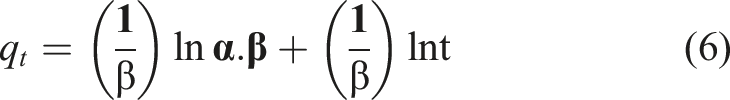
The Elovich model: It is used to interpret adsorption kinetics and successfully describes second-order kinetics assuming an energetically heterogeneous surface
39
:

Constants of Kinetic Models (Adsorbent Dose: 5 g/L, Co: (10 -120 ppm), Particle Size: 0.2 mm, pH: 6, Agitation Speed: 200 r/min, and T: 25°C).
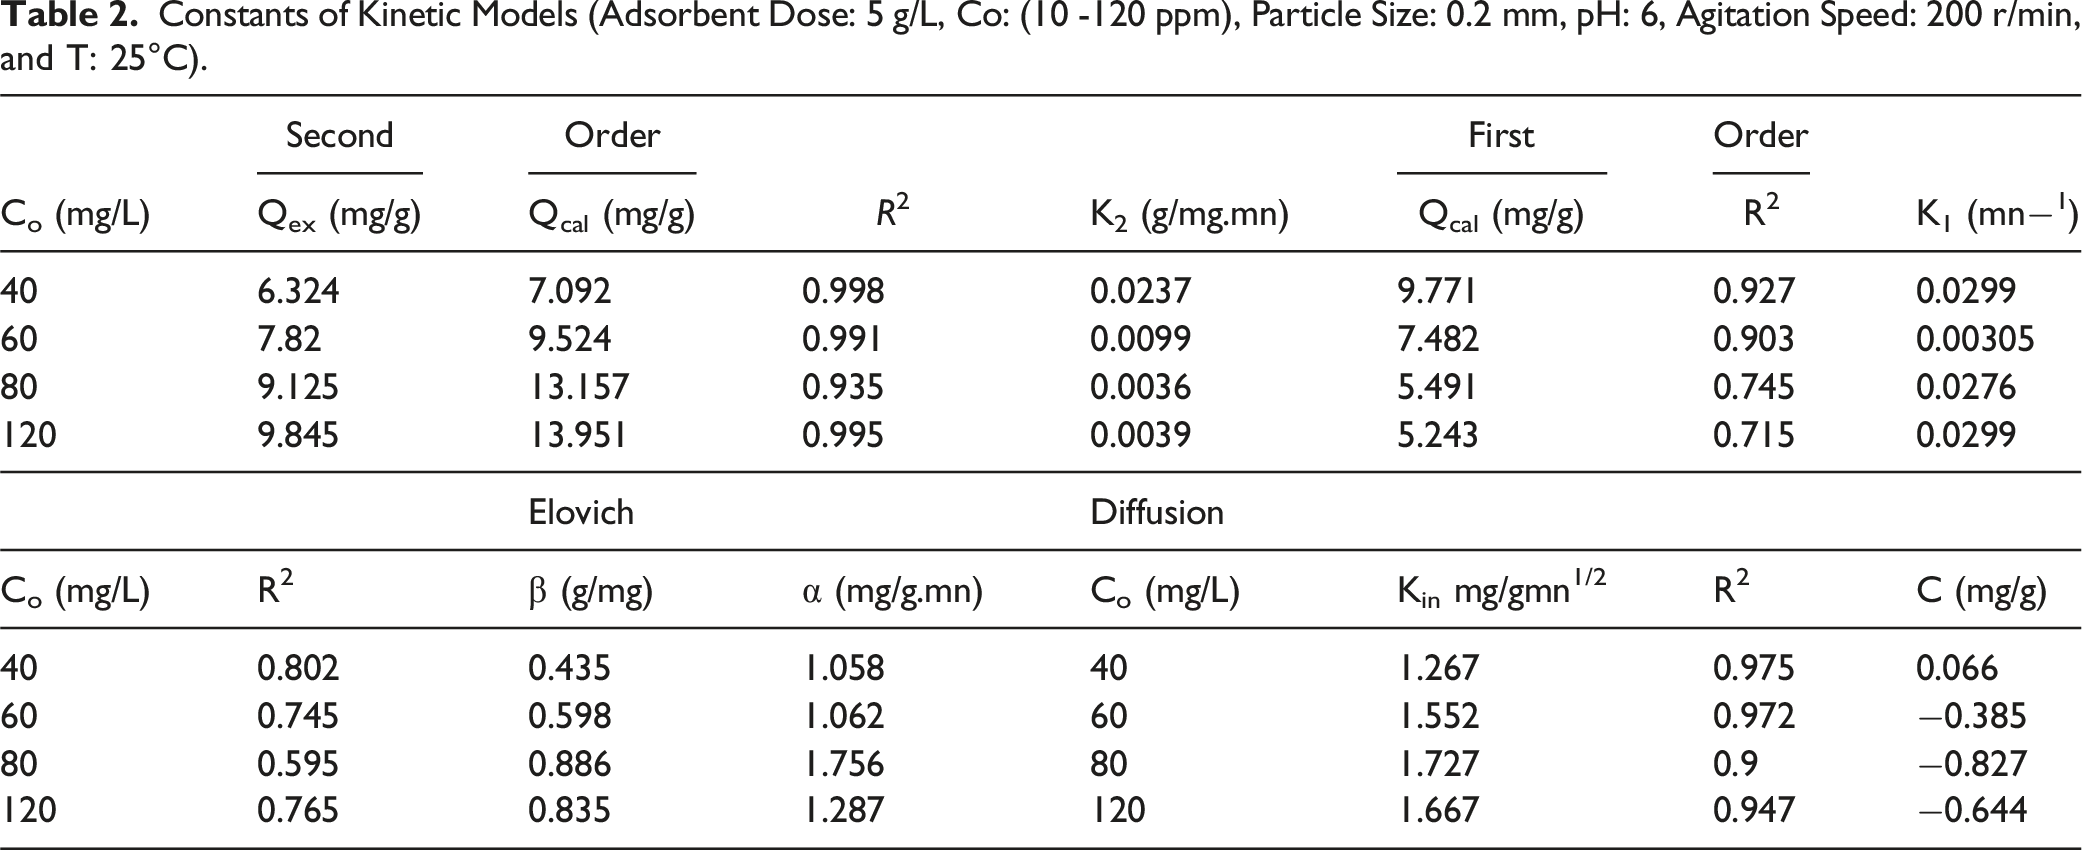
The relationship between qt and t1/2 shows a multilinear curve of the experimental MB data, which reflects different types of diffusion. (i) The first step explains the external mass transfer of dissolved MB to the outer surface of ACS. (ii) The second and last stages reflect the porous diffusion and equilibrium phases, respectively.
Therefore, MB adsorption is driven by more than one mechanism, ie, both chemical reaction and pore diffusion processes are involved in the iodine uptake by the adsorbent. If intraparticle diffusion occurs, then the plot qt vs t1/2 is linear and passes through the origin, indicating that intraparticle diffusion is the only parameter controlling the process. Otherwise, other mechanisms are also involved. The intersection gives an indication of the boundary layer thickness; the greater this, the greater the boundary layer effect.
Adsorption Equilibrium Isotherms
Adsorption isotherms that describe how an adsorbate interacts with the adsorbent are essential for adsorption optimization. The amount of adsorbate per unit mass of adsorbent at equilibrium, qe (mg/g) and the equilibrium adsorbate concentration, Ce (mg/L) are used to plot the adsorption isotherm, qe as a function of Ce (Figure 9). Mathematical models are used to describe the adsorption. The experimental data were fitted by four models: Langmuir, Freundlich, Temkin and Elovich that describe the solid-liquid sorption of MB on ACS. adsorption Isotherm of MB onto ACS in the optimum condition (Adsorbent dose: 8 g/L, Particle size: 0.2 mm, pH: 6, Agitation speed: 200 r/min, time: 60 min, and T: 25°C).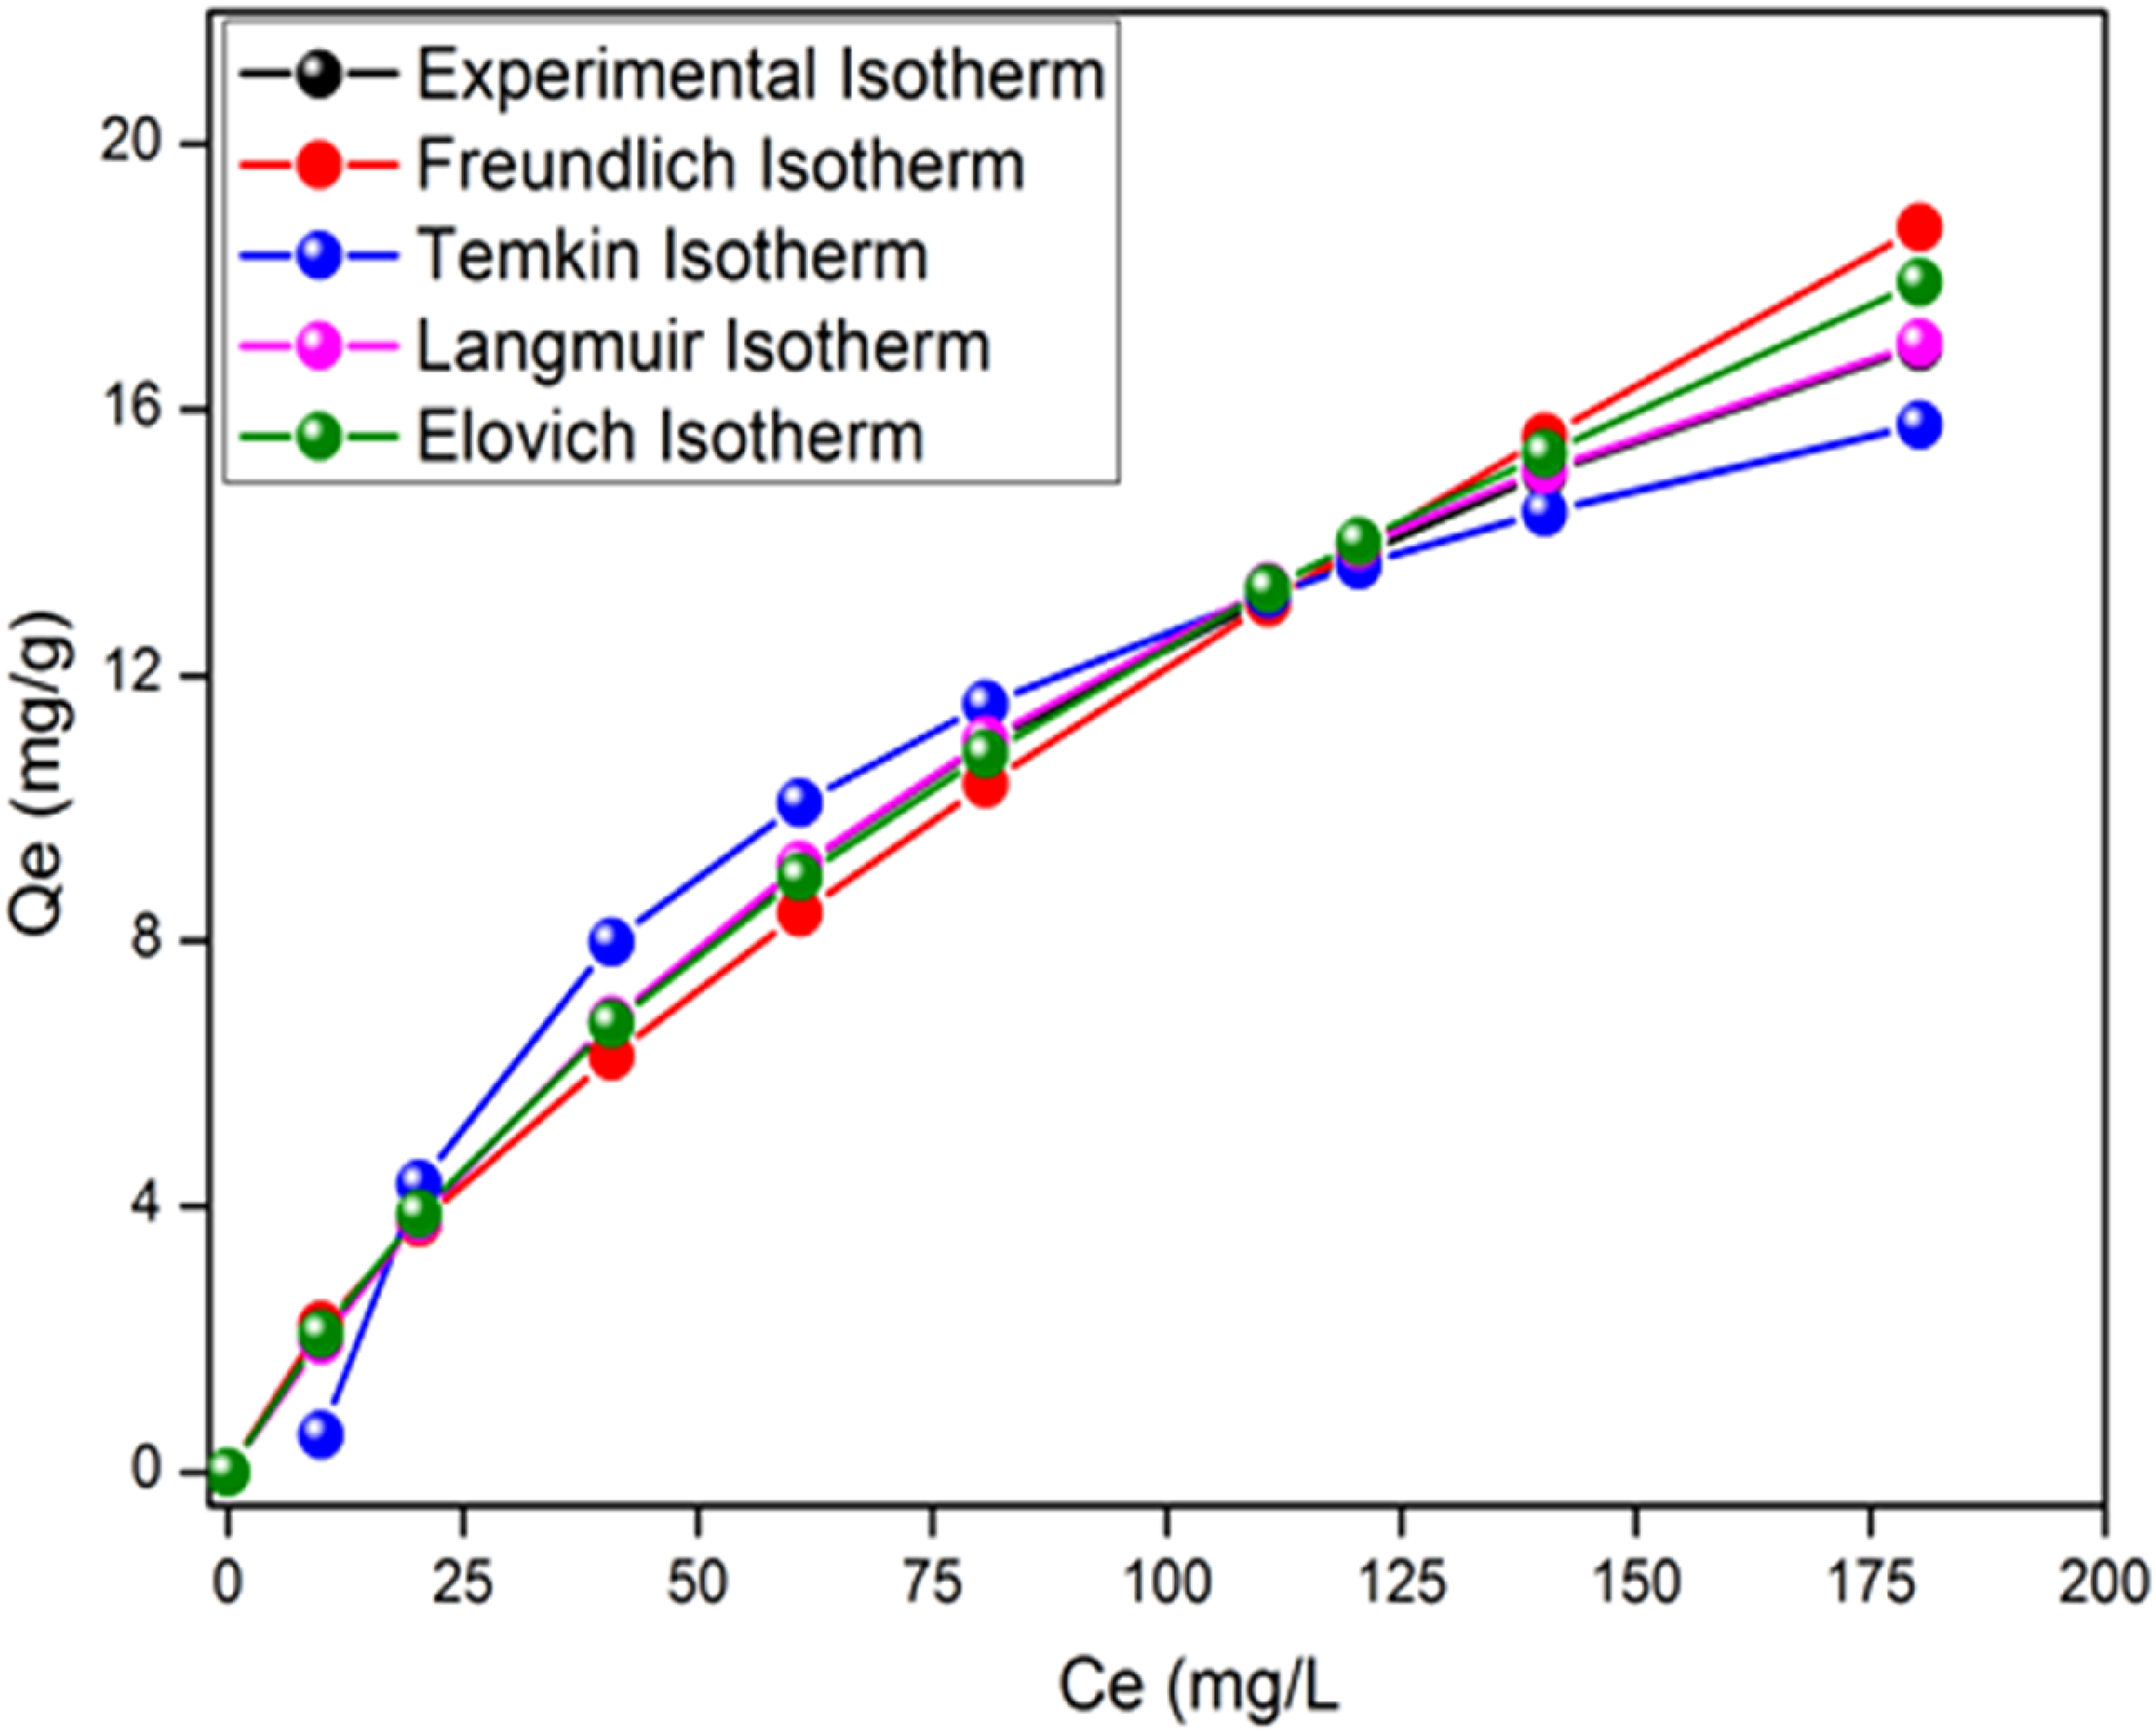
Langmuir model
41
postulates the occurrence of monolayer adsorption on a fixed number of localized sites. The model assumes that a given adsorbent surface is composed of sites equivalent in their enthalpies but without additional motion and without interactions of the adsorbed molecules; the linear expression is given by

The type of isotherm is indicated by the RL value: (RL = 0): irreversible, (0 < RL <1): favourable, (RL = 1): linear, (RL >1): unfavourable.
Freundlich’s model
42
is based on the formation of multi layers of adsorbed species on a heterogeneous surface. The enthalpies have a logarithmic distribution where the energy sites with high affinity for the adsorbate are occupied first, followed by the lower energy sites. The sorption process is summed over all sites and the linear expression of the model is given by:
K
F
(L/g) and
Temkin’s model
43
postulates the heterogeneity of an adsorbent surface, whose adsorption energy distribution is linear

Elovich model
44
assumes that the number of adsorption sites augments exponentially with the adsorption, thus implying a multilayer adsorption:
Adsorption isotherms were applied to evaluate the amount of adsobate accumulation on the adsorbent surface and the type of interaction. The graphical representation of the linearized forms of the four models allowed us to calculate the constants of the different models (Table 3). The experimental equilibrium data evaluated by classical models, based on the R2 coefficient as a criterion, show the applicability of the Langmuir and Temkin models with a maximum adsorption capacity (i) The adsorption sites have identical adsorption energy. (ii) The adsorbate occupies only one site on the surface. (iii) The adsorption is mostly confined to the adsorbent surface. Constants of Isotherms Models (Adsorbent Dose: 8 g/L, Particle Size: 0.2 mm, pH: 6, Agitation Speed: 200 r/min, Time: 60 min, and T: 25°C).

Influence of Temperature
Temperature is an important factor that influences the adsorption of solutes on the surface of activated carbons. Its importance is not limited only to the need to understand how it affects adsorption and desorption. The experimental results obtained allow access to the thermodynamic functions, which are evaluated from the modeling of the experimental results with adequate theoretical models. The variation of the adsorbed quantity qads the MB equilibrium as a function of temperature (10 °C–60°C), is illustrated in Figure 10. Effect of Temperature on the adsorption of MB onto ACS: (Adsorbent dosage: 8 g/L, Co: 10 mg/L, Particle size: 0.2 mm, pH: 6, Agitation speed: 200 r/min, time: 60 min).
Thermodynamic Properties Modeling Studies
The adsorption capacity of MB increases with temperature (20 °C–60°C), beyond which vaporization becomes problematic. The adsorption mechanisms can be determined from the thermodynamic functions: free energy (ΔG°), enthalpy (ΔH°) and entropy (ΔS°). The equilibrium constant (K) is calculated by Khan and Singh
45
by plotting ln(qe/Ce) as a function of qe and extrapolating to zero.The thermal effect on the adsorption of ACS has been studied between 293 and 313 K. The adsorption of MB involves a variation of the free energy ΔG° (kJ/mol) between the initial and final states which predicts the feasibility of the reaction:
ΔG° is composed of the enthalpy term (ΔH°) which corresponds to the energies of interactions molecules/adsorbent, and entropic term (ΔS°) which expresses the modification and arrangement of the molecules in the liquid phase and on the surface. The functions ∆G°, ∆H°, and ∆S° are obtained from the formula:
K0 is the apparent equilibrium constant; ∆H° and ∆S° are deduced from the intercept and slope of the line lnK0 vs1/T.
The equilibrium constant (Ks) was calculated:
The constant K0 is determined from intercept, by plotting ln(qe/Ce) vs Ce and extrapolating to Ce = 0. The plot of LnK vs 1/T (Figure 11) is linear; the values of ΔHo and ΔSo are deduced from obtained from the graph (Equation (16)), the free enthalpy ΔGo at various temperatures are given in Table 4. Linear form of LnKd as a function of 1/T for MB adsorption onto ACS. (Adsorbent dose: 8 g/L, Co: 10 mg/L, Particle size: 0.2 mm, Agitation speed: 200 r/min, time: 60 min, and T: (25-60°C)). Determination of Thermodynamic Parameters (Adsorbent Dose: 8 g/L, Particle Size: 0.2 mm, pH: 6, Agitation Speed: 200 r/min, Time: 60 min, and T: (25 -60°C)).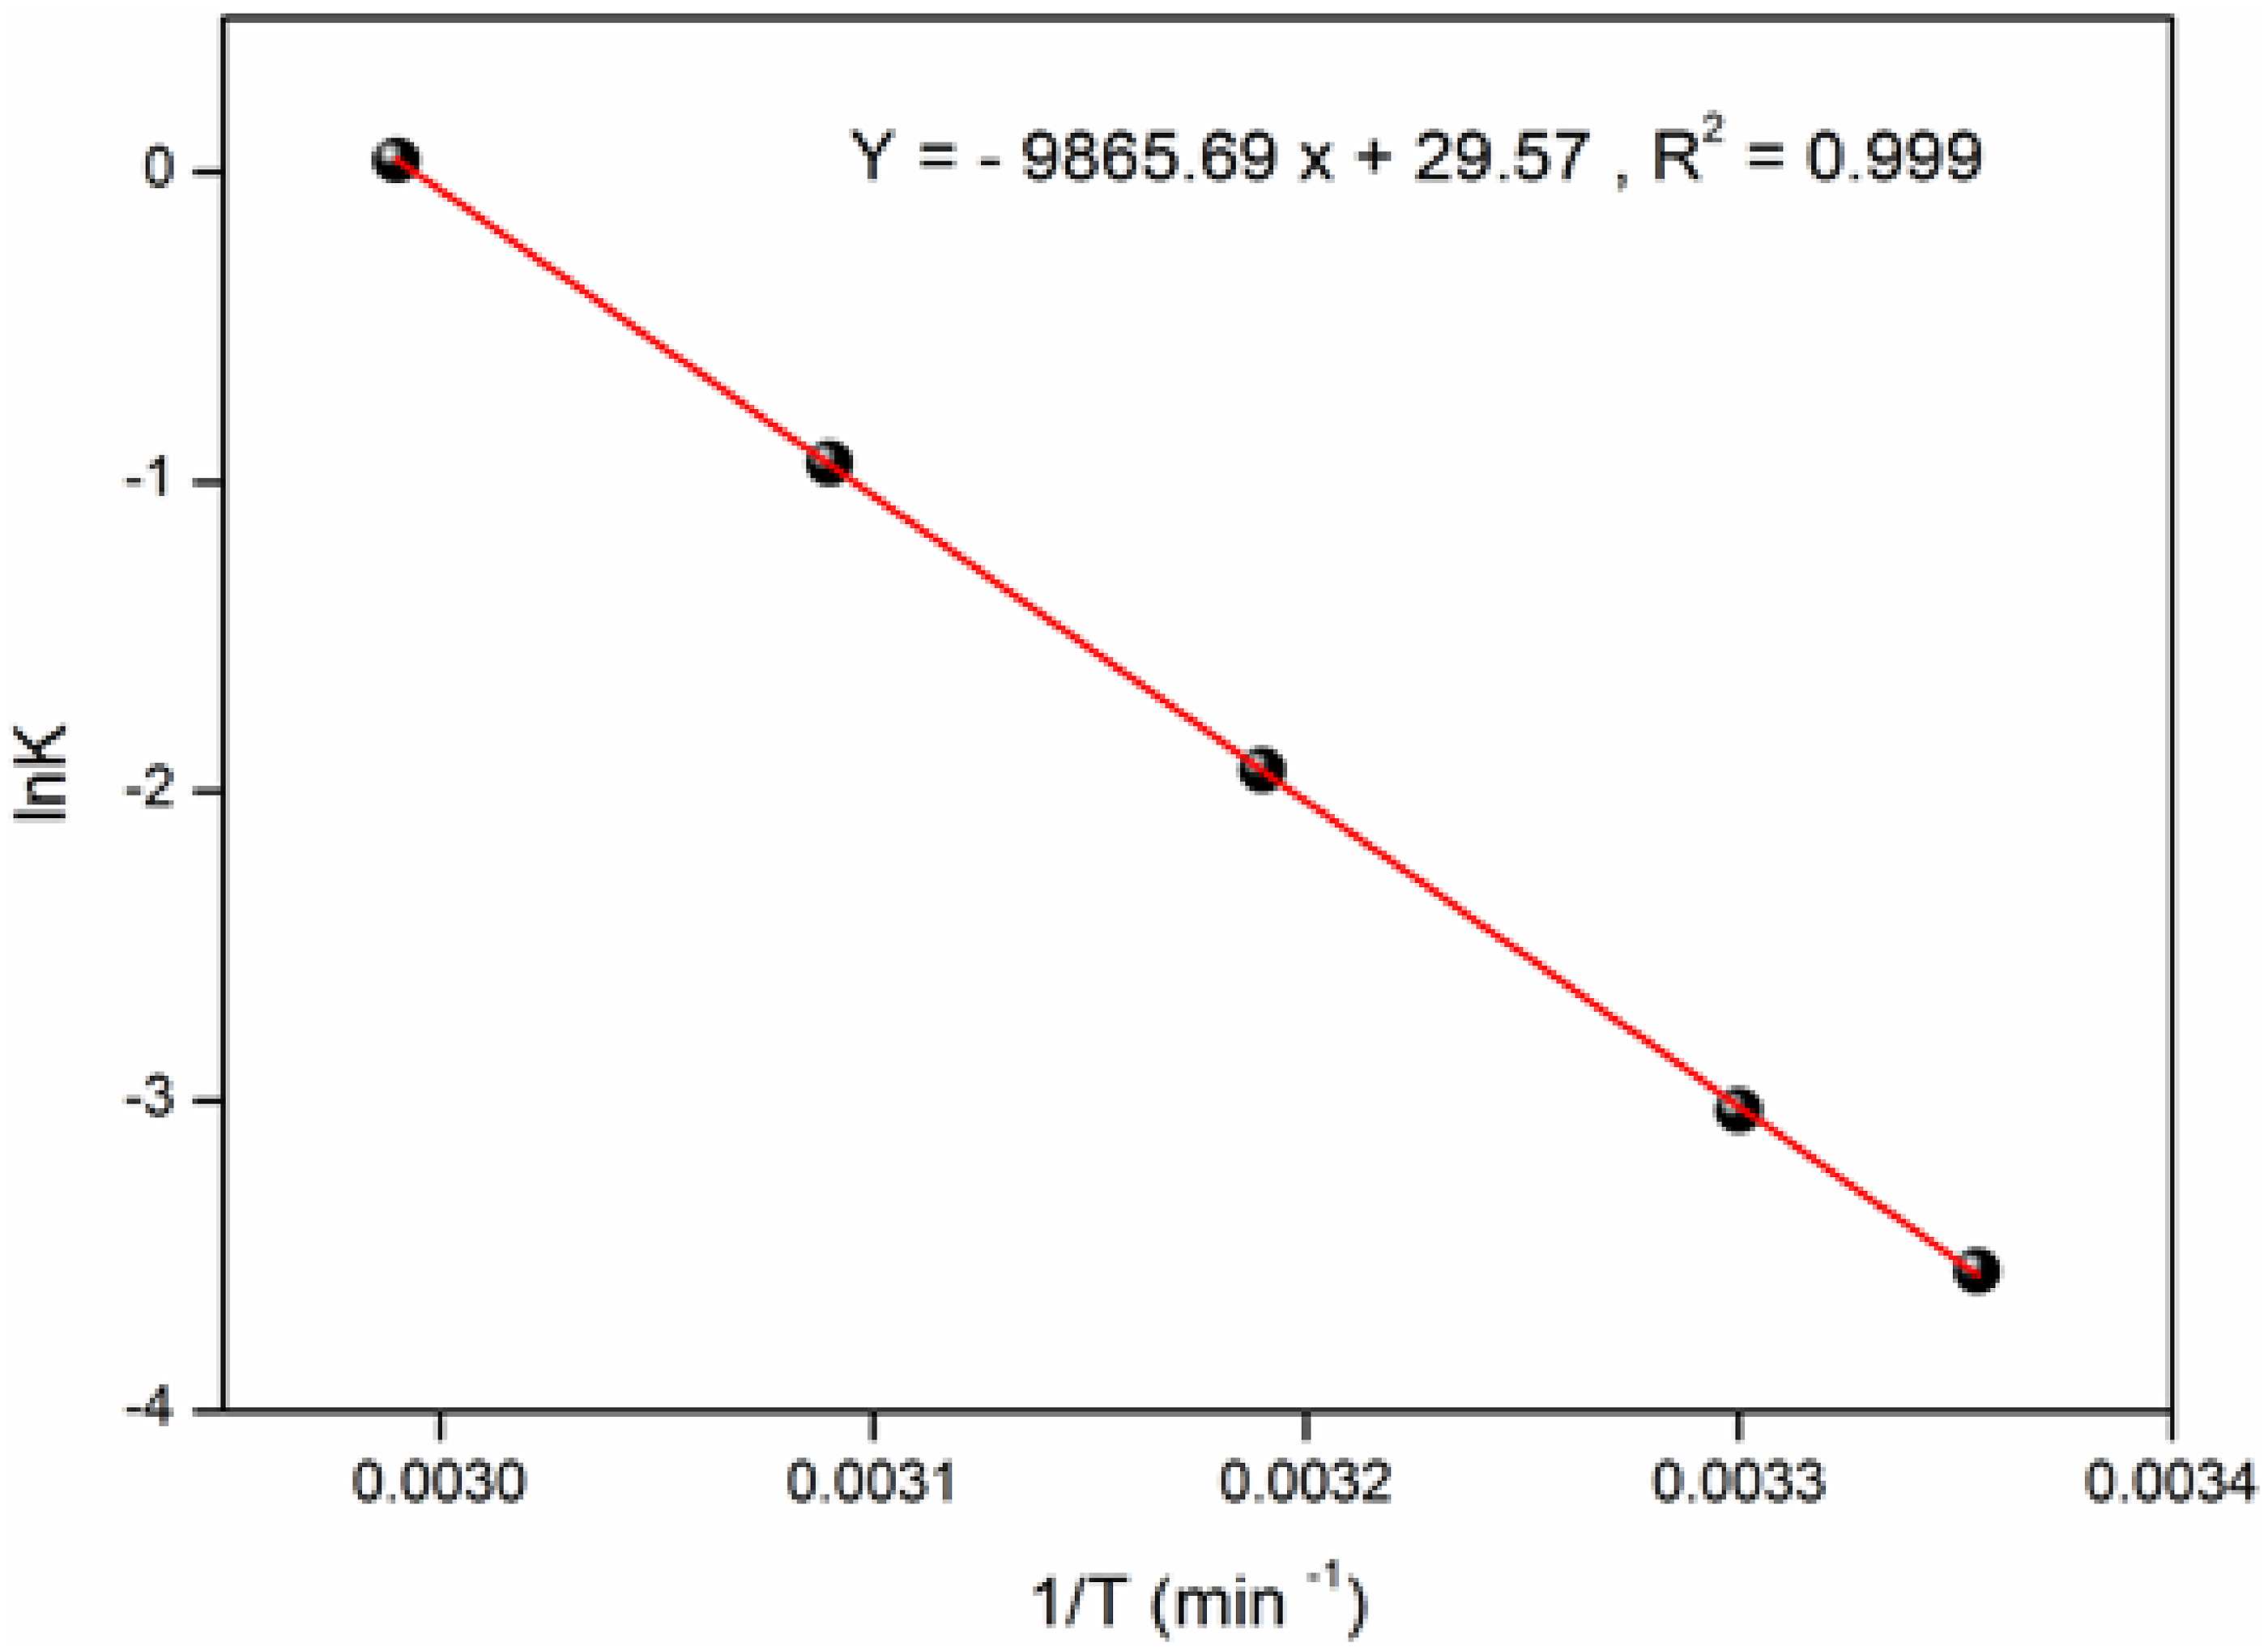

Note that the adsorbed MB amount with augmenting the temperature; this indicates that the adsorption is endothermic in nature (chemisorption). 46 The positive ΔGo (9.072 kj/mol at 298 K to 0.196 kj/mol at 334 K) value indicates a not spontaneous processwhile the positive ΔH° (82 kj/mol) show that the MB adsorption on the ACS is endothermic, The entropy ΔSo (245.689 J/K.mol) with an increased randomness at the solid solution interface. As the adsorption time increases, the MB moves from a nearly ordered state to an disordered state within the solution, resulting in an increased rate of diffusion and removal.
Performance and Regeneration of the Adsorbent
Comparative Study of the Maximum adsorption Capacity of MB Compared to the Bibliography.

The reusability of the adsorbent for further studies is important because it promotes cost-effectiveness and and environmental friendliness. 57 It is essential to assess its ability to recover its initial efficiency after repeated cycles to extend its applicability on a large scale. 58 Regeneration avoids the use of new adsorbents, facilitates resource recovery and reduces both secondary waste generation and operational costs. The use of acidic solvents has been shown to be an effective desorption technique.59,60
The choice of the solvent is essential for the recovery of adsorbates for further adsorptions and electrochemical, microbiological, thermal and chemical methods exist for this purpose. We opted for the chemical route because of its low cost where the regeneration of adsorbents for other cycles is economically important. The desorption of MB from ACS was evaluated using three solvents: H2O, NaOH and HCl. The highest desorption was obtained in HCl solution (4 M) with a rate of 98.56% against 78.24% (NaOH) and 45.23% (H2O). ACS was tested on 4 cycles (R1 = 98.56%, R2 = 75.26%, R3 = 53.25% and R4 = 38%) (Figure 12). However, a gradual decrease in adsorption is observed from cycle 1 to cycle 4, attributed to the alteration of the surface structure of the adsorbent, thus leading to the blocking of several adsorption sites. Regeneration of the adsorbent (Adsorbent dose: 8 g/L, Co: 10 mg/L, Particle size: 0.2 mm, Agitation speed: 200 r/min, time: 60 min, and T: 25°C).
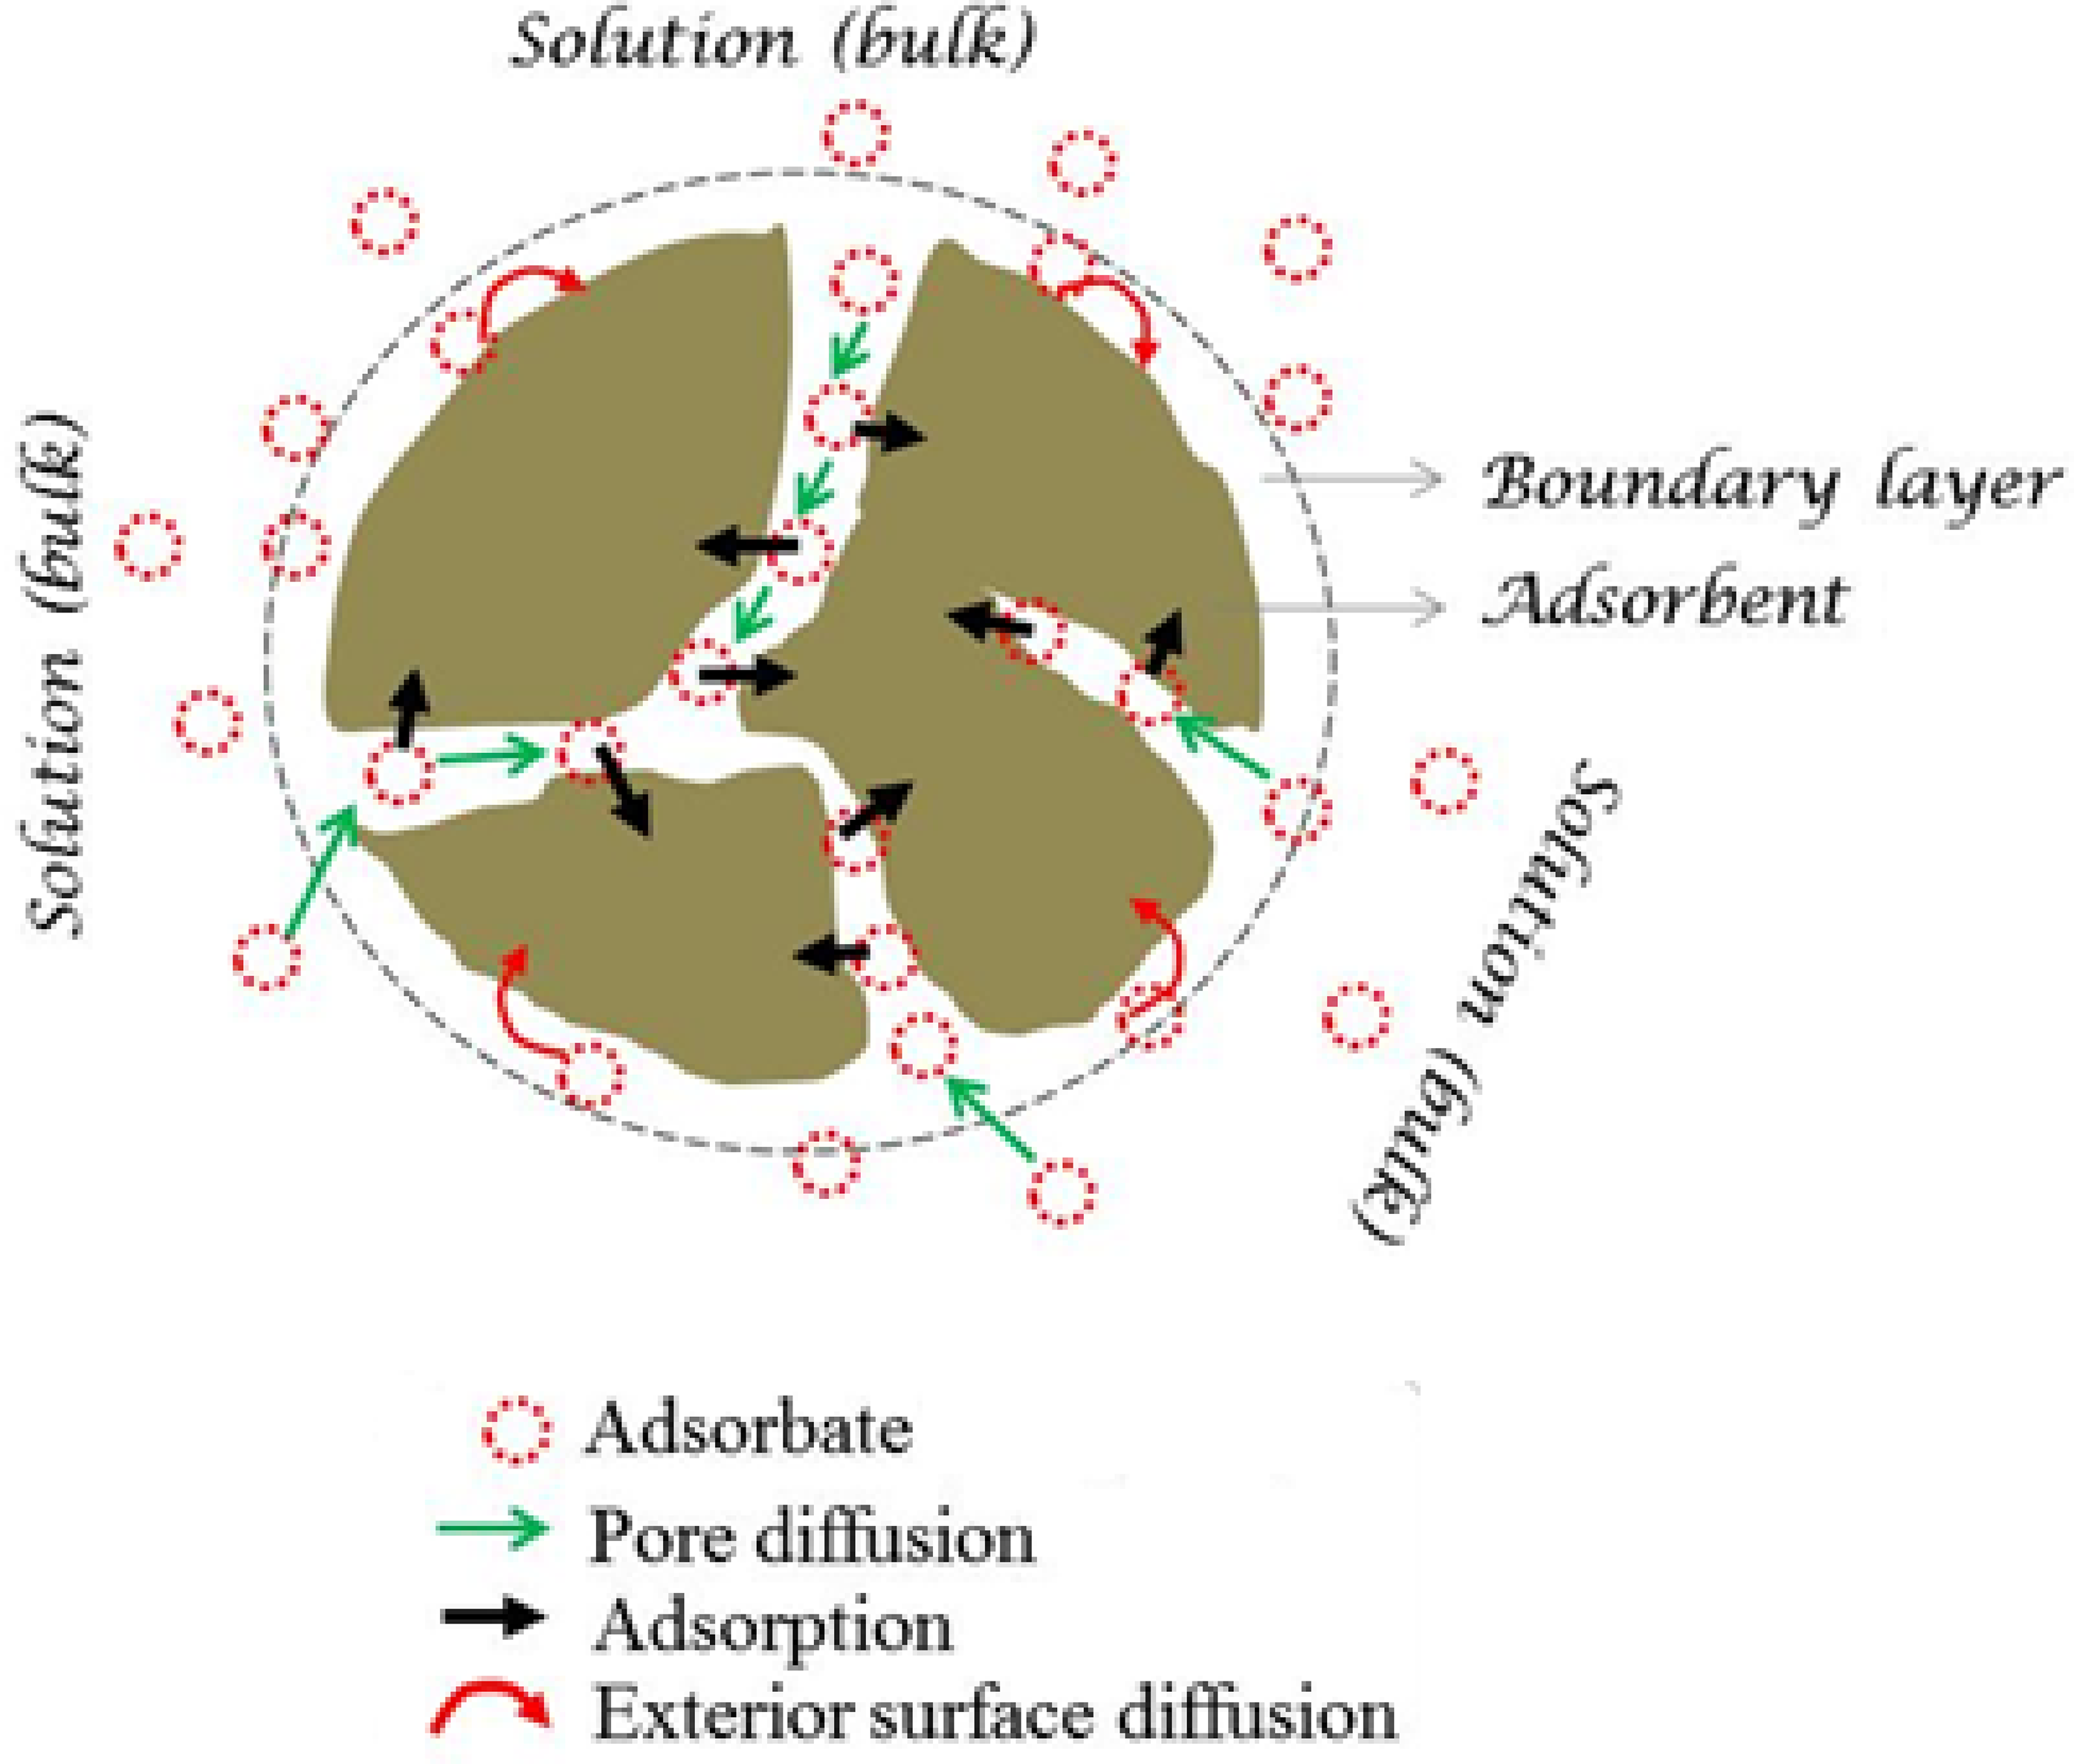
Adsorption Mechanism
As previously mentioned, the intraparticule diffusion is not the only factor limiting the MB adsorption onto ACS and other mechanisms can be involved simultaneously in the adsorption process of this system. In order to confirm the functional groups involved in the mechanism adsorption of MB, we compared the FTIR spectra of the activated carbon before and after the MB adsorption (Figure 1). The mechanism followed in the removal of MB on ACS is shown in Figure 13. It includes Adsorption mechanism.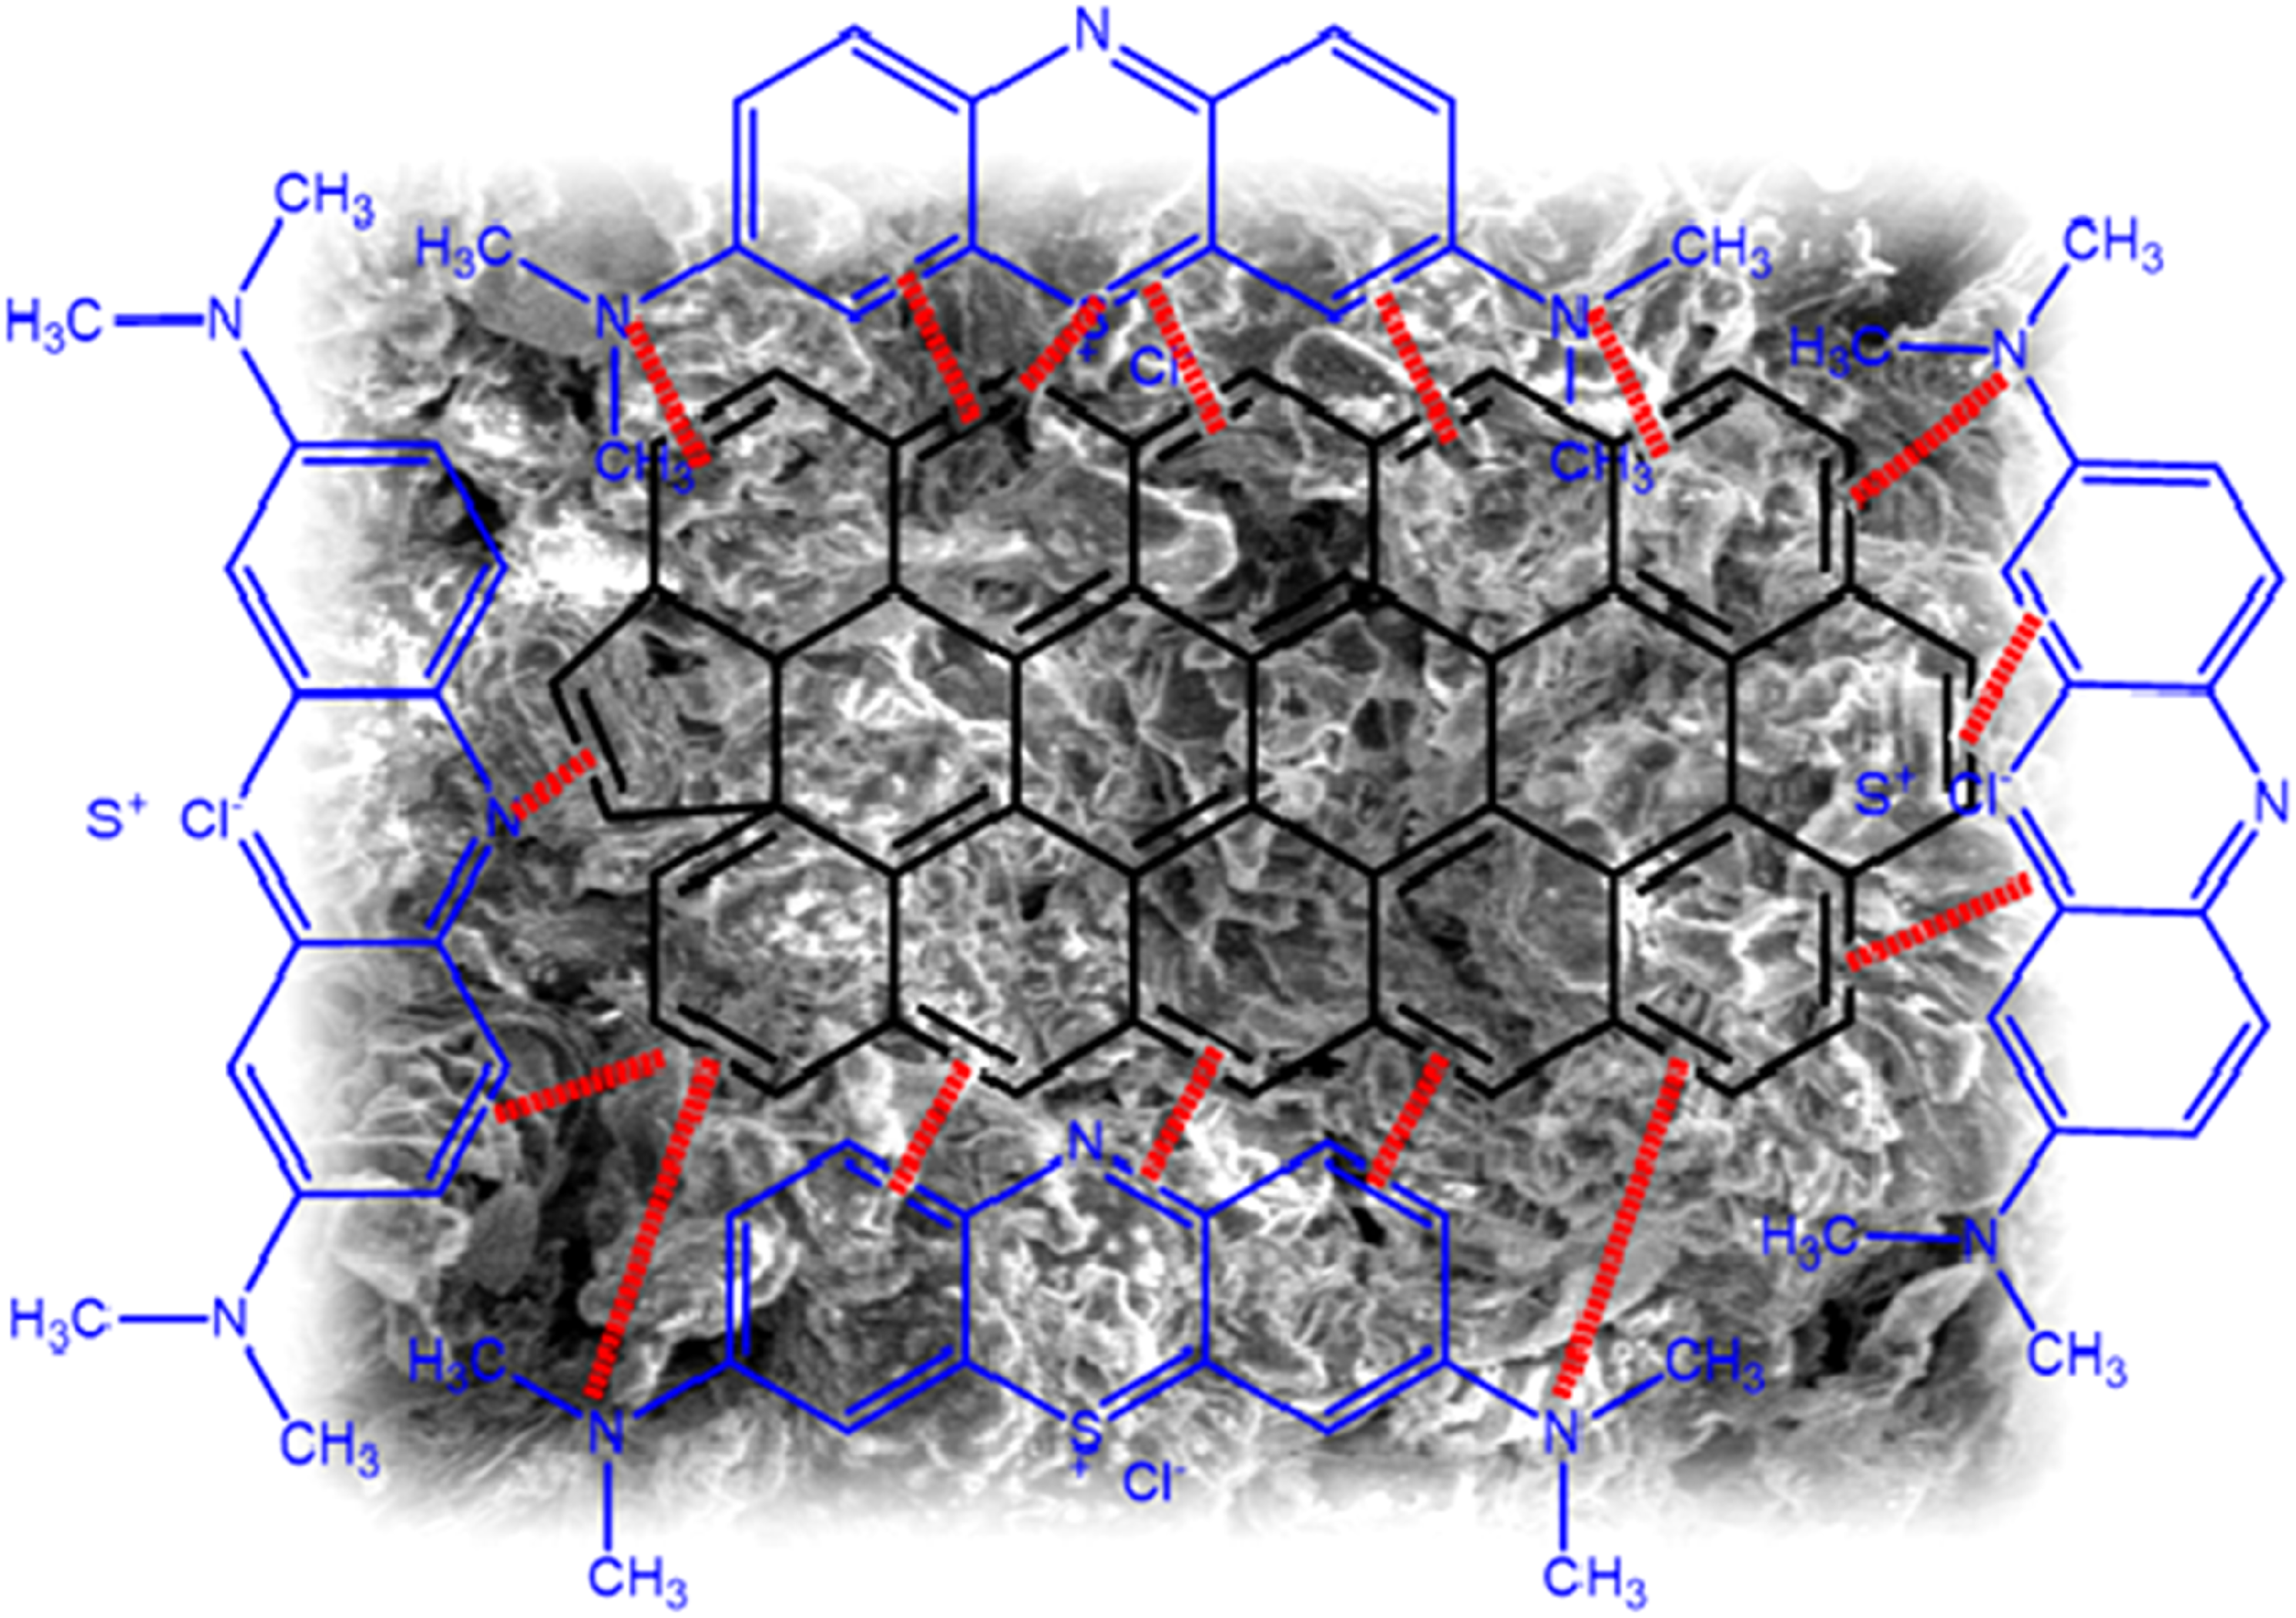
Examination of the IR spectra after adsorption confirms the fixation of MB on the surface of ACS. Indeed, we note the appearance of three bands assigned to the O–H, C = C and C–O groups where the increase in their intensity confirms the MB adsorption. The position of these bands is shifted, reflecting the existence of notable interactions between the MB molecules and the active sites of the carbon (Figure 13). The shift of the O–H band confirms the formation of a hydrogen bond between MB and ACS. A hydrogen bond has occurred between the H- donor atoms and the acceptor groups on the surface of ACS.
The characteristic band of the aromatic group C = C is shifted, reflecting the presence of hydrophobic interactions of
Conclusion
The current study showed that ACS can be effectively used as a raw material for the preparation of activated carbon for MB dye removal. The Langmuir model provided a better fit to the equilibrium adsorption data with a maximum capacity of 30.30 mg/g at 25°C. The adsorption follows a pseudo-second-order kinetic model, where the chemisorption is the rate-limiting step. MB molecules are attached to the adsorbent surface by forming a chemical bond and tend to find sites that maximize their coordination number with the surface.
The kinetic and thermodynamic data were explored in detail for the design of real effluent treatment. The positive free enthalpy ΔG° and positive enthalpy ΔH° showed that the adsorption of MB on ACS is endothermic and non-spontaneous over the temperature range studied. The positive entropy ΔS° indicates a random character increases at the solid-solution interface during adsorption where a structural exchange can occur between the active sites of the adsorbent and the ions.
For a comparative study, it was instructive to give the adsorption capacity with the literature. We found that the uptake capacity of MB observed in the present work is well positioned compared to other adsorbents. The reusability of the adsorbent for further studies is a key consideration as it promotes cost-effectiveness and environmental friendliness.
This mini-batch study has yielded encouraging results, and we aim to perform the adsorption in column mode under the conditions applicable to effluent treatment at semi-pilot scale and the present study has shown that ACS is a potentially attractive adsorbent. The removal of MB in column mode and the degradation of the dye by heterogeneous photocatalysis will be our next step.
Footnotes
Author Contributions
Pr. Moussa ABBAS conceived and designed the study, performed the experiments and analyzed the data. And Pr. Mohamed Trari revise and correction of the manuscript. All authors reviewed and approved the final version of the manuscript.
Declaration of Conflicting Interests
The author(s) declared no potential conflicts of interest with respect to the research, authorship, and/or publication of this article.
Funding
The author(s) disclosed receipt of the following financial support for the research, authorship, and/or publication of this article: This work was supported by the laboratory of Applied Chemistry and Materials (LabCAM), University of M’hamed Bougara of Boumerdes, Avenue de l'Indépendance Boumerdes, 35000, Algeria.
CRediT Authorship Contribution Statement
Data availability statement
All data presented in this study are included in the manuscript by the corresponding author.