
Abstract
Nanoparticles have shown promising potential for efficient drug delivery, circumventing biological interferences like immunological and renal clearance and mechanical and enzymatic destruction. However, a handful of research papers have questioned the biomedical use of metal-based nanoparticles like cadmium telluride quantum dots (CdTe-QDs) for their cytotoxic, genotoxic, and carcinogenic potential. Herein, we examined the effects of CdTe-QD NPs on gene expression profile of hepatocellular carcinoma (Huh-7) cell line. Huh-7 cells were treated with CdTe-QD NPs (10 μg/ml for 6, 12, and 24 hours, and 25 μg/ml for 6 and 12 hours), and transcriptomic analysis was performed using microarray to evaluate the global gene expression profile. Differential expressed genes (DEGs) were observed for both the doses (10 and 25 μg/ml) of CdTe-QD NPs at different time points. Gene ontology (GO) analysis revealed that genes involved in molecular function of cell cycle, organizational injury and abnormalities, cell death and survival, gene expression, cancer, organismal survival, and cellular development were differentially expressed. Overall, we have demonstrated differential expression of several genes, involved in maintaining cell survival, metabolism, and genome integrity. These findings were confirmed by RT-qPCR study for some canonical pathway genes signifying possible implication in NP toxicity-mediated cell survival and inhibition of cell death.
Introduction
Efficient delivery of drugs to diseased cells has promising potentials in improving and sustaining recovery to health from diseased conditions. However, biological hindrances such as immunological and renal clearance, mechanical and enzymatic destruction of potential drugs, cell membrane prevention of drug intracellular translocation, lysosomal degradation, and extracellular matrix (ECM) components are all factors impeding drug efficacy in pathological milieu. Nanoparticle-assisted drug vehicular systems have successfully withstood the pharmacokinetic challenges accompanying typical drug delivery systems and possible biological barriers.1-3 Nanoparticles (NPs) are small molecules ranging from 1 nm to 500 nm in size and capable of carrying drugs and several other smaller molecules within biological environment. 4 Precisely, by binding to specific intracellular and extracellular structures, NPs foster cell-targeted drug therapy. Perhaps, such a drug transport system enhances the accumulation of drug particles at the targeted site, thereby minimizing the supposed toxic effects to other non-target cells. Furthermore, NPs prevent premature metabolic destruction of drug, facilitate effective drug delivery, extend drug release by maintaining bioavailability and adjust pharmacological properties of the delivered drug. 5 These characteristic features of NPs render them superior over other conventional therapeutic options.6,7 Hitherto, there are a cocktail of NPs that have been devised for therapy of cancer, diabetes mellitus (DM), infectious diseases, allergy, and neurological disorders. 3
The development of the quantum dots (QDs), besides other NPs, holds great promise in the field of nanotechnology owing to its autofluorescence properties that permits them high potency for medical diagnosis, imaging, and drug delivery. QD NPs are engineered fluorescent nanocrystals semiconductor that varies from 2 nm to 100 nm in diameter with specialized optical and chemical characteristics. 8 Metal-harboring QDs such as cadmium telluride QDs (CdTe-QDs) are the most commonly used QDs. 9 Ideally, QDs are not lethal to cells when covered with outer capping; however, their shell may be damaged in circumstances of prolonged cellular stay, resulting in “uncovered” QDs. A handful of research studies have demonstrated the deleterious effects of CdTe-QD NPs in numerous cell types including hepatocellular carcinoma (HepG2) cells, bronchial epithelial cells and breast carcinoma cells.10-15 It has been suggested that CdTe-QD NPs causes cytotoxicity and genotoxicity by generating reactive oxygen species (ROS), altering cellular antioxidants, impairing mitochondrial function, inducing cellular apoptosis and global gene hypoacetylation.10,12,14,16 Interestingly, CdTe-QD NPs have been shown to be potential human lung carcinogen. Chronic exposure to CdTe-QD NPs has been observed to transform normal bronchial epithelial cells into cancer cells, as demonstrated by independent growth and increased cell migration in vitro.13,17 Thus far, the role of NPs in promoting hepatocarcinogenesis is not established in scientific literature. Furthermore, the liver is a major organ involved in the metabolism and clearance of foreign substances, including nanoparticles. As hepatocytes, Huh-7 cells are commonly used as a model for studying liver functions, drug metabolism, and hepatotoxicity. Investigating the interaction of CdTe-QDs with Huh-7 cells can provide valuable insights into their potential impact on liver cells and help evaluate their safety in the context of liver-related applications.
Because cellular processes resulting in pathological conditions are fundamentally initiated through alterations in expression pattern of specific genes, analyzing the gene expression of implicated pathways for a pathological condition is one way of investigating the etiology of such disease conditions. The objective of this study is to investigate the effects of CdTe-QD NPs on gene expression profile of Huh-7 hepatocellular carcinoma cell line to unravel the pathological implication of the nanoparticle regarding cancer progression or tumorigenesis especially on liver cell which plays central role on the metabolism of pharmaceutical compounds or compounds with pharmacologic properties.
Materials and Methods
Characterization of CdTe-QDs
CdTe-QDs used in this study were obtained from Nano Impex (Mississauga, Ontario, Canada). CdTe-QDs nanocrystals characterization has been previously reported. 18 Prior to use, the nanocrystals were suspended in culture medium to a final a concentration of 1 mg/mL and then sonicated at 40 W for 15 minutes with Branson sonifier (Branson Ultrasonics, Danbury, CT, USA).
Cell Culture
Huh-7 cancer cell line used in this study were grown in Dulbecco’s modified Eagle’s medium (DMEM) (Gibco-BRL, Grand Island, NY, USA) which was supplemented with antibiotics (100 IU/mL penicillin, 100 μg/mL streptomycin) and 10% fetal bovine serum (FBS) (HyClone Laboratories, Logan, UT). The cells were incubated at 37°C and 5% v/v CO2 until they were 80% confluent was achieved.
Cells Exposure to CdTe-QDs
Huh-7 cells were exposed to varying concentrations of CdTe-QDs at different time points. First, the cells (1 × 10⁵ cells/well) were seeded into 24-well plates and incubated until the optimal confluence was reached. After washing with phosphate buffered saline (PBS) (Fisher BioReagents), the cells were then placed in a fresh growth media containing either 10 μg/mL or 25 μg/mL of CdTe-QDs and further incubated for 6 h, 12 h, and 24 h for each concentration based on previously published toxicity data. 19
Microarray Gene Expression Analysis
Total RNA from treated Huh-7 cells was extracted using QIAamp RNA Blood Mini Kit (Qiagen, Hilden, Germany) following the manufacturer’s instructions. RNA integrity was evaluated by Agilent Bioanalyzer 2100 system (Agilent Technologies, Santa Clara, CA, USA). For microarray analysis, cDNA synthesis of total RNA was first performed using a High-Capacity cDNA Reverse Transcription Kit (Applied Biosystems, Foster City, CA, USA). The obtained cDNA was then used for global gene transcription analyses, using GeneChip (Affymetrix, Santa Clara, CA, USA) following the manufacturer instructions. For analysis of global gene expression profile, fluorescent oligonucleotide probes were hybridized to the GeneChips® Human Genome HG-U133 Array in a GeneChip® hybridization oven, following manufacturer’s instructions. The microarray contained nearly 55000 probes which represents over 39000 transcripts from 33000 predetermined human genes. Washing and staining after hybridization was performed with a GeneChip® Fluidics Station 400 (Affymetrix). Findings were then visualized in a Gene Array scanner (Affymetrix). GeneChip® Operating Software was utilized for image quantitation.
GC Robust Multi-array Average (GC-RMA) algorithm was used for data normalization significance of genes that were differentially regulated for different doses (10 μg and 25 μg) at the three time points (6 h, 12 h, and 24 h) were determined by two-way analysis of variance (ANOVA) including dosage, time, and their interactions in the statistical model. Adjusted P value < 0.05 of false discovery rate (FDR) for genes and the absolute fold changes (FC) > 1.5 in treated cells in comparison with the control cells were considered significant. Statistical analysis was conducted with the PARTEK Genomics Suite (Partek Inc., St Lois, MO, USA).
Quantitative RT-PCR (qRT-PCR) Validation of Microarray Gene Expression
Assay Kit Identification Number of Validated Genes.

The cycling parameters were as follows:
5 minutes at 95°C and 40 cycles of 30 s at 95°C and 45 s at 60°C. The fold-changes of RNA transcripts were calculated by the 2−ΔΔCt method. The expression levels of mRNA of studied genes were then normalized to GAPDH. The data for gene expression were then presented as mean ± standard deviation (SD) change relative to the untreated cells.
Data Analyses: Functional Pathway, Upstream Regulator, and Network Analysis
Functional, pathway and gene ontology (GO) enrichment analysis was performed using the Database for Annotation, Visualization and Integrated Discovery (DAVID), Protein Analysis Through Evolutionary Relationships (PANTHER™) classification systems, and Ingenuity Pathways Analysis (IPA) (QIAGEN Inc., https://www.qiagenbioinformatics.com/products/ingenuity-pathway-analysis). Canonical pathways and gene network analysis were also performed using IPA. The lists of DEGs for each concentration and different time points were mapped to the corresponding gene object in the Ingenuity Pathway Knowledge Base and protein-protein interaction networks. P-value to determine the probability of a biological pathway was computed by right-tailed Fisher’s exact test and used to assign if the data set can be explained by chance alone based on the functional/pathway annotations stored in the Ingenuity Knowledge Base. All statistical tests were two-sided and a P-value < 0.05 was considered statistically significant.
Results
Exposure to CdTe-QD NPs and Global Gene Expression Profile in Huh-7 Cell Line
Huh-7 cell line was treated with 10 μg of CdTe-QD NPs for time points 6, 12, and 24 h, and 25 μg of the QD was used for time points 6 and 12 h prior to transcriptomic analysis, which was performed using microarray to evaluate the global gene expression profile.
Venn Diagram Analysis of Differentially Expressed Genes
The number of transcripts that resulted in greater than 1.5-fold change in gene expression microarray analysis is depicted in the Venn diagram (Figure 1A and 1B). The transcriptomic microarray results showed that 14877 genes were differentially expressed genes (DEGs) upon exposure to 10 μg and 25 μg of CdTe-QD NPs. Of these, 9347 and 5530 DEGs were identified in response to 10 μg and 25 μg CdTe-QD NPs exposure groups, respectively. Our results indicated that the expression of 2384 DEGs at 6 h, 4848 DEGs at 12 h and 6484 DEGs at 24 h were influenced by 10 μg of CdTe-QD NPs (Figure 1A). Interestingly, 586 DEGs were identified across all time points. Similarly, 3191 and 4106 genes were differentially expressed after exposure of the cells to 25 μg of CdTe-QD NPs exposure at 6 and 12 h, respectively (Figure 1B). Of these, 1767 genes were common to both time points. (A) Venn diagrams representing the differentially expressed genes specific or common among different time points in 10 μg. (B) Venn diagrams representing the differentially expressed genes specific or common among different time points in 25 μg.
Also, our results suggested that the exposure to low (10 μg) dose of CdTe-QD NPs at 6, 12, and 24 h resulted in higher number of DEGs (9347) compared to the high (25 μg) dose at 6 and 12 h (5530), which may be indicative of genotoxicity of the low dose CdTe-QD NPs compared to the high dose CdTe-QD NPs. This might be because the nanoparticle exhibits a biphasic response curve where at low concentrations, and the QDs may be interacting with specific receptors or target sites in a different manner compared to higher concentrations, leading to the observed effects. In addition, it can be clearly appreciated that at similar dose concentrations of 10 μg, CdTe-QD NPs induced greater number of altered gene expression with progressive increase in time from 6 to 12 and 24 h. Furthermore, similar altered gene expression trend was also observed for exposure to 25 μg of CdTe-QD NPs.
Cluster Analysis of CdTe-QD NPs-Mediated DEGs
The hierarchical clustering analysis of DEGs showed several clusters of genes which are shown in the generated heat map diagram (Figures 2A and 2B). The hierarchical clusters of gene were further analyzed by identifying biological processes through gene ontology (GO). (A) Heat maps of union of DEGs in 10 μg. Hierarchical clustering clearly separated genes into several clusters. Also, the figures show the most associated GO biological processes for each cluster of genes. Red and green denote highly and weakly expressed genes, respectively. (B) Heat maps of union of DEGs in 25 μg. Hierarchical clustering clearly separated genes into several clusters. Also, the figures show the most associated GO biological processes for each cluster of genes. Red and green denote highly and weakly expressed genes, respectively.
Heat maps of DEGs showed that genes related to cellular processes such as metabolic process, organelle organization, DNA repair, chromatin organization, DNA replication, chromosome segregation, cellular amino acid catabolic process, meiosis, DNA metabolic process, cell cycle, asymmetric protein localization, and biosynthetic process and regulation of translation have high basal expression (represented as 0 μg at 0 h). Furthermore, there was low basal expression for genes involved in biosynthetic pathways, RNA splicing via transesterification reactions, apoptotic processes and cell death pathway, MAPK cascade, regulation of cell cycle, response to endogenous stimulus, cell proliferation, protein folding, regulation of vasoconstriction, and ion transport (Figures 2A, and 2B).
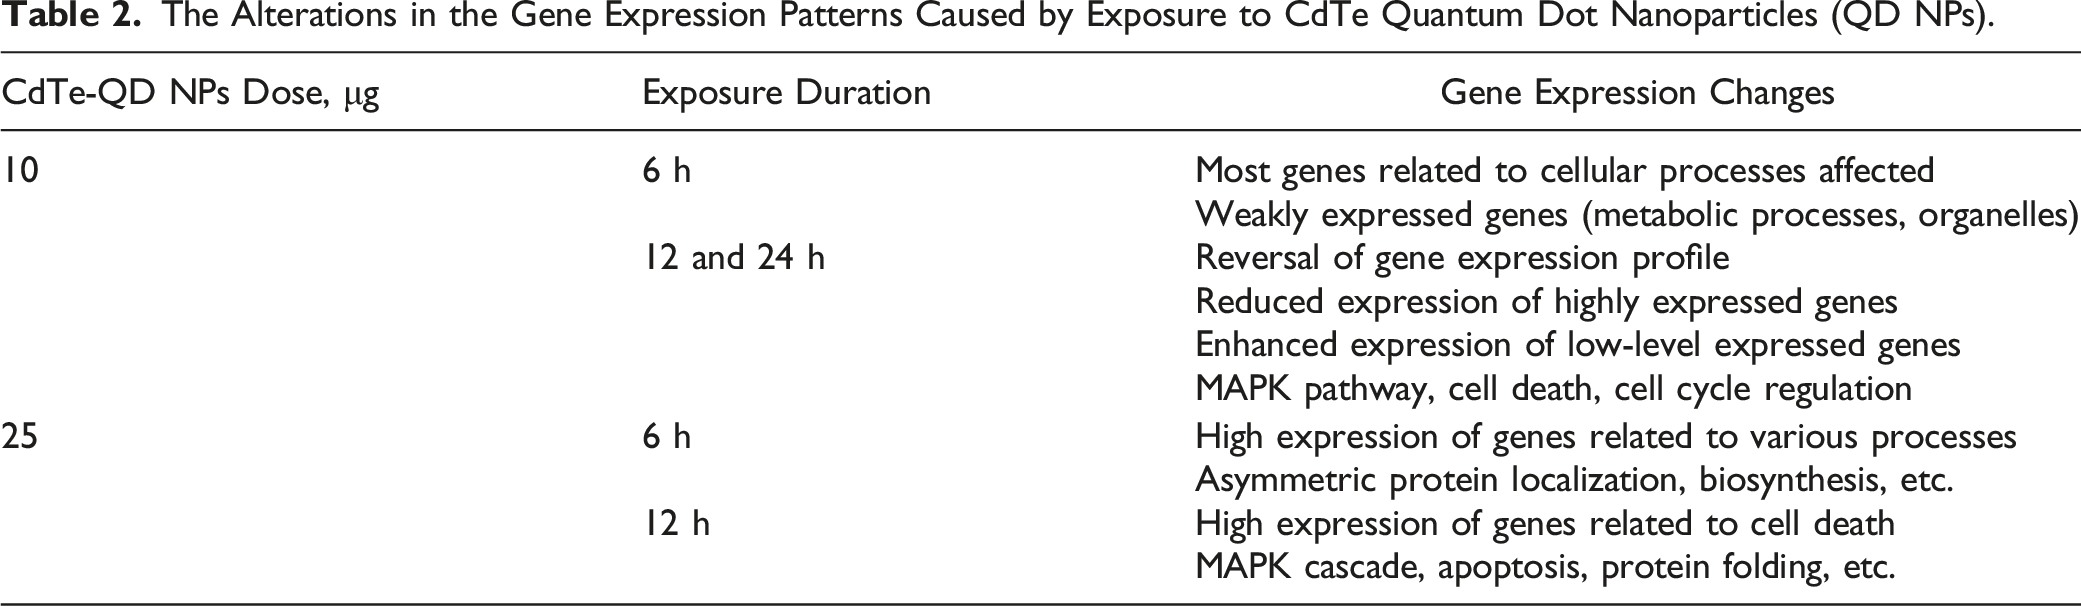
The Alterations in the Gene Expression Patterns Caused by Exposure to CdTe Quantum Dot Nanoparticles (QD NPs).
Gene Ontology Analysis of CdTe-QD NPs-Mediated DEGs
For GO biological terms, P < 0.05 was regarded as statistically significant. The Database for Annotation, Visualization and Integrated Discovery (DAVID) Functional Annotation Bioinformatics Microarray Analysis was used to generate P-value and only biological processes were included.
GO analysis revealed that the expression of genes involved in biological processes were significantly influenced upon exposure to 10 μg and 25 μg of CdTe-QD NPs at different time durations. For instance, genes involved in the cell cycle, organizational injury and abnormalities, cell death and survival, gene expression, cancer, organismal survival, and cellular development were differentially expressed (Figure 3A 10 μg at 6 h, Figure 3B 10 μg at 12 h and Figure 3C 10 μg at 24 h). Furthermore, genes in the cell cycle, cell death and survival pathways, cancer, and organizational injury and abnormalities were also differentially expressed for 25 μg exposure at 6 h and 12 h exposures (Figures 4A-4B). (A–C): Gene ontology of DEGs that are significant in 10 μg at 6 hours (A), 12 hours (B), and 24 hours (C). (A–B): Gene ontology of DEGs that are significant in 25 μg at 6 hours (A) and 12 hours (B).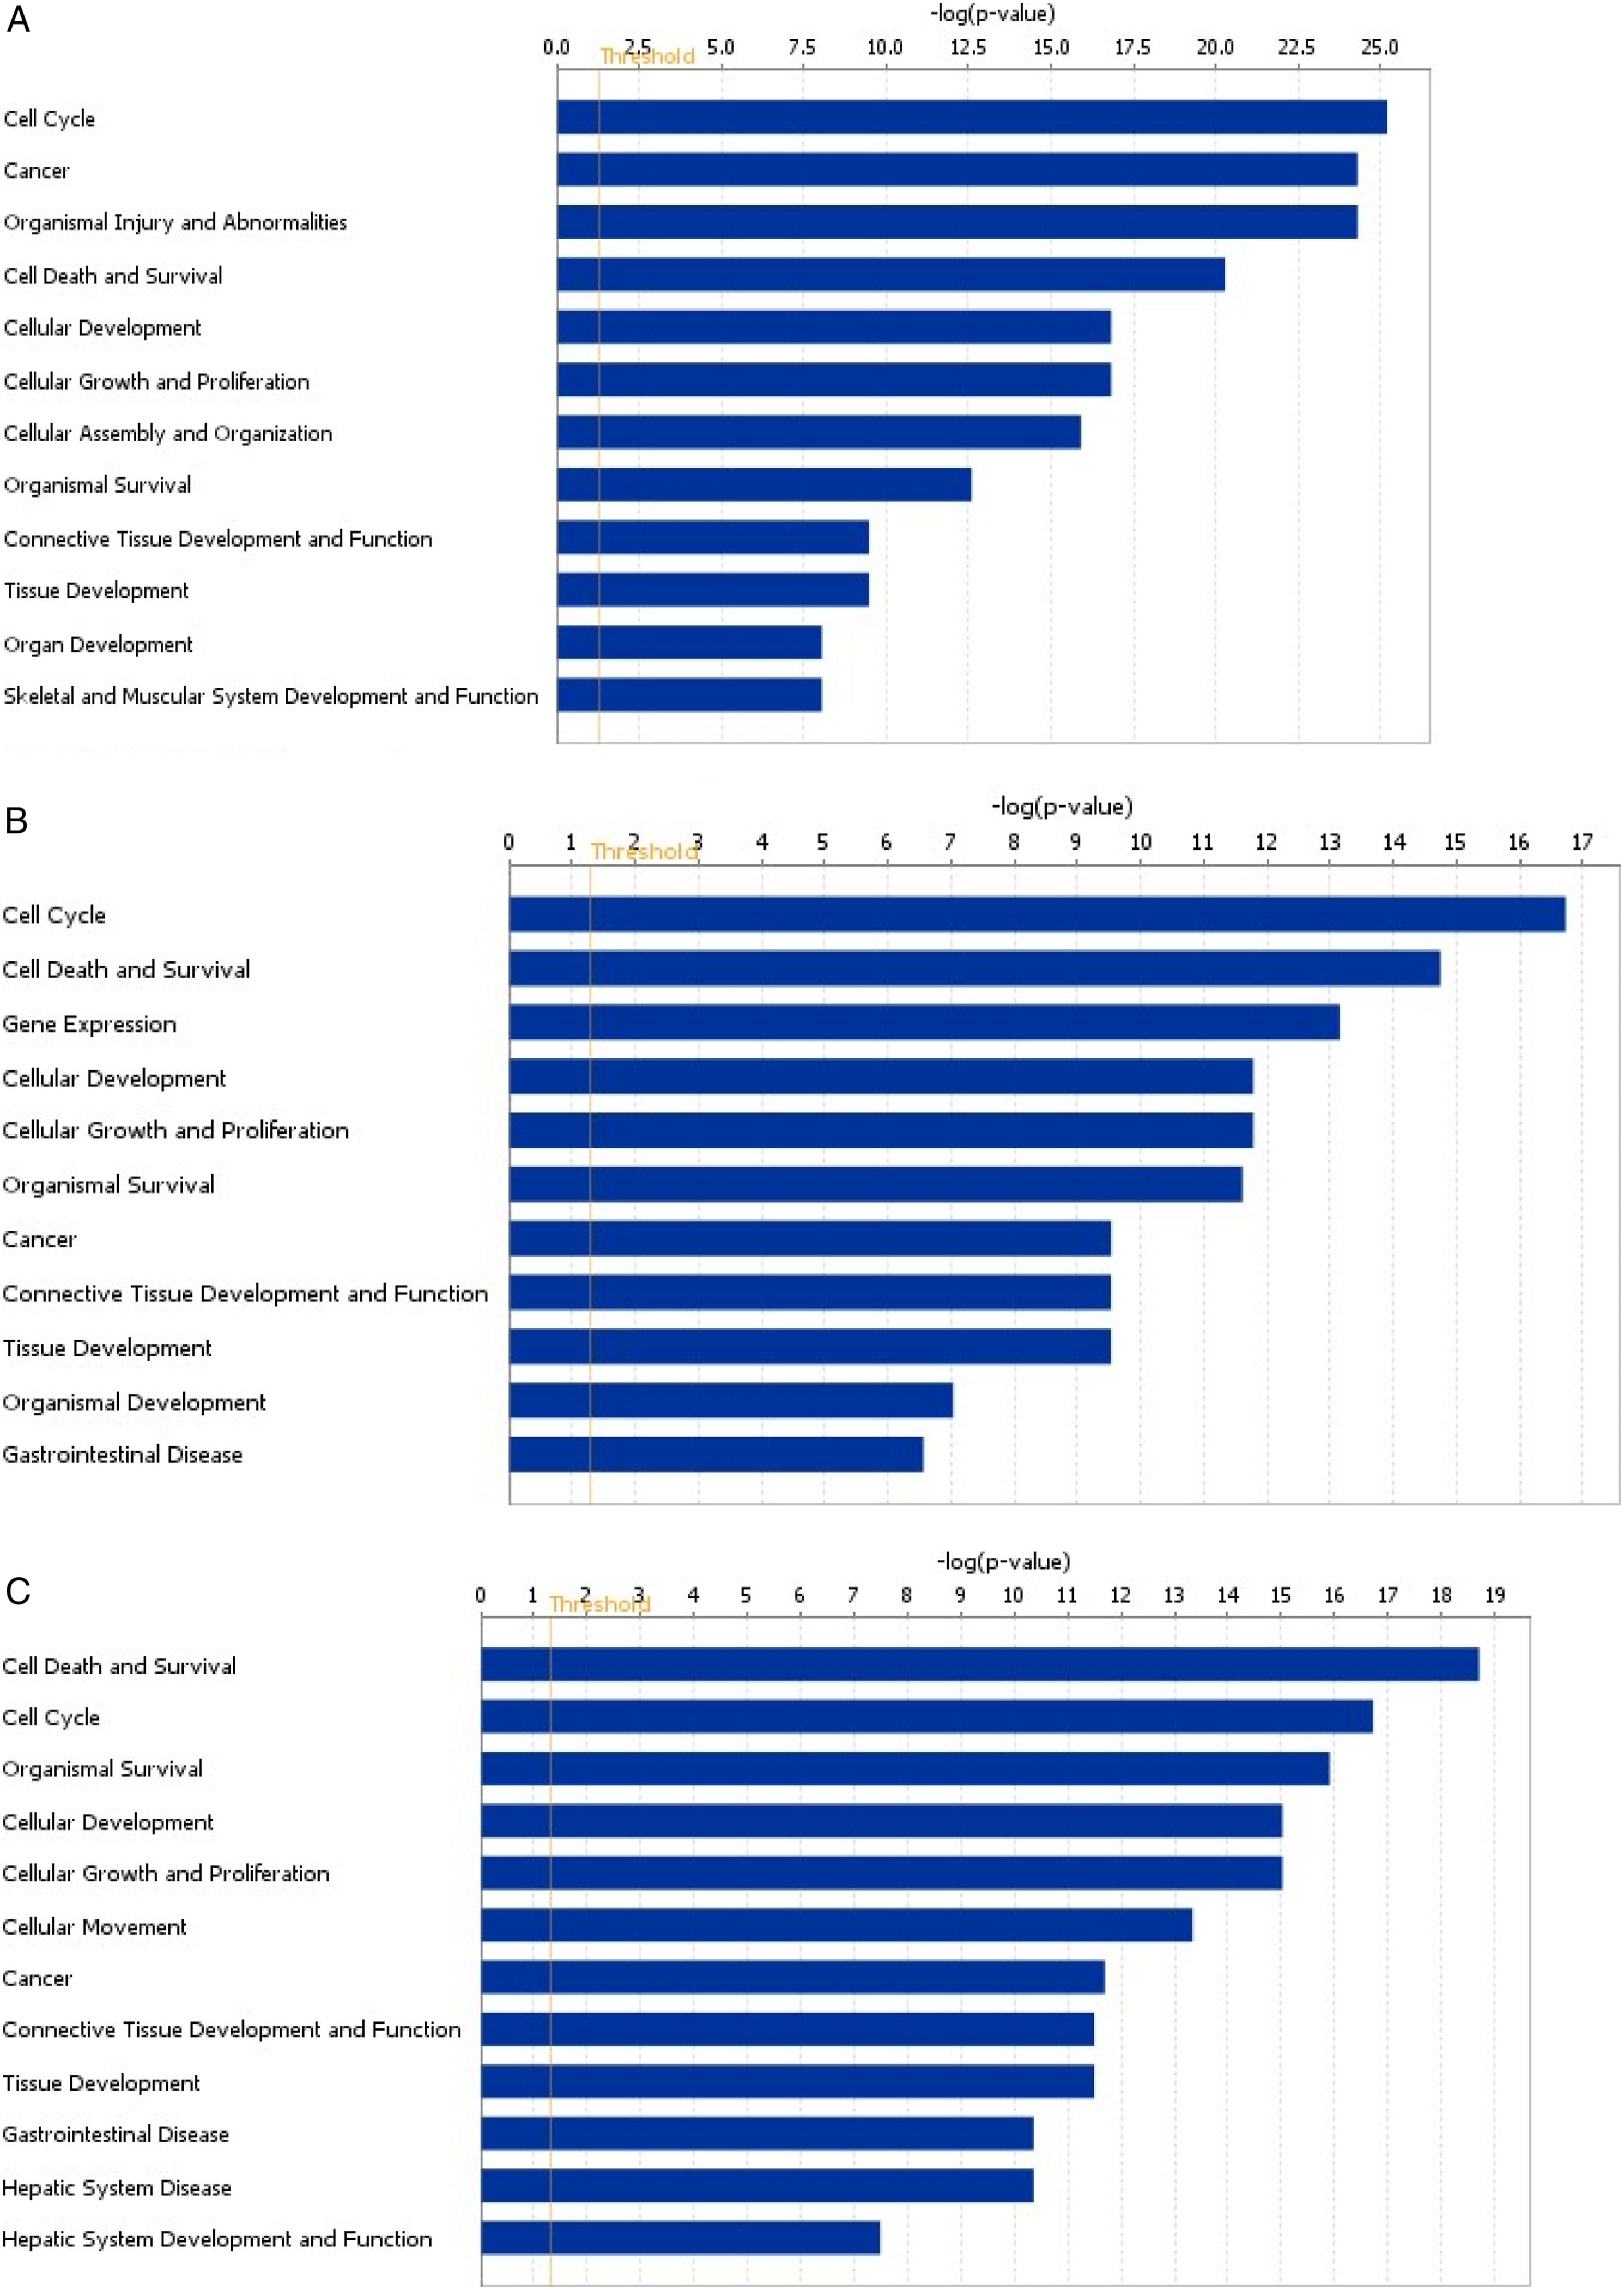

The Top 15 Associated Genes With 10 μg of CdTe-QD NPs When Exposed to Huh-7 for 6 h.

The Top 15 Associated Genes With 25 μg of CdTe-QD NPs When Exposed to Huh-7 for 6 h.

The Top 15 Associated Genes With 10 μg of CdTe-QD NPs When Exposed to Huh-7 for 12 h.

The Top 15 Associated Genes With 25 μg of CdTe-QD NPs When Exposed to Huh-7 for 12 h.

The Top 15 Associated Genes With 10 μg of CdTe-QD NPs When Exposed to Huh-7 for 24 h.

Canonical Pathways and Subnetwork Analysis of CdTe-QD NPs-Mediated DEGs
Since the GO analysis only analyzes the biological processes independently, we also undertook canonical pathway analysis using Ingenuity Pathway Analysis (IPA). Through canonical pathway analysis, several significant pathways were mapped at P < 0.05 some of which includes cell cycle control of chromosomal replication (regulates DNA replication once during each cell cycle), BRCA1 in DNA damage response pathway (a tumor suppressor gene and repairs damaged DNA), G2/M DNA damage checkpoint regulation (delays cell cycle progression during DNA damage post S-phase), CHK proteins in cell cycle checkpoint control (regulates DNA damage response, apoptosis, and cell death), ATM signaling (encodes protein that controls pace at which cells grow and also helps in DNA damage response, genome integrity, and apoptosis), mitotic roles of polo-like kinase (regulates cell cycle), NRF-2–mediated oxidative stress response (prevents cell from oxidative stress and induces pathways that leads to detoxification of endogenous and exogenous compounds), p53 signaling (suppresses uncontrolled cell proliferation), and GADD45 signaling (repairs DNA, controls cell cycle, senescence and genotoxic stress, suppresses tumor, and activates pro-apoptotic pathways) (Figures 5A-5E). (A–E): Canonical pathways of DEGs that are significant in 10 μg and 25 μg (A–D) at 6 hours and 12 hours, respectively. Also, in 10 μg at 24 hours (E). X-axis indicates the significance (–log10 (P-value)). The threshold line represents a P value of 0.05.
Interestingly, we found that the pathway regulating cell cycle control of chromosome replication was particularly enriched in both low (10 μg) and high (25 μg) dose CdTe-QD NPs at 6 h (Figures 5A and 5B). However, at a longer time point of to 12 h and same dose (10 μg and 25 μg), there was enrichment of NRF-2–mediated oxidative stress response pathway genes as well as BRCA-1 in DNA damage response pathway (Figures 5C and 5D).
The CdTe-QD NPs-regulated DEGs have been further narrowed down to specific molecular function through subnetwork analysis and their direct and indirect gene to gene interactions have been presented (Supplementary Figure A-E).
Validation Analysis of CdTe-QD NPs-Mediated DEGs Through Quantitative Real Time PCR
The validation analysis of 25 representative DEGs on transcriptomic microarray analysis was carried out through qRT-PCR (Figure 6). Among them, 12 genes including C-C motif chemokine ligand 26 (CCL26, encodes immune regulatory and inflammatory protein), coagulation factor II thrombin receptor like 2 (F2RL2, encodes protein for hemostasis and thrombosis), heme oxygenase 1 (HMOX1, encodes heme catabolism enzyme), heat shock protein family (hsp70) member A (HSPA6, encodes protein to maintain cellular homeostasis in stressful conditions), interleukin 11 (IL11, encodes cytokine that regulates immune system), lactate dehydrogenase B (LDHB, encodes for lactate dehydrogenase enzyme), metallothionein 1M (MT1M, encodes for metallothionein protein that protects against oxidative stress and metal toxicity), matrix metallopeptidase 1 (MMP1, encodes matrix metalloproteinases enzymes that performs physiological cleavage of extracellular matrix), neutrophil cytosolic factor 2 (NCF2, encodes a protein that is part of neutrophil NADPH oxidase complex), syntaxin 3 (STX3, encodes protein that assist protein trafficking), tumor suppressor candidate 3 (TUSC3, encodes protein that facilitates cellular magnesium uptake, protein glycosylation and embryonic development), and zinc finger protein 280A (ZNF280A, encodes protein that aids binding of DNA or RNA) were up regulated. In addition, 13 genes involved in cell division cycle associated 7 (CDCA7, encodes protein that helps in cell cycle), cyclin B1 (CCNB1, encodes protein for mitosis), arginase 1 (ARG1, encodes enzyme arginase), cyclin dependent kinase inhibitor 2C (CDKN2C, encodes protein that regulate cell growth and controls progression to cell cycle G1), colorectal cancer associated 2 (COLCA2), growth hormone regulated TBC protein 1 (GRTP1, encodes protein that act as GTPase activator), helicase, lymphoid specific (HELLS, encodes helicase protein involved in cellular proliferation), histone cluster 1 H4 family member h (HIST1H4H, encodes histone that forms nucleosome structure), Sp3 transcription factor (SP3, encodes protein that induces or suppresses transcription of genes), protein phosphatase 6 regulatory subunit 2 (PPP6R2, encodes protein essential for mitotic kinase), polo-like kinase 1 (PLK1, encodes protein for mitosis), transcription termination factor 2 (TTF2, encodes protein that assists in protein-DNA interaction and also involve in cell cycle), and protein kinase AMP-activated catalytic subunit alpha 1 (PRKAA1, encodes protein that regulates metabolic enzymes and prevents from oxidative stress) were downregulated after exposure to 10 μg and 25 μg of CdTe-QD NPs at three different time points (6, 12, and 24 h) (Figure 6). Validation analysis of CdTe-QD NPs-mediated DEGs through quantitative real time PCR (qRT-PCR).
Discussion
Nanoparticles have been the subject of intensive scientific research regarding long term potential health impact. The distinctive physicochemical properties of QD NPs have led to their syntheses and utilization in the field of biomedical sciences. 20 The detail of the molecular mechanisms of QD NPs cytocompatibility and cytotoxicity remain to be uncovered. However, cadmium (Cd) located in QD core has been cited as the major source of toxicity associated with QD. 21 Cadmium release is a major mechanism of toxicity associated with CdTe-QDs. CdTe-QDs contain cadmium, a heavy metal known for its toxic properties. 22 When CdTe-QDs interact with cellular environments, they can release cadmium ions (Cd2+) from their surface. These cadmium ions can induce oxidative stress within cells, disrupting normal cellular functions and interfering with various signaling pathways. 23 Reactive Oxygen Species (ROS) Generation is another mechanism by which CdTe-QDs exert toxicity. CdTe-QDs have the ability to generate reactive oxygen species, such as superoxide anions (O2−) and hydrogen peroxide (H2O2), either through photoactivation or through interactions with intracellular components. The presence of these ROS can cause oxidative stress, leading to damage to cellular components such as proteins, lipids, and DNA. A handful of research reports have mentioned the toxicity of free Cd release from exposed core of Cd selenide (CdSe) or CdTe-QDs.24-27 Lovric et al (2005) reported that exposure to CdTe-QD NPs caused induction of apoptosis, condensation of the chromatin and fragmentation of the cell membrane in pheochromocytoma cells (PC12) of rat.15,28 Similarly, Katubi et al (2019) showed that 25 μg/ml CdTe-QDs induced apoptosis in Huh-7 cells through increased DNA damage, ROS generation and mitochondrial membrane depolarization. 19 Thus, free Cd release from QD NPs core substantially contributes to QD NPs toxicity. 27 The toxicity profile of Cd QD NPs has also been assessed in several studies.12,28,29 As reported in the study by Hardman et al (2006), Cd-based QD NPs have proven to be cytotoxic in several in vitro and in vivo studies. 29 Release of Cd2+ from Cd-based QD NPs can result in substitution of bioavailable Zn2+, induction of ROS and impairment of DNA damage repair, severely affecting normal cellular homeostasis. 30 Moreover, Nguyen et al also demonstrated that HepG2 cells exposed to CdTe NPs exhibited altered antioxidant levels, increased oxidative stress and activation of both intrinsic (involving mitochondrial permeabilization) and extrinsic apoptotic (involving increased activation of caspase 8 and Fas receptor) pathways. 15 Given these evidences, it is imperative to explore the underlying mechanistic detail of the molecular pathways activated by interaction between cellular components and CdTe-QD NPs and the resultant toxicity in terms of global gene expression.
Venn diagram analysis is often used as a first step to identify genes that may be implicated in common pathways under different experimental conditions. Here, we found several DEGs on Venn diagram analysis that can adversely affect important biological functions (Figures 1A and 1B). Similarly, there are previous studies that have identifed DEGs based of QD NPs exposure in different cell lines. Using Venn diagram analysis, Dua et al investigated several types of QD NPs including CdSe and CdZn NPs induced cytotoxicity profile in human embryonic kidney fibroblast cell line (HEK293) and found high levels of DEGs involved in key cellular functions. 20 Another research study by Monras and colleagues to evaluate the toxicity of semiconductor CdTe-GSH NPs on Escherichia Coli reported overexpression and repression of various genes controlling crucial cellular and metabolic processes.21,31
MAPK signaling pathway is one of the most important cell survival pathways, controlling not only responsiveness of cells to apoptotic cell death but also their readiness to differentiate or proliferate.20,32 In this study, expression of genes acting in the MAPK signaling pathway were induced upon exposure to both doses of CdTe-QD NPs, as depicted in heat map diagram through cluster analysis (Figures 2A and 2B). Besides, this pathway has been demonstrated to be triggered in response to exposure to Cd-based QD NPs.11,20 As such, it is evident that the GO terms identified in Huh-7 cell line exposed to CdTe-QD NPs represented genes that regulate key cellular processes involved in cell survival and possible tumorigenesis such as cell cycle regulation, DNA metabolism and injury, cellular stress, control gene expression, protein modification, macromolecule metabolism and cell death.
GO analyses that were performed highlighted genes involved in regulation of the cell cycle including cell death and survival, to be the most significantly affected for both doses and all time points investigated (Figures 3A–3C; 4A–4B). Alterations in the genes regulating the cell cycle has been demonstrated in different cancers such as prostate, breast, lung, and ovarian cancers where cancer cells sustain proliferative signaling through deregulation of gene expression of genes involved in the cell cycle,33-35 and has been identified as one of the hallmarks of cancer. 36 In essence, the activation of biological pathways regulated by genes involved in the cell cycle regulation may have been as a result of the selective pressure from the high cellular toxicity mediated by CdTe-QD NPs, which can have several implications such increased cell survival, resistance to chemotherapeutic agents, mediation of angiogenic signaling and delayed apoptosis. Similar effects have been reported by Zhang et al in human monocyte THP-1 cell line and Jang et al in human neuroblastoma SH-SY5Y cell line on exposure to iron NPs (Fe NPs) and copper oxide NPs (CuO NPs), respectively, where genes regulating cell progression through the cell cycle were differentially expressed.37,38
The results of canonical pathway were also in agreement with that of findings presented by other authors (Figures 5A-5E). For example, Jang et al mentioned the alteration in cell cycle gene expression when SH-SY5Y cell line was exposed to CuO NPs. 38 Similar to them, we also found enrichment of GADD45 pathway for all the doses and time considered under the investigation. The GADD45 family of proteins controls cell survival, cell cycle arrest, DNA repair, and apoptosis highlighting the overlap in the mechanism of the NPs toxicity. 39
All validated genes had greater than 1.5-fold change due to exposure to CdTe-QD NPs in the qRT-PCR analyses carried out. The genes validated through qRT-PCR showed fold change dose response in agreement with that of transcriptomic microarray analysis, indicating that the CdTe-QD NPs induced global gene expression alteration in Huh-7 cell line. With few exceptions, however, the extent of fold change observed in qRT-PCR was significantly raised than found on microarray analysis, which could be anticipated owing to high dynamic range offered by qRT-PCR compared to microarray.
Under conditions of cellular stress, cells respond through induction of stress related genes to deal with the varying conditions so as to prevent injury and death. 40 The qRT-PCR findings indicated that genes related to immune system regulation, inflammation, cellular homeostasis, oxidative stress response, protein trafficking, and tumor suppression were overexpressed, whereas genes of regulating the cell cycle, mitosis, cell growth and proliferation, histone protein, transcription, and cancer genes were downregulated (Figure 6). This could be interpreted as an inherent cellular response to external toxic stimuli to prevent cellular injury, enhance tissue repair, and inhibit cell death. Similar cellular defensive mechanisms in response to NPs-mediated cytotoxicity have also been observed for nanosilver, silicon, and iron oxides.41-43 However, the consequence of such mechanism may be accumulation of genetic damage that may occur due to reduced capacity of the cell cycle control and DNA damage repair systems which may induce cancer formation. Manipulation of the immune system is a common mechanism employed by cancer cells so as to evade the host immune response to avoid cell death. Similarly, cancer cells can also cause severe inflammation that may have pro-tumoral effect.
Conclusion
The study on CdTe-QDs inducing gene expression changes in Huh-7 cells showed important results regarding cell response to nanomaterials. The study found that genes related to cell cycle regulation, DNA repair, apoptosis, oxidative stress, cell death, gene expression, cancer, organism survival, and cellular development were differentially expressed in response to CdTe-QDs. These results demonstrate the complex interplay between cells and their environment and the need to understand these interactions to predict nanomaterial effects. The findings suggest that CdTe-QDs can interfere with cell functioning, leading to genomic instability and possibly cancer progression. The differential expression of genes related to cancer, and organism survival highlights the need to consider both short-term and long-term effects of nanomaterial exposure especially the impact of the released QD which may have toxic impact on cellular homeostasis.
Further research is required to understand the mechanisms behind the differential gene expression caused by CdTe-QDs and to determine the potential risks associated with exposure. Given the widespread use of nanomaterials, it is important to investigate their effects on cells and human health to ensure their safe and responsible use. This study contributes to our understanding of the cellular effects of nanomaterials and the need for future research in this field.
Supplemental Material
Supplemental Material - Exposure to Cadmium Telluride Quantum Dots and Gene Expression Profile of Huh-7 Hepatocellular Carcinoma Cell Line
Supplemental Material for Exposure to Cadmium Telluride Quantum Dots and Gene Expression Profile of Huh-7 Hepatocellular Carcinoma Cell Line by Hani Alothaid, Mashael R. Al-Anazi, Arwa A. Al-Qahtani, Dilek Colak, Azeez Yusuf, Mohammed S. Aldughaim, Ali M. Mahzari, Mahmoud M. Habibullah, Saud Alarifi, Saad Alkahtani, and Ahmed A. Al-Qahtani in Dose-Response.
Footnotes
Acknowledgement
The authors would like to thank the Research Centre administration at King Faisal Specialist Hospital & Research Centre for their support.
Declaration of Conflicting Interests
The author(s) declared no potential conflicts of interest with respect to the research, authorship, and/or publication of this article.
Funding
The author(s) received no financial support for the research, authorship, and/or publication of this article.
Supplemental Material
Supplemental material for this article is available online.
References
Supplementary Material
Please find the following supplemental material available below.
For Open Access articles published under a Creative Commons License, all supplemental material carries the same license as the article it is associated with.
For non-Open Access articles published, all supplemental material carries a non-exclusive license, and permission requests for re-use of supplemental material or any part of supplemental material shall be sent directly to the copyright owner as specified in the copyright notice associated with the article.