
Abstract
As the production and use of nanomaterials increases, it is important to understand their environmental and biological fate. Because their unmatched chemical, physical, and optical properties make them useful in a wide variety of applications including biomedical imaging, photo-voltaics, and light emitting diodes, the use of semiconductor nanocrystals such as quantum dots (QDs) is increasing rapidly. Although QDs hold great potential in a wide variety of industrial and consumer applications, the environmental implications of these particles is largely unexplored. The nanocrystal core of many types of QDs contains the toxic metal cadmium (Cd), so possible release of Cd from the QD core is cause for concern. Because many types of QDs are miscible in water, QD interactions with aquatic organisms and their environment require more attention. In the present study we used fluorometry to measure time and dose dependent uptake, accumulation, and post-exposure clearance of accumulated QDs in the gut tract by the aquatic vertebrate Pimephales promelas. By using fluorometry, we were able to measure accumulated QD concentrations. To our knowledge, this is the first reported attempt to quantify accumulated QDs in an organism and is an important step in understanding the interactions among QDs in aquatic organisms and environments.
INTRODUCTION
Quantum dots (QDs) are engineered semi-conductor nanocrystals with unique chemical, physical, and optical properties that make them useful in a wide variety of applications including light emitting diodes (Caruge et al. 2008; Yeh et al. 2008), security inks (Abitbol and Gray 2009), quantum computing (Hennessy et al. 2007), photovoltaics (Leschkies et al. 2007), and photodynamic cancer therapies (Juzenas et al. 2008). QDs’ fluorescence is arguably their most valuable property rendering them superior to conventional fluorophores in both sensitivity and stability, thus making them ideal for biomedical imaging and use as bioanalytical probes (Iga et al. 2007; Frasco and Chaniotakis 2009). The shape and composition of QDs can be altered so that wavelengths of emitted light range from the near ultraviolet to the infrared, and because of their broad excitation range they can be “tuned” for simultaneous fluorescent analysis of multiple cell components and molecules. The QD semiconductor core is ∼2 – 10 nm in diameter but after coating their final size ranges from ∼10 – 100 nm. Commercially available QDs typically contain a semiconductor metalloid core of CdS, CdSe, CdTe, or PbS enclosed by a layer of ZnS to add mechanical and photostability. QDs can then be coated with a carboxyl- or amino-derivatized amphiphilic coating which can further be functionalized with bioactive moieties (antibodies, receptor ligands, peptides, PEG, etc.) increasing their utility for a broad range of applications.
Although QDs are now in commercial production, however, to assure that they are safely mainstreamed into commercial and clinical products regulatory testing is being considered. If enacted, regulation may require that the toxicity and biological fate of QDs be known including understanding the absorption, distribution, metabolism, and excretion kinetics as well as the transportation and transformation of QDs in the environment (Pelley et al. 2009). Unfortunately, little is known about possible QD absorption and translocation, much less their fate in aquatic environments. Some of the elements in the QD (e.g. cadmium, selenium) are known toxicants to aquatic organisms, and it is has been demonstrated that the core of CdSe-ZnS QDs can be exposed under oxidative environmental conditions resulting in erosion of the nanocrystal core (Metz et al. 2008). It has also been demonstrated that QD surface chemistry is altered by exposure to light affecting their toxicity and physiochemical characteristics (Lee et al. 2009) and that they can be degraded by photo-(Hardman 2005) and/or air-oxidation (Rzigalinski and Strobl 2009). Therefore, the environmental fate and toxicity of QDs warrants further study.
At present little is known about the stability, bioavailability, and toxicity of QDs in aquatic environments; arguably even less is known about the interactions between QDs and aquatic organisms. Recent studies have begun to address such interactions. CdTe QD exposure to the freshwater mussel, Elliptio complanata, resulted in Cd accumulation within the gills and digestive glands and an increase in metallothionein production (Peyrot et al. 2009). Incubation of CdSe/ZnS QDs with zebrafish embryos resulted in observed toxic endpoints after 120-hr incubations (King-Heiden et al. 2009). Our research group has demonstrated the time and dose dependent accumulation of CdSe/ZnS QDs by the aquatic invertebrate Ceriodaphnia dubia (Ingle et al. 2008) as well as the food chain transfer of CdSe/ZnS QDs from contaminated freshwater algae to C. dubia (Bouldin et al. 2008). More recently we reported differences in the dietary and environmental uptake of QDs by juvenile Pimephales promelas (SenGupta et al. 2009). In the present study we used fluorometry to characterize time and dose dependent gut QD accumulation, to verify clearance of accumulated QDs and to measure accumulated QD concentrations in the intestinal tract by the aquatic vertebrate, P. promelas.
METHODS AND MATERIALS
P. promelas were obtained from the Arkansas State University Ecotoxicology Research Facility where they were cultured in accordance with US EPA protocol (US EPA 2002—EPA Protocol 821-R-02-013). Dechlorinated tap water (DTW) was used for fish maintenance and QD suspensions. Adult fish 6–8 months of age were maintained at a temperature of ∼22°C and were fed dietary flakes (TetraMin® Tropical Flakes) daily.
Commercially available Q-Dot® 655 ITK™ Carboxyl Quantum Dots (Invitrogen, USA; Invitrogen part no Q21321MP) were used in all experiments. These nanoparticles have an organic polymer coating with free carboxyl groups on the surface and have a peak emission wavelength between 651 and 659 nm. QDs were purchased in stock concentrations of 8 μM. Fluorescent readings throughout the experiments were taken using a 340 nm narrow band excitation filter and a 635 nm sharp cutoff emission filter that passed light of wavelengths greater than 635 nm.
Aqueous exposure
Depending on the experiment, individuals were exposed to 0.1, 0.5, 1.0, or 2.0-nM QD suspensions for 5, 24, or 72-h. Exposure concentrations were calculated based on manufacturers reported concentration of purchased QDs. Each animal was put in a separate exposure chamber containing 50 mL of the QD suspensions. No additional QDs were added to suspensions during any exposure. To avoid QD loss of fluorescence due to photo-oxidation, exposures were conducted in the dark (Lee et al. 2009). Control organisms were treated identically except no QDs were added to the DTW used as an exposure media. All organisms were unfed 15 h prior to and during exposure. No toxicity or signs of stress (e.g. gulping air at the surface of exposure vessels) were associated with experimental protocols or QD exposure were observed during the 72 h maximum exposure period in any experiment. All fish were weighed post exposure and comparison of the weights of exposed and unexposed fish revealed no significant difference in their sizes (p = 0.5702).
Tissue analysis
Fish were sacrificed post exposure and their intestinal tracts immediately dissected and weighed. Comparison of the masses of dissected intestines from control and exposed animals showed no significant difference (p =0.7116). There was also no significant correlation between intestine weight and calculated QD concentrations [QD] (R2 avg. = 0.3006). Intestines were placed in a 15-mL centrifuge tube containing 3 g (3 mL) of DTW water. Intestines were homogenized using a PT Polytron 3100® tissue homogenizer ramped to 15,550 rpm over 8 s. To remove any remaining solid particles that could interfere with fluorescence analysis the resulting homogenate was placed in microcentrifuge tubes and centrifuged for 3 min at 1.5g at 20°C. The pellet was discarded, and the supernatant was centrifuged again for 3 min at 2.4g at 20°C. The remaining supernatant was placed in cuvettes for fluorescence analysis using a Quantech Digital Filter Fluorometer (model FM109555). Fluorescence of each liquefied sample was measured with the fluorometer and reported as “Fluorescence Intensity Units” (FIU). The FIU of each sample was measured 5 times, and the mean value is reported for each sample.
[QD] measurements
QD suspensions of nominal concentrations ranging from 0.05 to 2 nM (y) were prepared in DTW and their FIUs (x) measured. Results were plotted and a standard curve for each exposure was generated (Figure 1). FIUs of fish tissue were then measured and if significant differences were measured (p ≤ 0.05) between control and exposed tissue, [QD] were calculated from the standard curve after accounting for tissue autofluorescence. FIU measurements were corrected for tissue autofluorescence by subtracting the mean FIU of intestines from control fish (unexposed) in each experiment from the FIU of intestine from each exposed fish in the experiment. The corrected FIU was converted to [QD] using the standard curve. This value was then multiplied by a dilution factor:

to determine the intestinal [QD] for each exposed fish. Additionally, bioconcentration factors (BCF) were calculated by,

and fluorescence intensity per unit weight was determined by


Standard Curve. Example of a standard curve used to calculate [QD] in the gut of the fish. A unique standard curve was developed for each exposure set to insure that instrument drift had a minimal impact on results. All standard curves had a minimum R2 value of at least 0.94. All fluorescence intensity measurements used an excitation λ = 340 ± 5 nm and emission λ ≥ 635 nm.
BioConcentration
Fish were exposed to 2.0-nM QD suspensions for 5, 24, or 72 h (n=10, 15, and 9, respectively). Control organisms were placed in DTW without QDs for the same time periods (n=10 for all time periods). Fish were exposed, dissected, and isolated intestinal tracts processed and analyzed as described above.
Clearance
Following 24-h exposure to QD suspensions, fish (n=10) were removed from the exposure chamber and placed in 250-mL DTW without QDs for 24 h. Control fish (n=10) were treated identically except initial 24-h exposure did not contain QDs. Fish were processed and analyzed as described above.
Dose response
Fish were exposed to 0.1, 0.5, 1.0, or 2.0-nM QD suspensions for 24 h (n=10, 9, 9, and 15 respectively). Control organisms received identical treatment with no QD exposure (n=10, 10, 8, and 10 respectively). Fish were processed and analyzed as described above.
Effects of fish on QD suspension concentration
Ten exposure containers were filled with 50 mL of 2.0-nM QD suspension. One fish was added to 5 of the containers. Control chambers were identical except no fish were added. The fluorescence of each QD suspension was measured at 0, 5, 24, and 72 h so that time-dependent changes in fluorescence of QD suspensions with and without fish could be compared.
Statistics
All tests for significance were conducted using the unpaired t-test with Welch's correction. P values less than 0.05 were considered significantly different. Tests for normality were conducted using the D'Agostino & Pearson omnibus normality test (alpha = 0.05) (GraphPad Prism® Version 5.0, 2007; GraphPad Software, Inc.), and all intestinal fish samples passed.
RESULTS
Time dependent bioConcentration (Experiment 1)
Exposure to 2.0-nM QD suspensions for 5, 24, and 72 h revealed a time dependent bioConcentration of QDs in the digestive tract of the exposed fish (Figure 2). Following 5-h exposures, calculated average [QD] of the intestine was ∼15 nM, resulting in a bioconcentration factor (BCF) of 7.5. After 24-h exposures the average intestinal [QD] was ∼34 nM resulting in a BCF in the intestine of 17. QD bioConcentration by the intestine during a 24 hr exposure was significantly different from the bioConcentration after a 5 or 72 h exposure (p < 0.0043). After 72 h fluorescence in the intestine of exposed animals was less than that observed from 24-h exposures, and average intestinal [QD] was ∼13 nM, which was not significantly different from 5-h exposures (p = 0.1484). All measured intestine [QD] were significantly different from the [QD] in the suspension to which fish were exposed (p < 0.0001).
Clearance (Experiment 2)
Our data show that the fish are capable of clearing accumulated QDs when placed in QD-free DTW following exposure. After 24 h in QD-free DTW, the fluorescence intensity per unit mass of intestinal tracts dissected from unexposed (control) and exposed animals were not significantly different (p = 0.7695). Thus no measurable amounts of QDs were found in the intestine.
Dose response (Experiment 3)
Exposure to QD suspensions of different concentrations for 24 h resulted in a dose-dependent accumulation of QDs in fish intestines (Figure 3). Fluorescence from accumulated QDs in the fish gut was below detectable levels after exposure to 0.1-nM QD suspensions. Exposure to 0.5-nM QD suspensions resulted in average intestinal [QD] of ∼17-nM. Exposure to 1.0 and 2.0-nM QD suspensions resulted in average intestinal [QD] of ∼34-nM and ∼32-nM, respectively. Intestinal [QD] measured in fish from 1.0 and 2.0 nM QD suspensions were significantly different from those measured after exposure to 0.5-nM QD suspensions (p < 0.0079).

Time Dependent BioConcentration. Fish were exposed to 2 nM QD suspensions for 5 (n=10), 24 (n=15), and 72 h (n=10). The gut of each fish was isolated, homogenized, and its fluorescence measured with a fluorometer; Average intestinal [QD] were significantly greater than the [QD] of the incubation suspension at all exposures (p < 0.0001). After 24-h exposures, average intestinal [QD] was significantly greater than that of 5- and 72-h exposures (p < 0.0043). However, after 72-h incubations average intestinal [QD] were not significantly different than the average intestinal [QD] after 5-h exposures (p = 0.1484). ∗ – denotes significant difference from average intestinal [QD] from 24-h exposures, τ – denotes significant difference from [QD] in exposure suspension.
Effects of presence of fish on [QD] Suspension (Experiment 4)
Because observed intestinal [QD] was less after a 72 than a 24-h exposure (Figure 2), the effect of the presence of fish in the suspension was evaluated by measuring the [QD] in suspension 0, 5, 24, and 72 h after the introduction of fish (Figure 4). This was done to determine if, after 72 h under conditions used for exposure, QD fluorescence was diminished even when fish were not present in the suspension. This experiment also allowed comparison between decreases in fluorescence of the QD suspensions that did or did not contain fish and was necessary to characterize the fluorescence intensity of exposure suspension over time to understand how time and the presence of fish each affected the fluorescence of the exposure suspensions. As in previous experiments, all suspensions were maintained in the dark to minimized photo-degradation of QDs. The results of these experiments demonstrate that after 5 h the presence of fish produced no measureable difference in the incubating suspensions (p = 0.5594). However, after a 24- or 72-h exposure the presence of fish significantly accelerated the loss of the fluorescence intensity of the incubating suspensions (p = 0.0314 and 0.0144, respectively).

Dose Response. Average intestinal [QD] were measured after 24-h exposures to 0.1-nM, 0.5-nM, 1-nM, and 2-nM QD suspensions. No fluorescence was detectable in the intestines of fish exposed to 0.1-nM QD suspensions for 24 h. This suggests that fish did not accumulate detectable amounts of QDs when exposed to water containing 0.1-nM suspensions. However, average intestinal [QD] after 24-h exposure to 0.5-nM, 1-nM, and 2-nM QD suspensions were ∼17 nM (n=9), ∼ 32 nM (n=9), and ∼34 nM (n=15), respectively. With the exception of fish exposed to 0.1 nM QDs, all measured accumulations were significantly greater than the [QD] in suspensions to which fish were exposed (p < 0.0001). ∗ denotes significant difference from average intestinal [QD] of fish from other suspension concentrations.
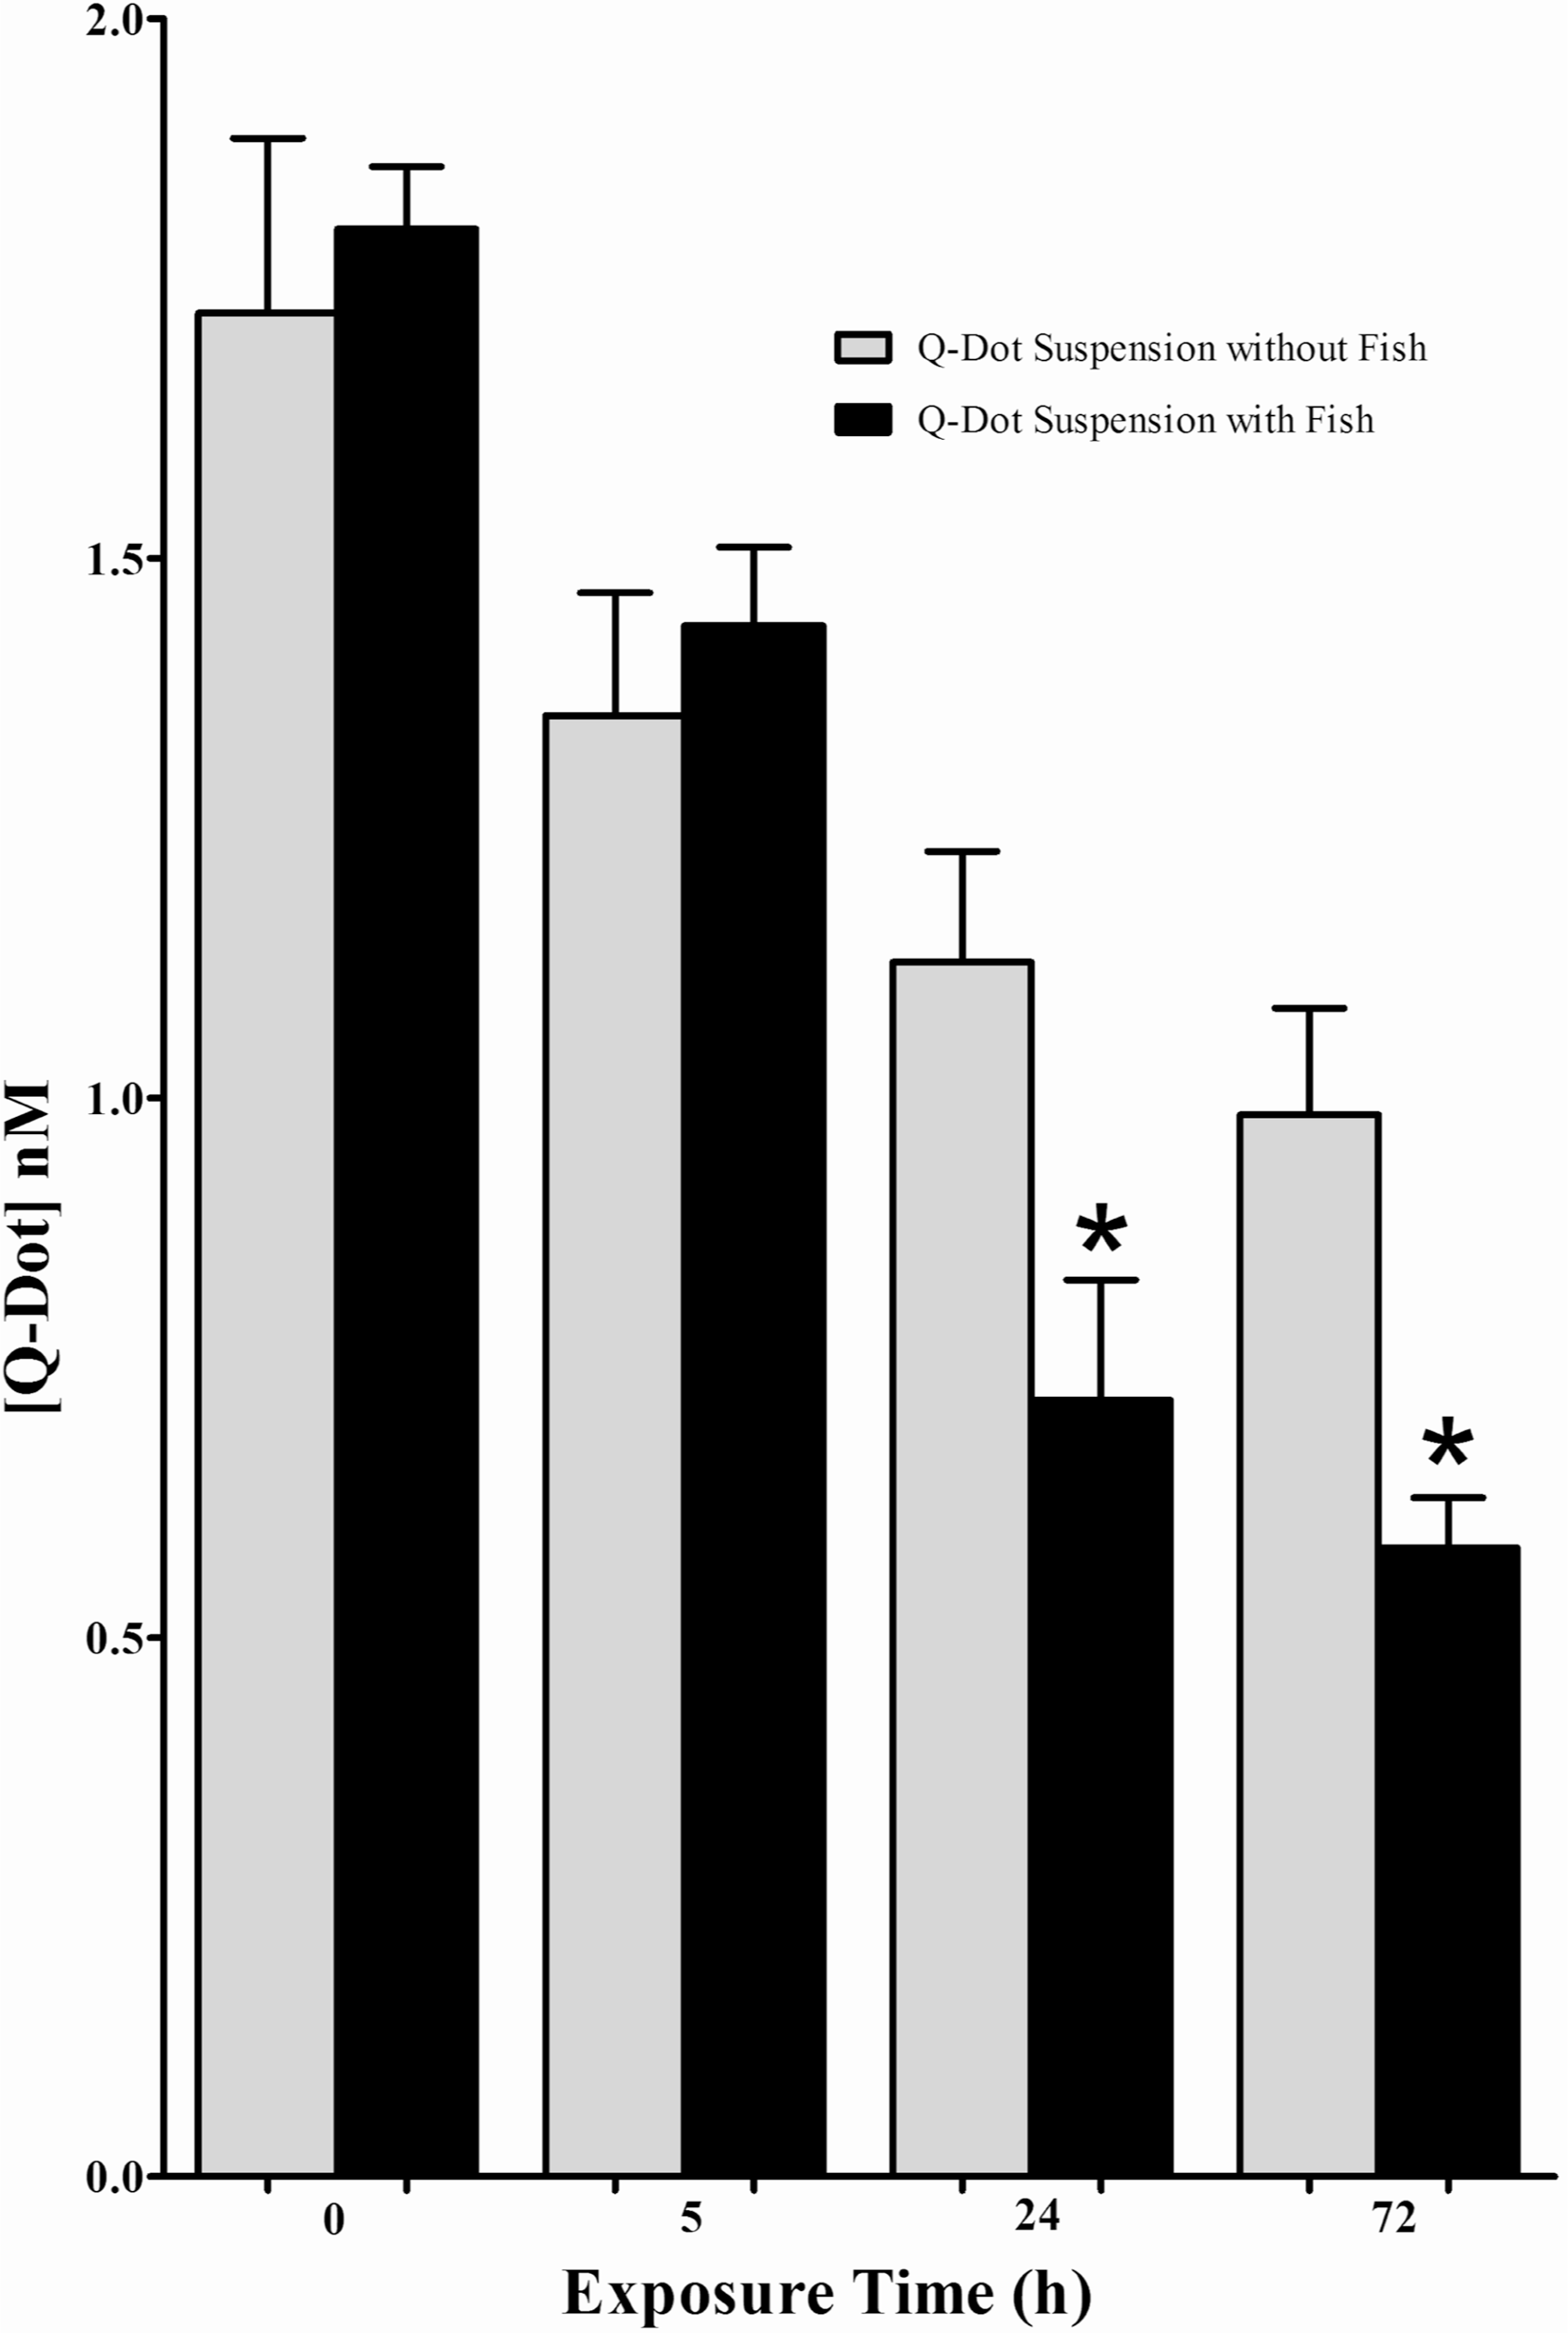
Effects of presence of fish on [QD] of suspension. The fluorescence intensities of QD suspensions that contained or did not contain fish (n = 5 for both groups) were measured at time points of 0, 5, 24, and 72 h. [QD] were calculated for each condition and time point. Average fluorescence of the exposure suspension declined over time for both groups. However, beginning at the 24-h time point the decline in fluorescence intensity was greater in suspensions containing fish than in those without fish, suggesting a fish/QD interaction. ∗ – denotes significant difference of measured [QD] of suspensions with fish compared to suspensions of the same exposure time without fish.
DISCUSSION
In the present study, fish accumulated QDs in a time- and dose-dependent manner. Although accumulation of QDs by other tissues (brain, muscle, heart; data not shown) was assayed using fluorescence microscopy and fluorometry, only in the isolated intestine were measurable changes in FIU observed. This result is significant because it demonstrates that QDs are accumulated in a major absorptive site upon exposure to nM concentration of QDs (Experiment 1). The results also show that the fathead minnow accumulates QDs against a significant concentration gradient with intestinal accumulations ∼ 35 times greater than the suspension medium during a 24-h exposure. This represents a considerable accumulation of QDs after acute exposure. The mechanism by which QDs were accumulated in the fish intestine is unknown. They may have been absorbed by intestinal epithelial cells or remained in the intestinal lumen, possibly because of interactions with other substances within the intestine.
While, at present, there is no information about the concentrations of QDs likely to be found in aquatic systems, even a temporary accumulation of QDs by the intestine may be cause for concern. QDs are known to degrade in acidic or basic environments (Zhang et al. 2008), thus accumulation of QDs in the acid environment of the fish intestine (Wiecinski et al. 2009) may lead to accelerated QD degradation that could result in release and subsequent absorption of Cd and Se by the fish. Thus, the presence of even small amounts of QDs in aquatic environments could have a significant impact on the health of fish.
However, after a 72-h exposure intestinal [QD] was significantly lower than accumulation after a 24-h exposure to a suspension containing the same amount of QDs (Experiment 2). This observation was unexpected, but coincides with previous research from our group that showed a decrease in the fluorescence intensity of C. dubia after 24-h QD exposures (Ingle et al. 2008). One possible explanation for this observation is that there is a maximum amount of QDs that can be bioConcentrated in the fish intestine and that once this maximum is reached, further exposure does not result in increased accumulation. However, if concentrated QDs are translocated or structurally altered as a result of accumulation, there are several other possible explanations for this observed response. For example, it is possible that, in fish, accumulated QDs move from the digestive tract to other tissues over time. If translocation of QDs occurred, intestinal [QD] would decrease while the total bioconcentration of QDs within the fish actually increased. Although other organs were assayed for exposure associated increases in fluorescence, we were unable to measure any increases in FIU in other tissues using these methods. This suggests that intact QDs did not cross the intestinal epithelium, at least not in sufficient number to be detected using fluorometry. It is also possible that QDs were degraded after accumulation in the fish digestive tract. Others have reported that degradation of QD structure decreases their fluorescence intensity (Lee et al. 2009). Thus, QD degradation in the fish digestive tract might reduce fluorescence from intact QDs under our test conditions. If QDs are degraded as they pass through the fish digestive system, it would be cause for concern because it has been shown that CdSe/ZnS QDs are much more toxic after ZnS cap degradation, presumably because the toxic metals in the core become bioavailable on the QD surface (Derfus et al. 2004; Hardman 2005; Pelley et al. 2009). Both of these explanations for the time-dependent decrease in accumulated [QD] raise the possibility that by after a 72-hr exposure potential effects of QDs accumulated in the intestine might be greater than fluorescence data suggest. While the presence of Cd and other metals released by QD degradation could be measured in fish tissues, the primary purpose of these experiments was to use fluorometry to measure QD accumulation, so measurements of metals was beyond the scope of the study.
The results of Experiment 3 suggest that intestinal accumulation of QDs after acute exposures is easily reversed. Within 24 h after exposure no QDs could be detected in intestines of animals placed in DTW without QDs for 24 h. This suggests that whatever the mechanism supporting intestinal accumulation of QDs, the accumulation is not permanent so that even if observed accumulations did result in negative health impacts, short-term acute exposures to QDs might have much less effect than sustained exposures. Although this result is encouraging, the possibility that QDs in the intestine of exposed fish were degraded within 24 h cannot be disregarded. If that occurred, fluorescence derived from QDs would not be present and metal released by QD degradation might have been absorbed. Future experiments to detect the presence and measure the amounts of metals in the QDs need to be conducted to explore this possibility.
The results of Experiment 4 show that although under the exposure conditions used in this study, fluorescence of QD suspensions decreases slightly over 72 h, the presence of fish in the suspension greatly accelerates this decrease. While this observation supports the possibility that QDs are degraded resulting in a decrease in their fluorescence in the fish intestine, there are other explanations for this result. For example, if QDs are absorbed and being subsequently translocated from the fish intestine to other tissues, the expected result would be that the fluorescence intensity in suspensions containing fish would decline more rapidly than that of suspensions without fish. Alternatively, because the surface of the suspensions was in contact with ambient air, we cannot eliminate the possibility that air-oxidation played a role in QD degradation in all QD suspensions (Rzigalinski and Strobl 2009). However, if QDs were spontaneously degraded over time the presence of fish would have little effect on the fluorescence of the suspension and it is unlikely that the presence of fish in the 50-mL incubating suspension would have altered oxidative-degradation. It is also plausible that the loss of measureable [QD] could be attributed to external accumulation of QDs on the bodies and gills of fish which would contribute to the loss of free QDs in the suspension thereby decreasing the fluorescence intensity of the suspensions (Peyrot et al. 2009).
While these data do not allow us to determine the reason for this reduction in fluorescence intensity of incubation chambers containing fish, they suggest that QDs in the fish intestine are either translocated to other organs or that the presence of fish accelerates QD degradation. Thus, these results warrant further study because they indicate that environmental release of QDs may result in aquatic exposure to the toxic Cd in the QD core via environmental or biological QD degradation.
These results are, to our knowledge, the first report of measured [QD] within an exposed organism and suggest QD accumulation in a time and dose dependent manner by organisms exposed to sub-nanomolar concentrations of QDs. In this study, fish appear to continue to accumulate QDs against significant concentration gradients until intestinal [QD] reaches approximately 30-nM. The accumulation can be detected as long as fish are in QD-containing water. These measurements were made only after acute exposures (maximum exposure of 72 h), and suggest chronic studies must be performed to fully understand the QD/aquatic environment interactions. These results also show the ability of fish to clear accumulated QDs when placed in QD-free water. Finally, our data also show that the presence of fish in the QD suspension increased the rate at which the fluorescence intensity of the suspension decreased a further indication of biotic uptake and/or degradation of QDs. Therefore, these data are important to understanding the consequences of QD contamination of aquatic environments and augment existing reports of metal accumulations following exposure to QDs.
Footnotes
ACKNOWLEDGEMENT
The authors would like to acknowledge students and workers at the Arkansas State University Ecotoxicology Research Facility for providing fish. This research was funded by NIH Grant Number P20 RR-16430 from the INBRE Program of the NCRR (Buchanan) and the Arkansas Biosciences Institute (Buchanan and Leigh).