
Abstract
Adipic dihydrazide and heparin were attached to ZnO quantum dots surface, and the ZnO-adipic dihydrazide-heparin nanocomplex was used as a drug delivery system to deliver paclitaxel for chemotherapy. The surface modification and the loading of paclitaxel were confirmed by Fourier transform infrared spectrum, featured by characteristic peaks from functional groups of adipic dihydrazide, heparin, and paclitaxel. The impacts of pH on the drug release were investigated, and the cytotoxicity studies were conducted with A549 cells. The pharmacokinetic study was conducted with male Wistar rats. Both in vitro and in vivo study indicated that ZnO-adipic dihydrazide-heparin-paclitaxel nanocomplex could deliver paclitaxel in a more controllable way, and it has the potential to be a high-efficiency drug delivery system for cancer treatment.
Introduction
One of the most widely used cancer treatments is chemotherapy. 1 -5 However, its side effects and limited efficiency have been a great pain to patients. To solve this problem, developing an efficient drug delivery system (DDS) for the chemotherapy agent has attracted humongous attention. 6 -9 Various drug delivery materials, including polymers, proteins, and organic/inorganic nanoparticles, have been used to develop DDS. 10 -17 Among these drug delivery materials, photoluminescent semiconductor quantum dots (QDs) have been a great interest due to its distinct photochemical properties. For example, Cadmium Sulfide (CdS) QDs have been used for in vivo bioimaging and therapeutic application due to their high quantum yields. 18 -21 However, there are still challenges for the further applications of semiconductor QDs for drug delivery. The first issue is surface inertness, which prevents the loading of drugs to its surface. The second issue is that most of the semiconductor QDs are toxic to tissues. However, ZnO is a low toxic and inexpensive dots and has the potential to be used for drug delivery and other therapeutic applications. 22
Compared with the DDS using traditional materials, ZnO QD drug delivery platform could bring extra benefits. Specifically, ZnO QDs could be dissolved into Zn2+ when the pH is less than 5.5. 23 Researchers have found Zn2+ could preferentially kill the tumor cells while has little impact on the healthy cells. 24,25 Due to this feature, the pH-sensitive ZnO QD DDS could be a great interest for drug delivery. In recent studies, ZnO particles have been used as a carrier to deliver drugs. 26 -28 The system with ZnO and drug has shown a synergistic performance to kill tumor cells. However, the agglomeration of ZnO particles has prevented the further release of drugs, and the large size of ZnO particles is difficult to be dissolved under the pH of 5. 27 To solve this problem, we apply ZnO QDs for drug delivery to increase the dispersion and dissolution efficiency.
Paclitaxel (PTX) is one of the most used chemotherapeutic agents because of its high antitumor efficiency for various cancers. 29,30 However, its poor water solubility has limited its efficiency in clinical applications. 31 Paclitaxel combined with adjuvant is used in current clinical administration to mitigate the solubility problem, but it results in unexpected pharmacokinetics and biodistribution. 32 Therefore, there is a strong need to develop an innovative DDS for PTX to increase its solubility, delivery, and release, so that the therapeutic effect could be increased while the side effects could be decreased. Even though various DDSs, such as carbon nanotubes 33 Fe3O4 34 and metal frame works, 35 have been used for PTX delivery, the efficient drug deliver and release are still a great bottleneck.
In this study, adipic dihydrazide (ADH) is used to modify the surface of ZnO QDs due to its extensive amino groups, which could react with free carboxylic groups to form an amide linkage. 36 After the surface modification, both heparin (Hep) and PTX are attached to ZnO surface, forming ZnO-ADH-Hep-PTX nanocomplex. The Hep surface is covered with eukaryotic cells, which could prevent the formation of clots in the blood. 37 Finally, the PTX release from ZnO-ADH-Hep-PTX is studied under in vitro and in vivo conditions. As a reference, the molecular structures of ADH and Hep are presented in Figure 1A and B.
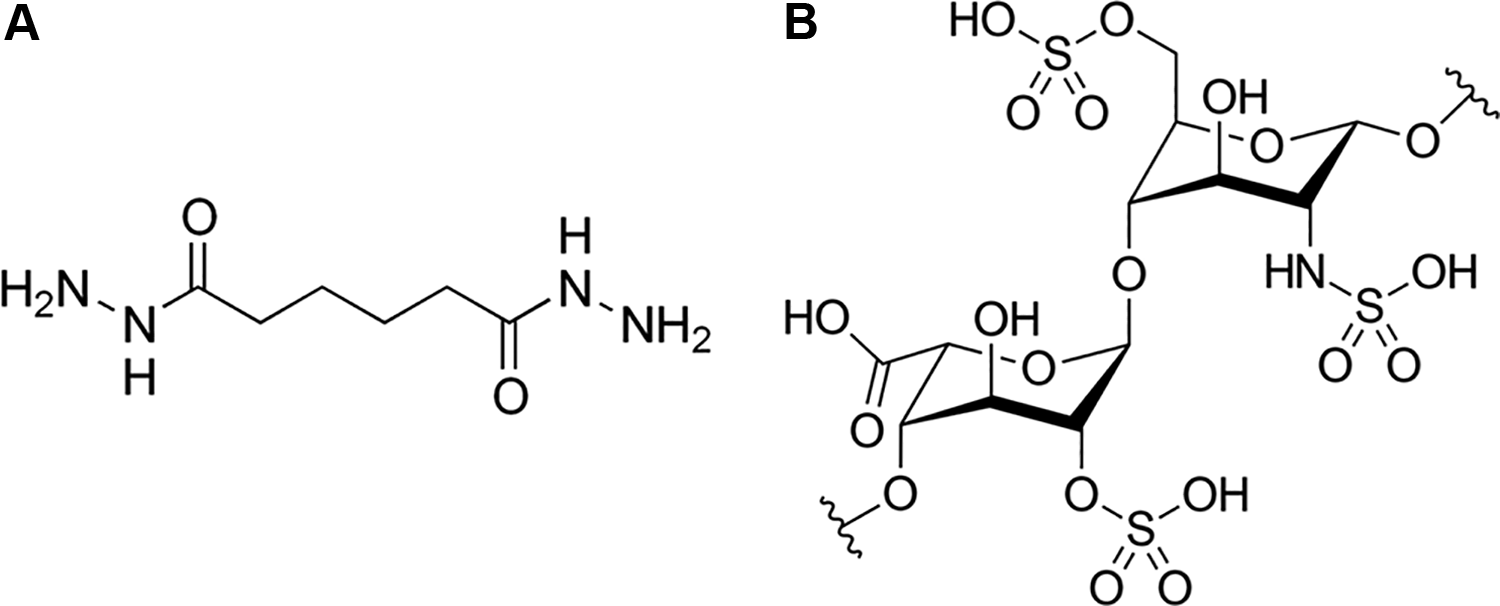
The molecular structure of (A) adipic dihydrazide and (B) heparin.
Experimental Methods
ZnO QD Synthesis
ZnO QD synthesis was based on a previous paper. 38 Specifically, zinc acetate (0.1 mol, Sigma Aldrich, 98%) was refluxed in ethanolic solution (50 mL, VWR) for 2 hours. After that, the zinc acetate solution (10 mL) was diluted with ethanol (20 mL), and LiOH powder (2.8 mmol, Sigma Aldrich, 99%) was added to the previous solution with magnetic stirring. Finally, ZnO QDs were produced from the reaction, washed with n-hexane and ethanol, separated with a centrifuge, and dried in air at 50 °C for 8 hours.
ZnO-ADH-Hep Complex Synthesis
Heparin was attached to ZnO QDs through the amino groups of ADH. Firstly, ADH (1.2 g, Sigma Aldrich, >99.5%) was mixed with ZnO QDs (0.1 mg) in 50 mL deionized (DI) water under mechanical stirring for 2 hours. After that, Hep (0.20 g, molecular weight: ∼15 kDa, Sigma Aldrich) was added into the solution. The solution was magnetically stirred for 24 hours. Finally. The solution was dialyzed to remove water and lyophilized to obtain ZnO-ADH-Hep nanocomplex.
ZnO-ADH-Hep-PTX Synthesis
Loading PTX onto ZnO-ADH-Hep was achieved by mixing PTX with ZnO-ADH-Hep solution at room temperature in the darkroom under stirring for 24 hours. The as-obtained ZnO-ADH-Hep-PTX nanocomplex was obtained by centrifugation to remove unbounded PTX in the solution. The ZnO-ADH-Hep-PTX was then suspended in DI water and saved at 4 °C for future use. The amount of PTX loaded to ZnO-ADH-Hep was determined from the concentration of unbounded PTX in the solution, whose concentration was studied by UV absorbance at 482 nm. The drug loading could be calculated by the following equation:


The synthesis process of ZnO-ADH-Hep-PTX is simplified in Figure 2.

The illustration for ZnO-ADH-Hep-PTX synthesis process.
In Vitro PTX Release From ZnO-ADH-Hep-PTX
To investigate the PTX release, ZnO-ADH-Hep-PTX (0.5 mg/mL, 1 mL) was introduced into a dialysis bag (molecular weight cutoff: 10-16 kDa), which was put into 10 mM PBS (20 mL), and the pH was controlled at 5.0 and 7.4, in 2 parallel experiments. The temperature was controlled at 37 °C ± 0.2 °C. In every predetermined time interval, 1 mL of the release medium was taken out, and the same volume of the freshly released medium was added to maintain the sink condition.
Cytotoxicity Studies
A549 cells (human non-small cell lung cancer cell lines) were used for cytotoxicity studies. Generally, A549 cells were seeded on 96-well plates, and the density was 5000 cells/well, and the volume of the cell media is 100 uL. The same concentration of Zn2+ and ZnO QDs are incubated with the cells for 48 hours. Similarly, free PTX and ZnO-ADH-Hep-PTX were also incubated with the cells for 48 hours. The cytotoxicity was studied with MTT method. 39
Pharmacokinetic Study
Male Wistar rats (weight: 250 ± 20 g), supplied by the laboratory animal center of Heilongjiang University of Chinese Medicine, were evenly divided into 2 groups of A and B (with 8 rats in each group) for free PTX and ZnO-ADH-Hep-PTX, respectively. Before the experiment, the rats were fasted for 12 hours with unlimited access to water. Groups A and B were supplied with a single dose of PTX (10 mg/kg) in the form of free PTX and ZnO-ADH-Hep-PTX through intravenous injection. At defined intervals, blood (0.5 mL) was drawn from the subclavian vein of each rat. The plasma was obtained through centrifugation and stored at −20 °C for future analysis. To determine the concentration of PTX, a calibration curve was made. Specifically, different concentrations of PTX solution (20 μL) and rat serum (180 μL) were mixed with a precipitant solvent (5 mL). The mixed solution was centrifuged at 3000 rpm for 30 minutes and extracted for 24 hours at −20 °C. After 24 hours, the sample was vortexed for 20 minutes at 10 000 rpm, and the top liquid was extracted for fluorescence intensity measurement. After repeating with different concentrations of 0.05, 0.5, 1, 10, 25 mg/mL PTX solution, the calibration curve was obtained. Drug and Statistics (DAS, version 2.0) was used for the pharmacokinetic study.
Characterization
The as-synthesized particles were characterized by TEM (Hitachi HT7800), XRD (Bruker D8), and XPS (Thermo Scientific, K-Alpha) for morphology, crystal structure, and surface chemical states. 40 The surface functional groups of ZnO-ADH-Hep-PTX were determined by Fourier transform infrared spectrum (FTIR, Perkin Elmer, GX). 41 The PTX concentration during drug release was determined by fluorescence spectroscopy (SHIMADZU, RF-6000).
Results and Discussion
Materials Characterization
The TEM image of the as-synthesized ZnO QDs is presented in Figure 3A, and the corresponding size distribution is shown in Figure 3B. It can be seen that the size follows normal distribution and the average size is 10.67 nm based on the counting of 133 particles. The HRTEM of the ZnO QDs is displayed in Figure 3C. The lattice distance of 0.28 nm refers to ZnO (101) crystal plane. The TEM diffraction patterns are shown in Figure 3D. The diffraction rings indicate the polycrystalline nature of ZnO QDs, and the diffraction rings correspond to patterns listed in the JCPDS card (no. 043-0002), indicating that the ZnO QDs are well crystallized without secondary phases. The XRD peaks displayed in Figure 3E match well with those in Figure 3D. The particle size could be calculated based on the XRD peaks through Scherrer equation:

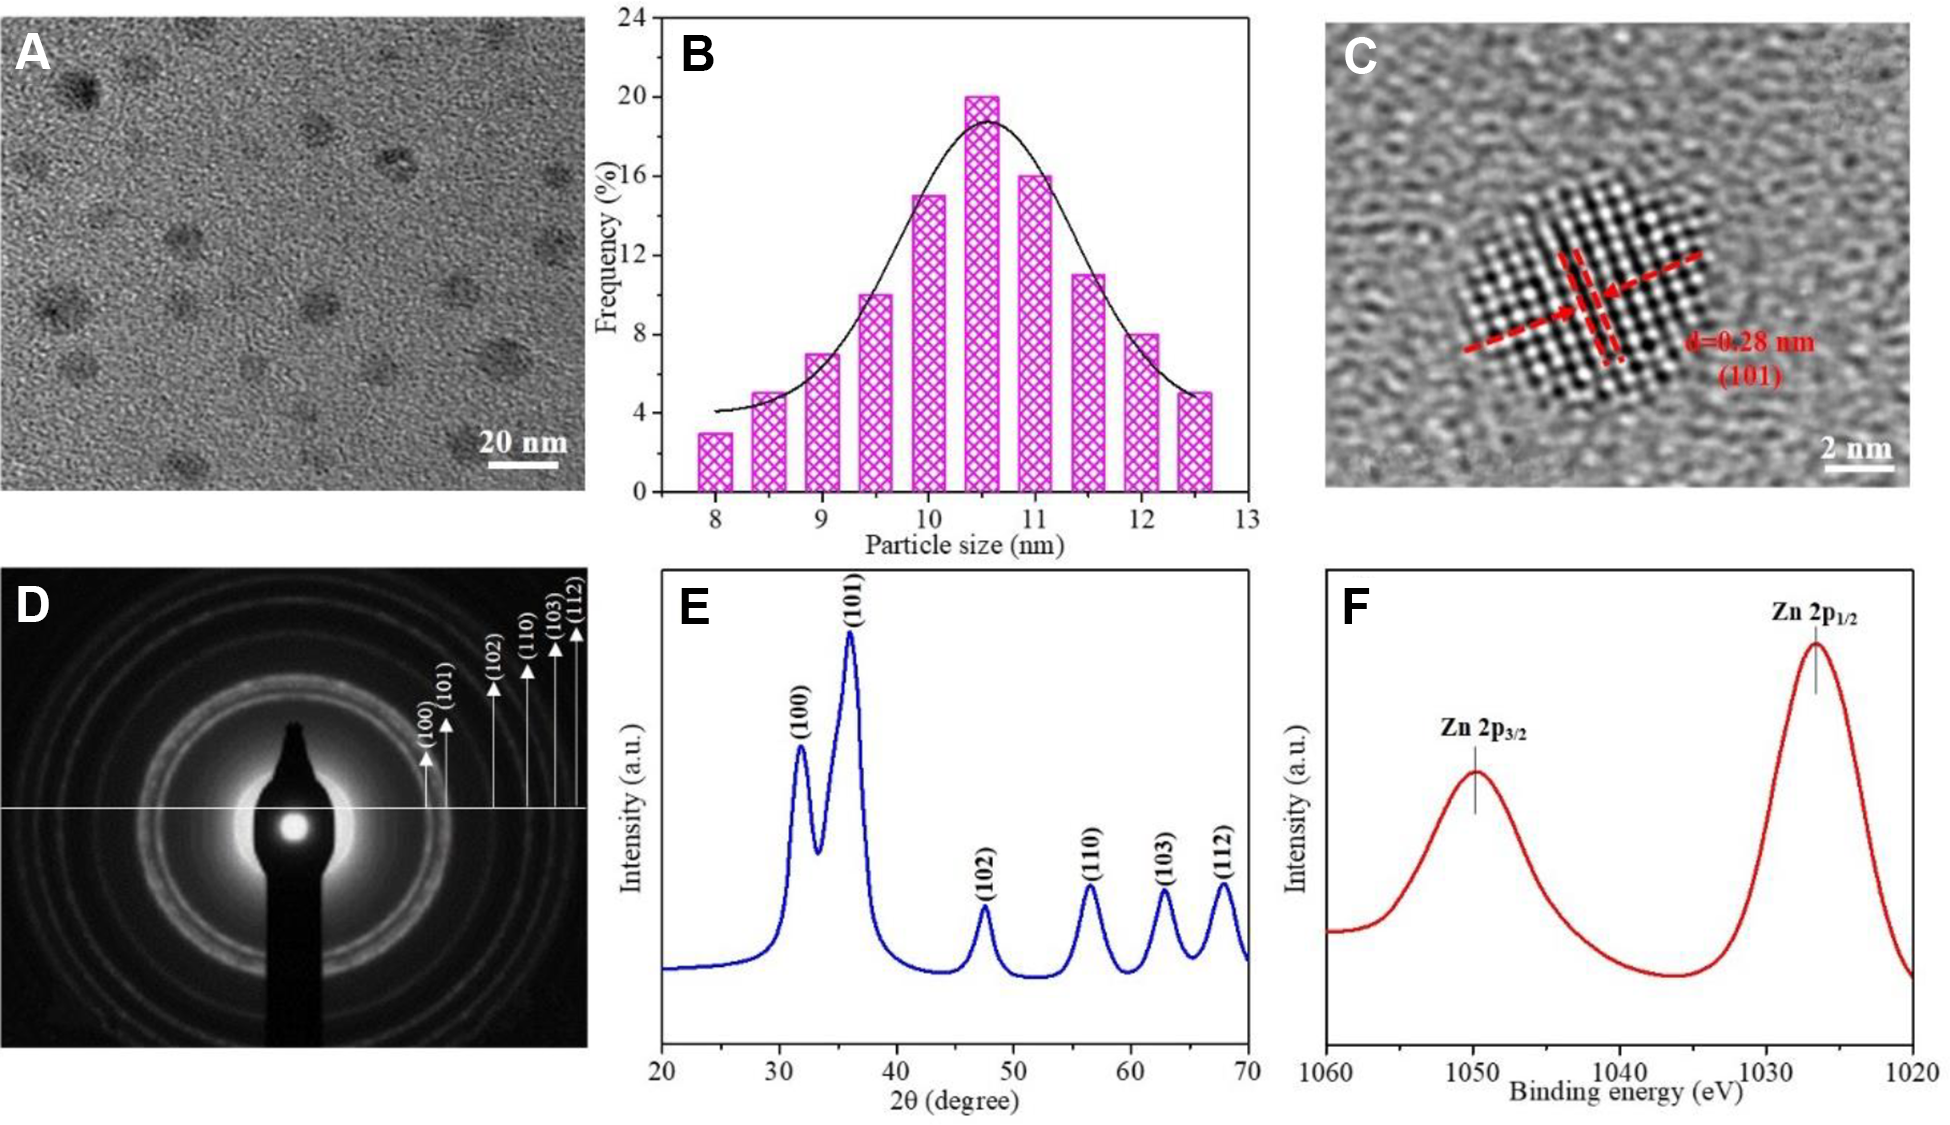
Characterization of ZnO quantum dots: (A) TEM image; (B) histogram for size distribution; (C) HREM; (D) TEM diffraction; (E) XRD patterns; (F) XPS spectrum.
where τ is the mean particle size, K is the shape factor (0.9), λ is the X-ray wavelength, β is the broadening at the half the maximum intensity, and θ is the Bragg angle. The size is calculated as 11.5 nm based on the peak of (101), which is close to the size calculated from Figure 2B. The surface chemical state could be studied by XPS, and the spectrum is presented in Figure 3F. The 2 peaks at 1049.3 and 1026.7 eV refer to Zn 2p3/2 and Zn 2p1/2, respectively.
Drug Release TestingFourier transform infrared spectrum of ZnO-ADH-Hep-PTX is presented in Figure 4A. As a reference, the spectrum for pure PTX is also displayed. The peak at 1756 cm−1 is attributed to the C=O stretching within PTX. This peak is presented in both PTX and ZnO-ADH-Hep-PTX, indicating that PTX is successfully introduced into the nanocomplex. Moreover, within the spectrum of ZnO-ADH-Hep-PTX, the peak at 1215 cm−1 could be attributed to −OH stretching from Hep, while the peak at 3410 cm−1 could be attributed to the vibration of N-H, a characteristic peak for amino group. These 2 peaks indicate that both Hep and ADH are successfully introduced into ZnO-ADH-Hep-PTX nanocomplex.

A, Fourier transform infrared spectrum spectra for paclitaxel (PTX) and ZnO-ADH-Hep-PTX. B, Fluorescence spectrum of PTX release of ZnO-ADH-Hep-PTX at pH of 7.4 in 6 hours (time interval: 1 hour. C, Fluorescence spectrum of PTX release of ZnO-ADH-Hep-PTX at pH of 5.0 in 6 hours (time interval: 1 hour). D, The release of PTX from ZnO-ADH-Hep-PTX at different pH in 80 hours.
To study the impacts of pH on the PTX drug release, ZnO-ADH-Hep-PTX complex is dialyzed under the environment with a pH of 5.0 and 7.4, which simulates the physiological environment of tumor cells and healthy cells environment. 42 The fluorescence emission spectrum is used to determine the concentration of PTX at different time intervals. As shown in Figure 4B, when pH is 7.4, the fluorescent intensity of PTX changes relatively small within 6 hours of dialysis. However, the fluorescent intensity of PTX increases dramatically within 6 hours when the pH is 5.0, as shown in Figure 4C. The PTX release from ZnO-ADH-Hep-PTX is systematically studied at a pH of 5.0 and 7.4 within 80 hours. It is observed that, when the pH is 5.0, 69.7% PTX is released within 80 hours. However, when the pH is 7.4, only 34.7% PTX is released within 82 hours. This could be attributed to the fact that a lower pH environment could dissolve ZnO QDs and dissociate the drug metal complex, which triggers a faster PTX release. 9
In Vitro Cytotoxicity TestingTo investigate the cytotoxicity of free PTX and ZnO-ADH-Hep-PTX, A549 cells are incubated with different concentrations of the samples, and the cell viability is presented in Figure 5A. The PTX loading percentage and the encapsulation efficiency are calculated as 5.8% and 38.9%, respectively. Figure 5A shows that a higher concentration of samples results in lower cell viability, and ZnO-ADH-Hep-PTX shows higher antitumor effects to A549 cells than free PTX. For example, after incubation for 48 hours, when the PTX concentration is 50 μg/mL, the cell viability is 58.3% and 40.1% for ZnO-ADH-Hep-PTX and free PTX, respectively. Moreover, the cell viability changes over 48 hours (PTX concentration: 100 μg/mL) are presented in Figure 5B. It can be seen that, after 8 hours, free PTX shows the higher antitumor effect than ZnO-ADH-Hep-PTX. This could be attributed that a large dose of PTX is released directly, while PTX release from ZnO-ADH-Hep-PTX is relatively slower. After 16 hours, the antitumor effect for both samples becomes similar. After 48 hours, the cell viability becomes 53.8% and 30.2% for free PTX and ZnO-ADH-Hep-PTX, respectively. This could be attributed to that, due to the strong interaction between ADH and PTX through the amine groups, the PTX within ZnO-ADH-Hep-PTX has a slower release rate, and the antitumor effect lasts longer time. The PTX is widely used for chemotherapeutic drugs for various tumors. However, it also results in severe side effects due to its nonspecificity and difficult concentration control. Therefore, a decreased drug release rate is beneficial to decrease the side effect of the higher concentration of PTX. According to the results presented in Figures 5A and B, ZnO-ADH-Hep-PTX could deliver PTX in a more controllable way, and ZnO-ADH-Hep-PTX has the potential to be a high-efficiency DDS for cancer treatment.

In vitro cytotoxicity experiment with A549 cells: (A) cell viability (mean ± SD) with different concentrations of paclitaxel (PTX) and ZnO-ADH-Hep-PTX for 48 hours; (B) cell viability (mean ± SD) at different times with free PTX and ZnO-ADH-Hep-PTX (PTX concentration: 100 μg/mL).
In Vivo Pharmacokinetic StudyThe pharmacokinetic study is conducted, and the plasma PTX concentration change over time is presented in Figure 6. According to Figure 6, within the time range of the study, the PTX concentration is higher when it is supplied by ZnO-ADH-Hep-PTX than PTX solution. Specifically, when PTX solution is injected, the concentration is 2.15 mg/L after 5 minutes; after 1 hour, the concentration becomes 0.19 mg/L; after 4 hours, the concentration could not be detected anymore. When ZnO-ADH-Hep-PTX solution is injected, the concentration is 7.51 mg/L after 5 minutes; after 1 hour, the concentration becomes 0.98 mg/L; after 12 hours, the concentration becomes undetectable. From the curves, it is concluded that ZnO-ADH-Hep-PTX nanocomplex could increase the retention time of PTX in vivo, which could be attributed to the interaction between PTX and the drug carrier of ZnO-ADH-Hep. This result is also in a great match with the result of the in vitro drug release. Finally, all the Wistar rats with the injection of ZnO-ADH-Hep-PTX are survived for more than 2 weeks after the pharmacokinetic study, indicating that the drug carrier is relatively biologically safe, while a longer time safety is not included in this study.

Mean plasma curve of concentration (mean ± SD) versus time for paclitaxel (PTX) in rats after injection of free PTX and ZnO-ADH-Hep-PTX.
Conclusions
Heparin was attached to ZnO QDs through the amino groups of ADH. The impacts of pH on the PTX drug release were studied by exposing ZnO-ADH-Hep-PTX under the pH of 5.0 and 7.4. The results indicated that a lower pH was beneficial to PTX release, which could be attributed to the dissolution of ZnO QDs. The cytotoxicity studies were conducted with A549 cells, and it showed that ZnO-ADH-Hep-PTX had a stronger antitumor effect than free PTX. The pharmacokinetic study was conducted with male Wistar rats. The PTX concentration within Wistar rats was higher with ZnO-ADH-Hep-PTX injection. Both in vitro and in vivo studies indicated that ZnO-ADH-Hep-PTX could deliver PTX in a more controllable way, and it has the potential to be a high-efficiency DDS for cancer treatment.
Footnotes
Declaration of Conflicting Interests
The author(s) declared no potential conflicts of interest with respect to the research, authorship, and/or publication of this article.
Funding
The author(s) received no financial support for the research, authorship, and/or publication of this article.