
Abstract
Objective
The present study aimed to investigate the dose differences and radiobiological assessment between Anisotropic Analytical Algorithm (AAA) and Acuros External Beam (AXB) with its 2 calculation models, namely, dose-to-water (AXB-Dw) and dose-to-medium (AXB-Dm), on esophageal carcinoma radiotherapy treatment plans.
Materials and methods
The AXB-Dw and AXB-Dm plans were generated by recalculating the initial 66 AAA plans using the AXB algorithm with the same monitor units and beam parameters as those in the original plan. The dosimetric and radiobiological assessment parameters were calculated for the planning target volume (PTV) and organs at risk (OARs). The gamma agreement for the PTV and the correlation between it and the volume of the air cavity and bone among the different algorithms were compared simultaneously. The dose discrepancy between the theoretical calculation and treatment planning system (TPS) when switching from AXB-Dm to AXB-Dw was analyzed according to the composition of the structures.
Results
The PTV dose of AXB-Dm plans was significantly smaller than that of the AAA and AXB-Dw plans (P < .05), except for D2. The difference values for AAA vs AXB-Dm (∆Dx,(AAA-AXB,Dm)) and AXB-Dw vs AXB-Dm (∆Dx,(AXB,Dw-AXB,Dm)) were 1.94% [1.27%, 2.64%] and 1.95% [1.56%, 2.27%], respectively. For the spinal cord and heart, there were obvious differences between the AAA vs AXB-Dm (spinal cord: 1.15%, heart: 2.89%) and AXB-Dw vs AXB-Dm (spinal cord: 1.88%, heart: 3.25%) plans. For the lung, the differences between AAA vs AXB-Dm and AAA vs AXB-Dw were significantly larger than those of AXB-Dm vs AXB-Dw. Compared to the case of AAA and AXB-Dw, the decrease in biologically effective dose (BED10,
Conclusions
The AAA and AXB-Dw algorithms overestimated the radiobiological parameters when the tumor particularly consisted of nonuniform tissues. A relatively small dose difference could cause a significant reduction in the corresponding TCP. Dose distribution algorithms should be carefully chosen by physicists and oncologists to improve tumor control, as well as to optimize OARs protection.
Keywords
Introduction
It is a challenge that radiation therapy dose was calculated in the thorax region, on account of incorporating large heterogeneity tissues including lung, bone, air, muscle and adipose tissue. Esophageal carcinoma (EC) is one of the most common malignant tumors in the thorax region, radiation therapy plays a crucial role in the treatment of EC, which can remarkably reduce cardiopulmonary morbidity or total mortality.1,2 The accuracy of the EC treatment dose calculation can be extraordinary challenging due to the presence of high-density bone structures and low-density lung tissue surrounding tumors.
The Analytical Anisotropic Algorithm (AAA) which improved accuracy compared to the previous pencil beam Algorithm has been now routinely available in the Eclipse treatment planning system.3,4 Nevertheless, numbers of researches confirmed that AAA has been significantly overestimated by the dose near air and lung tissue interfaces. 5 A novel dose calculation algorithm Acuros External Beam (AXB) is introduced to address limitations of AAA in heterogeneous regions. 6 It is seen that the dose calculation areas with artefact generated heterogeneity leads to higher dose deviations. According to previous studies,7-11 it is sufficient to show that the accuracy of AXB almost agree with that of Monte Carlo simulation, both for heterogeneous phantom and clinical cases. And it exhibits more accuracy than AAA, especially in heterogeneous media.6,12-14 Acuros External Beam has 2 calculation models: dose-to-water (AXB-Dw) and dose-to-medium (AXB-Dm). The AXB-Dw has been widely used in conventional radiotherapy, its energy dependent fluence-to-dose response functions are based on homogeneous water. 15 Nevertheless, the AXB-Dm are based on heterogeneous material, for instance, air, lung, bone, etc. AXB-Dm can be rescaled to AXB-Dw using the stopping-power ratio of water-to-medium. It is a highly debatable point that which mode is chosen optimally for clinical treatment.16-19 Some researchers contend that the difference between 2 models was small in most of organs, except for bone, the discrepancy can reach to about 15%. 20 Liu, H.H 16 and Walters, B.R 21 demonstrated that compared to the AXB-Dm, AXB-Dw could provide a better evaluation of the dose to sensitive tissue in the bone. Some researchers clarified that the largest dosimetric differences always occurred in the highest density region, where AXB-Dw predicted higher dose values than AXB-Dm.4,20
The EC located in the thorax region, including an abundant low-density tissue (i.e., air) and high-density tissue (i.e., bone), consequently generating 3 nonuniformity interfaces: air-tissue, air-bone and tissue-bone. The electronic disequilibrium and dose perturbations will be happened when radiation beams passing through these 3 heterogeneous interfaces. 22 The differences between AAA and AXB in esophageal carcinoma were explored by some researchers.23,24 However, all of them only assessed the dose differences between AAA and AXB-Dm, without consisting of AXB-Dw in their relevant literature, and the cohort used in their study was small. Thus, the primary aim of our research is to ascertain the dose differences and radiobiological assessment between the Eclipse treatment plan system version 15.6 of AAA and AXB, with its 2 dose reporting modes AXB-Dw and AXB-Dm. Because the accuracy of AXB calculations is affected by the structure to be calculated (bone, metal, etc.). The secondary aim is to compare the correlation between the gamma agreement and the volume of the cavity (Vcavity) and bone structures (Vbone). And finally, we examine the feasibility of switching from AXB-Dm to AXB-Dw and the impact of dose inhomogeneity of AAA and AXB on BED of tumor. This was the first large-scale study proposing a radiobiological approach for the choice among AAA, AXB-Dw, and AXB-Dm. These results can provide guidance for selecting appropriate algorithms for Eclipse TPS in esophageal cancer clinical planning.
Methods
Patient Selection and Treatment Planning
Patient details in this study.

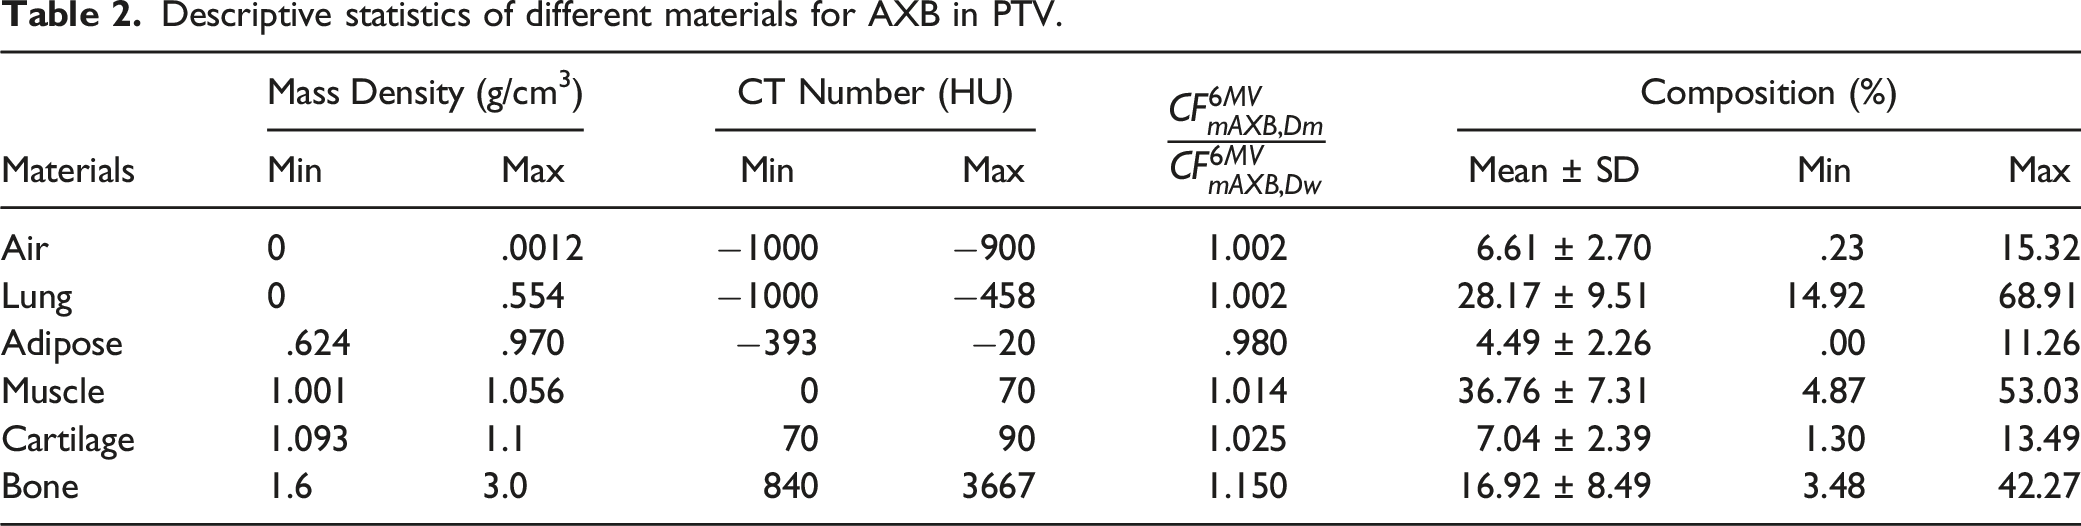
The material table was established based on the scan of standard CT phantom (Model 467, Tissue Characterization Phantom, Gammex Inc, USA) and the mass density table was supplied by manufacturer. The treatment plans for each patient were initially optimized using the Eclipse TPS AAA algorithm (version 15.6.8, Varian Medical Systems, Palo Alto, CA, USA), and for clinical acceptability, at least 95% of the PTV received a prescription dose of 50.4 Gy in 28 fractions. The AXB-Dw and AXB-Dm plans were generated by recalculating the final AAA plan for identical monitor units and beam parameters as in the corresponding AAA plan. The calculation grid was set to 2.5 mm for all cases.
Dosimetric Evaluation and Data Analysis
To evaluate the dosimetric and radiobiological parameters, cumulative dose-volume histograms (DVHs) were acquired using the Varian TPS for each plan. Dosimetric parameters such as volume, Dmean, D98, D95, D50, and D2 for PTV were analyzed, where Dmean, D98, D50, and D2 represent the dose to mean, 98, 95, 50%, and 2% volume for the PTV, respectively. Additionally, OAR dose metrics including the volume, Dmean, D2, and a set of Vx%, which were the volume of the organ receiving x% or more of the prescription dose, were recorded. The variances of dose
The equivalent uniform dose (EUD) was explained as the homogeneous dose that caused the same biological effect if heterogeneity was distributed over the entire volume of the structure. In the EUD model first proposed by Niemierko,
25
the logistic function25,26 was given as follows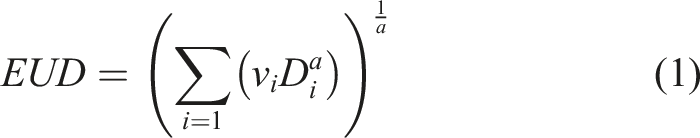
Tumor control probability (TCP) was calculated using the LQ model, and TCP was used to evaluate the tumor control effect with different algorithms. Tumor control probability could be defined as
26

The gamma agreements for PTV among the AAA, AXB-Dw, and AXB-Dm plans at the criteria of 3%/3 mm and 2%/2 mm were calculated using the open-source program CERR.
29
In this study, we divided the patients into 3 groups: AAA vs AXB-Dw, AAA vs AXB-Dm, and AXB-Dw vs AXB-Dm.
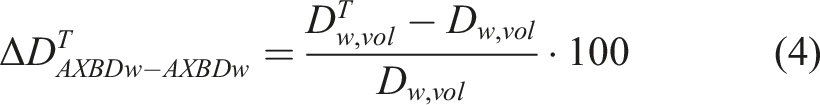
Composition-Related Dose Differences Between AXB-Dw to AXB-Dm
To investigate the discrepancy between AXB-Dw and AXB-Dm and their interpatient variability, we employed a method based on the composition of the structures, an expression and its associated rationality of converting Dm to Dw for a 6-MV photon beam when using Acuros XB fitted with the work of Jurado-Bruggeman et al
30
The author proposed a new dose quantity called “dose-to-water-like medium,” which could yield a non-uniform dose distribution because of its heterogeneous composition. Instead of calculating the dose distribution from scratch following the considerations, a more straightforward approach was to apply a correction factor (CF) to each voxel. This CF depended on the medium atomic composition, beam spectrum, and the dose reporting mode of the original dose distribution, which were illustrated in
30
for converting a volume medium into water
Descriptive statistics of different materials for AXB in PTV.
Results
Dosimetric Comparison
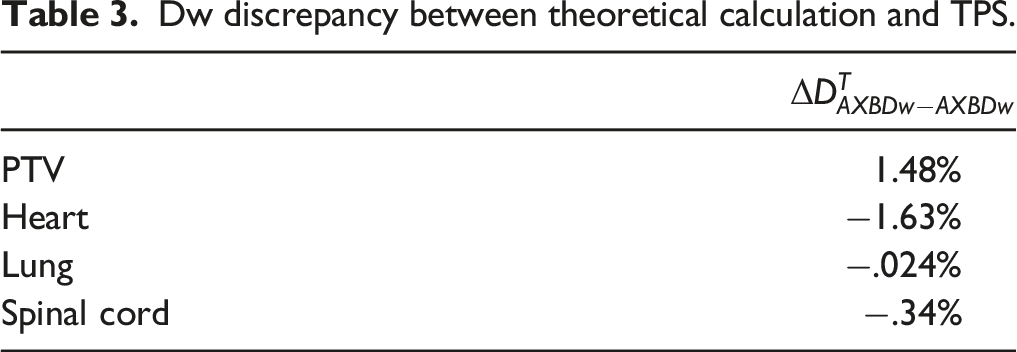
The dosimetric plan parameter comparisons were depicted in Figure 1 (a) to (e). The PTV dose of AXB-Dm plans was significantly smaller than that of the AAA and AXB-Dw plans (P<.05), except for D2. Table 3 showed the difference values for Comparison of AAA, AXB-Dw, and AXB-Dm plans regarding dosimetric parameters for PTV (a–e) and OARs (f–l). Every point represented a plan parameter for one of 66 patients. The major diagonal showed the equal value of three types of algorithms. Dw discrepancy between theoretical calculation and TPS.
For the spinal cord and heart (Figure 1 (f, k, l)), there was an obvious difference between the AAA vs AXB-Dm plans (spinal cord: 1.15%, heart: 2.89%) and the AXB-Dw vs AXB-Dm plans (spinal cord: 1.88%, heart: 3.25%). The difference was not statistically significant because the value of p was greater than .05. For the lung (Figure 1 (g) to (j)), the differences between the AAA vs AXB-Dm plans and the AAA vs AXB-Dw plans were significantly larger than those between AXB-Dm vs AXB-Dw (i.e., the former 2 V10(%)
As shown in Figure 2, the BED10 ( Relationship between BED10 (Gy) and variance of target dose for all patients.
EUD and TCP Analysis
Figure 3 showed the EUD results for PTV in the AAA, AXB-Dw, and AXB-Dm plans. The average values of EUD in the AAA, AXB-Dw, and AXB-Dm plans were 52.03 ± .39 Gy, 52.24 ± .81 Gy, and 51.13±.47 Gy, respectively. It was obviously observed that the mean EUD values in the AXB-Dm plans were always lower than those in the AXB-Dw and AAA plans, except for some patients. The mean value of EUD for the AAA plan was less than that in the AXB-Dw plan with an average difference of .4%, and the mean value of EUD in the AXB-Dm plan was lower than that of AAA by 1.73%, simultaneously showing a difference of greater than 2.13% of the AXB-Dw plans. Comparison AAA, AXB-Dw, and AXB-Dm plans regarding EUD parameter of target. Every point represented a plan parameter for one of 66 patients. The major diagonal showed the equal value of three types of algorithms.
Figure 4 showed the TCP results for PTV in the AAA, AXB-Dw, and AXB-Dm plans, which were 62.29 ± 1.57%, 62.82 ± 1.69%, and 58.68 ± 1.88%, respectively. In comparison to the AAA plan, the AXB-Dw plan showed an increment in TCP by an average difference of .84%, whereas the AXB-Dm plan consistently showed a reduction by an average difference of 5.8%. It appeared that the greatest difference between the 3 different algorithms was between the AXB-Dw and AXB-Dm plans, while the difference between the AXB-Dm and AXB-Dw plan was in excess of 6.59%. Comparison AAA, AXB-Dw, and AXB-Dm plans regarding TCP parameter of target. Every point represented a plan parameter for one of 66 patients. The major diagonal showed the equal value of three types of algorithms.
Gamma Index
Figure 5 summarized the gamma agreement in the PTV according to the AAA, AXB-Dw, and AXB-Dm plans. Dose difference and distance-to-agreement were selected as 2 acceptance criteria 3%/3 mm and 2%/2 mm. With the 2%/2 mm acceptance criteria, the mean value of Gamma passing rates for PTV among three algorithms under the criteria of 2%/2 mm and 3%/3 mm.
We also investigated the correlation between the gamma agreement and the volume of the air cavity and bone, with 2 acceptance criteria of 3%/3 mm and 2%/2 mm. Figure 5 (a) to (j) showed scatter plots with fitted curves for the gamma agreement using the AAA, AXB-Dw, and AXB-Dm plans vs Vcavity and Vbone. Regardless of whether the criteria were 3%/3 mm or 2%/2 mm, the
Composition-Related Dose Differences Between AXB-Dw to AXB-Dm
Plan parameters comparison of PTV and OARs in the esophageal cancer treatment plans based on three algorithms.

Discussion
It is challenging to select an appropriate dose calculation algorithm, especially when a photon beam travels through a heterogeneous medium. 14 Acuros External Beam dose calculation algorithms agree very well with the Monte Carlo dose calculation algorithm, even in heterogeneous media. 32 In this study, we compared 3 dose calculation algorithms, namely, AAA, AXB-Dw, and AXB-Dm, which were used to calculate dose distributions in esophageal carcinoma treatment plans. The air cavity was widely presented in the esophagus, trachea, and bronchus; meanwhile, the margin of the GTV may be generated in a region of overlap among the PTV, air cavity, and low-density lung tissue. Generally, the AAA estimated a higher dose to the air cavity and lung tissue within the PTV than AXB-Dm. 33 Therefore, for the Dmean, D98, D95, and D50 of the PTV, the majority of the AXB-Dm plans were significantly smaller than the AAA plans, which was in accordance with the findings of similar previous studies.34-36 For D95 and D98, the difference was up to 2.64% and 2.49%, respectively. For AXB-Dw, there was no clear trend; this result was consistent with that of another study. 37 Sayah 4 considered that the difference in D2% was dependent on the percentage of a high-density material in the PTV, where the AXB-Dw plans predicted higher dose values than the AAA plans. This may clarify our results. Overall, AAA and AXB-Dw, which were commonly used in clinical practice, overestimated the PTV dose compared to AXB-Dm (see Figure 1 (a) to (e) and Table 3).
For the spinal cord and heart, there were obvious differences between the AAA vs AXB-Dm plans (spinal cord: 1.15%, heart: 2.89%) and the AXB-Dw vs AXB-Dm plans (spinal cord: 1.88%, heart: 3.25%). According to the results obtained above, the in vivo dose of irradiated patients was less than the nominal prescription dose when AAA and AXB-Dw were used to calculate the dose distribution. This was well for OARs but not for tumors. For the lung, the dose parameters of AAA were significantly larger than those of AXB-Dm and AXB-Dw (i.e., the former 2 V10(%)
In this study, the effect of dose inhomogeneity of AAA and AXB on the BED of tumors was also discussed. As shown in Figure 2, BED10
According to our results, the mean EUD values in the AXB-Dm plans were always lower than those in the AXB-Dw and AAA plans. The difference values of AXB-Dw and AXB-Dm plans were −.4% and 1.73%, respectively, compared to that in the AAA plans. Simultaneously, the AXB-Dw plans showed a difference greater than 2.13% from the AXB-Dm plans (see Figure 6). Suresh Rana’s
23
publication indicated that for the PTV, the EUD difference values between the AXB and AAA plans had an average of 1.3%. However, the dose of AXB, which was calculated based on dose-to-water or dose-to-medium, was not determined in their work. Significantly, which algorithm (i.e., dose-to-water or dose-to-medium) needed to be applies in clinical practice was very important. (a)–(f) scatter plots with fitted curves for gamma passing rates at the criteria of 2%/2 mm and 3%/3 mm and volume of cavity for 
The differences in dose to PTV calculated using the AXB-Dw and AXB-Dm algorithms resulted in a TCP percentage difference of up to 6.59%. In comparison to the AAA plans, the AXB-Dw plans showed an increase in TCP by an average difference of .84%, whereas the AXB-Dm plans consistently showed a reduction by an average difference of 5.8%. Padmanaban et al
24
predicted a reduction of 3% [1.1%, 4.5%] from AAA to AXB-Dm. Their conclusion was less than that of our study (3 vs 5.8%); the most likely reason was that only 10 patients were analyzed in their study. The cohort used in this study was large (n=66). This was the first large-scale study proposing a radiobiological approach for the selection of AAA, AXB-Dw, and AXB-Dm. Our results indicated that a relatively small dose difference (i.e.,
In this study, the gamma agreements for PTV in AAA, AXB-Dw, and AXB-Dm were analyzed. With the 3%/3 mm acceptance criteria, the mean values of
We also investigated the correlation between the gamma agreement and the volume of the air cavity and bone. Regardless of whether the criteria were 3%/3 mm or 2%/2 mm, the
Verification of theoretical dose differences between AXB-Dw from DVH parameters and AXB-Dw switching from AXB-Dm using a theoretical formula was performed. The differences between the theoretical calculation and clinically obtained values were approximately 1.63% because of the complex composition of PTV and heart, while the values of other structures were less than .34%. This implies that, with the more complex the structure, the larger was the deviation. The method proposed in this paper was a valuable tool for allowing approximate mass conversion of dose distributions in medium to doses in water using the theoretical equation without recalculation. Although the differences found in our study might be over the threshold of clinical acceptance for some patients, it could provide a theoretical reference when an algorithm was chosen. For example, if the composition of a tumor was complex and some larger density or CT number tissues were included, then the algorithms should be selected carefully because of the large difference. The higher proportion of bone and enhanced organs showed a difference of up to 1.63% between AXB-Dm and AXB-Dw, which could have a clinical effect. Based on these findings, physicists and oncologists can choose a suitable algorithm mode to meet the clinical requirements for convenience.
Conclusion
The AAA and AXB-Dw algorithms overestimated the radiobiological parameters when the tumor consisted of nonuniform tissues. To some degree, the theoretical method could help to better assess the predictive accuracy of Dw vs Dm for radiobiological parameters. Our results indicated that a relatively small dose difference (i.e., 2%) could cause a significant reduction in the corresponding TCP (i.e., 6.59%). Dose distribution algorithms should be carefully chosen by physicists and oncologists to improve tumor control as well as to optimize OAR protection.
Limitation
The potential limitation of this study was the lack of the true value of 3D dose distribution calculated by Monte Carlo simulation. The reason for this was that only Eclipse TPS, in which no MC algorithm was installed, was equipped in our center. And the code of MC simulation such as EGSnrc/BEAMnrc was quite hard, it involved the modelling of linear accelerator structure and coding and so on. Acuros External Beam ’s accuracy may not be comprehensively evaluated in our paper. But the accuracy of AXB had been verified by lots of researches, it does not affect the comparison of radiobiology evaluation for esophageal carcinoma between the version 15.6 of AAA and AXB. It also could provide guidance for selecting appropriate algorithms for Eclipse TPS in esophageal cancer clinical planning. We will try our best to perform the true value of 3D dose calculations using the MC simulation code such as EGSnrc in our next future work.
Footnotes
Author Contributions
Lin Wang, Jianping Zhang and Miaoyun Huang designed the treatment plans, and collected and analyzed the data.
Benhua Xu and Xiaobo Li provided clinical expertise and supervision of the project.
Lin Wang drafted the manuscript and all co-authors revised and approved the final manuscript.
Declaration of Conflicting Interests
The author(s) declared no potential conflicts of interest with respect to the research, authorship, and/or publication of this article.
Funding
The author(s) received no financial support for the research, authorship, and/or publication of this article.
Appendix
(a), (b) dose gamma agreement map of AAA vs. AXB-Dw and AAA vs. AX-Dm at 2%/2 mm criteria, respectively. (c), (d) dose gamma agreement map of AAA vs. AXB-Dw and AAA vs. AX-Dm at 3%/3 mm criteria, respectively. The difference mainly appeared in the large density or CT value tissues.