
Abstract
Objective:
To extract the computed tomography (CT) imaging features of the primary lesions in patients with advanced esophageal squamous cell carcinoma (ESCC) and to study whether these imaging features can predict the short-term outcome after concurrent chemoradiotherapy (CCRT).
Methods:
From January 2014 to December 2015, a total of 49 patients with locally advanced ESCC who underwent CCRT were analyzed retrospectively. They were randomly categorized into the training and validation groups. Collection of CT imaging of patients before and intermediate stage undergoing radiotherapy. The correlations between imaging characteristics and short-term outcome were analyzed. The accuracy of cutoff value was verified by imaging characteristics of patients in validation group.
Result:
There were 38 patients in the training group and 11 patients in the validation group. 13 patients in the training group were classified as responders and 25 patients as nonresponders. According to the CT imaging before radiotherapy, there are no significant differences between responders and nonresponders. According to the CT imaging in the middle stage of radiotherapy, responders showed significantly higher Roundness than nonresponders (P = .004, 95% confidence interval [CI] = 0.0419-0.212). The areas under the ROC curves for the ability to predict significantly tumor response were 0.768 for Roundness (P = .001, 95% CI = 0.603-0.889). The cutoff value of Roundness is 0.3099. Roundness showed no significant associations with survival parameters.
Conclusions:
Computed tomography imaging in the middle stage of radiotherapy can predict the short-term outcome of concurrent chemoradiotherapy for patients with locally advanced ESCC but have no predictive effect on the total survival time.
Introduction
China is one of the countries with a high incidence of esophageal cancer, and it has the highest number of patients with esophageal cancer in the world. 1 Although surgical resection provides a chance of cure, 80% of patients with esophageal cancer have unresectable disease at the time of diagnosis, will need radiotherapy and chemotherapy. Radiotherapy is an important treatment for patients with advanced esophageal cancer. 2 In clinical practice, the sensitivity to radiotherapy and chemotherapy or prognosis of patients vary even in patients with the same stage of disease, with the same pathological type and after the same treatment methods. Using effective imaging and biological indicators may help clinicians to formulate individualized treatment strategies to improve the survival of patients with esophageal squamous cell carcinoma (ESCC).
Radiomics has emerged as a promising approach in the discovery of quantitative imaging biomarkers in patients with cancers. 3 The basic principle of radiomics is that by extracting a large number of hypothetical imaging features, we can obtain a more comprehensive description of potential tumor phenotypes, which may be associated with clinical outcomes. Computed tomography (CT) imaging analysis is a potential independent biomarker of malignancy. This approach has been used to predict the overall survival in patients with lung cancer using widely available imaging techniques. 4,5 Imaging analysis reflects the heterogeneity of a tumor, 6 -10 which manifests as cell infiltration, abnormal vascular proliferation, fine structure, and necrosis. 11 -13 Studies have shown that certain imaging features are associated with tumor glycometabolism and grading, 14 as well as with hypoxia and angiogenesis. 9 Multiple studies have reported that metabolic tumor volume is a prognostic factor in patients with non-small cell lung cancer. 15 -17 In this clinical study, we investigated whether CT imaging can be used to predict treatment response after concurrent chemoradiotherapy (CCRT) in patients with advanced ESCC.
Materials and Methods
Study Population
The patients with locally advanced ESCC were eligible for this study between January 2014 and October 2015. All patients met the following inclusion criteria: (1) Locally advanced ESCC confirmed by pathology diagnosis, (2) Karnofsky performance status ≥70, and (3) had measurable primary tumors according to the Response Evaluation Criteria in Solid Tumors (RECIST version 1.1). Patients treated with any surgical resection were excluded.
Treatment and Response Assessment
Patients were treated with CCRT. Radiation therapy was delivered using intensity-modulated radiotherapy or 3-dimensional conformal radiation therapy. Treatment was administered using a conventionally fractionated regimen of 1.8 to 2.0 Gy for 5 days a week. The total dose administered to patients ranged from 56 to 66 Gy (median, 60 Gy). At least 1 month after completion of the treatment, patients were reassessed to determine response to therapy using the CT. Computed tomography imaging analysis of patients at simulation before radiotherapy, mid-radiotherapy, and after radiotherapy were collected, respectively.
Imaging Analysis
Computed tomography imaging before and in the middle stage of radiotherapy were analyzed, respectively. A total of 76 quantitative features including morphologic features, statistical features, histogram-related features, and imaging features were calculated from CT texture of each patient. These imaging features may provide a more comprehensive characterization of the underlying tumor phenotypes. We investigated 3 types of imaging features on the basis of gray-level co-occurrence matrices, 18 wavelet decompositions, 19 and Laws features. 20 To meaningfully characterize tumors, all imaging features were further processed to be rotationally invariant (without preference to any particular spatial direction). The calculation of all imaging features was performed using IBEX software. This software runs on a Windows-based personal computer and can analyze imaging in the digital imaging and communications in medicine format (the most commonly used file format in medical imaging and radiology practice). The IBEX software can be integrated with a picture archiving and communication system or run as standalone imaging analysis software.
For a gray-level co-occurrence matrix with size Ng × Ng, it describes the second-order joint probability function of an imaging region and is defined as
Ng be the number of discrete gray level within imaging.


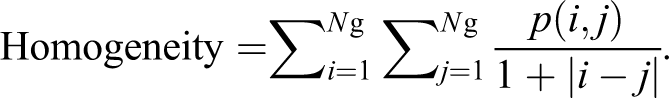
Entropy reflects irregularity in the gray-level co-occurrence matrix, and a completely random distribution would have very high entropy. Dissimilarity is a measure that defines the variation of gray-level pairs in an imaging. Homogeneity measures the uniformity of the gray-level co-occurrence matrix. Max3D Diameter: Largest pairwise Euclidean distance between voxels on the surface of the tumor volume. Roundness represents the ratio of the surface area of a sphere of the same volume as an object to the surface area of an object.
Response Evaluation
Patients were reassessed for treatment response by CT imaging at 1 month after completion of the treatment. Tumor response was subsequently classified as complete response (CR), partial response (PR), stable disease (SD), or progressive disease (PD) according to the RECIST (version 1.1). Patients with CR or PR were considered as responders, and patients with SD or PD as nonresponders.
Statistical Analysis
χ2 test was used to test the significance of the primary tumor and lymph node status and the stage with the treatment response. The correlation between imaging characteristics and short-term outcome was analyzed by t test, and receiver operating characteristic (ROC) curve was used to evaluate the predictive ability of imaging characteristics and the determination of cutoff value. The accuracy of cutoff value was verified by imaging characteristics of patients in the validation group. The correlation with survival time was evaluated by Kaplan–Meier analysis.
A value of P < .05 was considered as statistically significant and all P values presented are 2-sided. The statistical analyses were performed using the MedCalc Statistical Software and GraphPad Prism Statistical Software.
Results
Patient and Tumor Characteristics
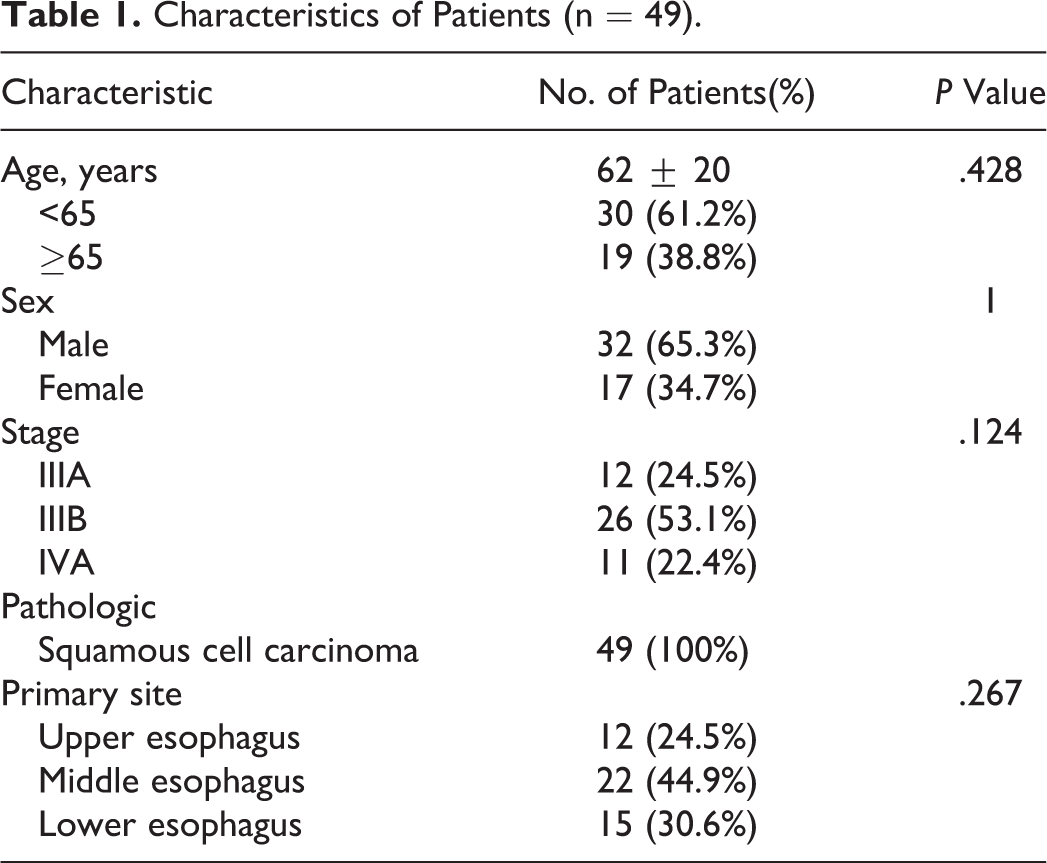
Forty-nine patients (32 males, 17 females; range, 49-86 years) were eligible for the analysis. All tumors were squamous cell carcinoma. Most of them originated from the middle and lower esophagus (76%). All patients were diagnosed with locally advanced ESCC (Table 1).
Characteristics of Patients (n = 49).
A total of 76 imaging group features were extracted, including 18 size and shape features, 18 histogram intensity features, and 40 texture features (Table 2). Firstly, the 76 imaging features were extracted, and then t test was used to analyze the correlation between imaging features and short-term curative effect. Finally, only 1 imaging feature was included in the follow-up analysis.
Detailed Imaging Features.

Tumor Response Prediction
Forty-nine patients were randomly assigned, including 38 patients in the training group and 11 patients in the validation group. In the training group, there were 13 responders and 25 nonresponders. Univariate analysis of the relationship between clinicopathological factors and short-term outcome. Neither tumor status (P = .122) nor radiotherapy dose (P = 0.112) reached statistical significance with tumor response (Table 3).
Characteristics of Patients in the Experimental Group (n = 38).

The CT imaging characteristics were changed in different degrees before and after radiotherapy. The imaging characteristics of radiotherapy localization were analyzed. The correlation between imaging characteristics and short-term outcome was analyzed by t test, the results showed that there was no significant difference between responders and nonresponders (P = .208). Computed tomography imaging in the middle stage of radiotherapy were analyzed, the results showed that there was a significant difference in Roundness of imaging features between responders and nonresponders (P = .004). Comparison of Roundness between responders and nonresponders was shown in Figure 1.

Distribution of Roundness between responders and nonresponders. A, Distribution of Roundness values during radiotherapy localization. Group 1 was the responders, and group 2 was the nonresponders. B, Distribution of Roundness values in the middle stage of radiotherapy. Group 1 was the responders, and group 2 was the nonresponders.
The average value of Roundness in the responders and nonresponders were 0.34 and 0.28 in radiotherapy localization. The average sphericity of responders and nonresponders were 0.39 and 0.27 in the middle stage of radiotherapy. Other imaging characteristics are shown in Tables 4 and 5.
Comparison of CT Imaging Between Responders and Nonresponders During Radiotherapy Localization.

Abbreviation: CT, computed tomography.
Comparison of CT Imaging Between Responders and Nonresponders in the Middle Stage of Radiotherapy.

Abbreviation: CT, computed tomography.
The areas under the ROC curves for the ability to predict significantly tumor response were 0.768 for Roundness (P = .001, 95% confidence interval = 0.603-0.889). Other imaging characteristics are shown in Table 6. The cutoff value of Roundness is 0.3099. If the value of Roundness is greater than 0.3099, then the patient is responder.
Areas Under ROC Curves for Ability of CT Imaging in the Middle Stage of Radiotherapy to Predict Response in Patients.

Abbreviations: CT, computed tomography; ROC, receiver operating characteristic.
All 11 patients in the validation group received CT imaging examination before and 3 months after the treatment. Tumor response was subsequently classified as CR, PR, SD, or PD according to the RECIST version 1.1. Patients with CR or PR were considered as responders, and patients with SD or PD as nonresponders. According to the RECIST version 1.1, there were 5 responders and 6 nonresponders, but according to the cutoff value of Roundness, there were 4 responders and 7 nonresponders. The validation group of 10 patients according to the cutoff value of Roundness was consistent with the grouping based on the RECIST version 1.1. One patient is an exception, this patient is well treated, but the value of Roundness is less than 0.309. The therapeutic effect of this patient is shown in Figure 2. The roundness value distribution of responders and nonresponders is shown in Figure 3.

Computed tomography imaging of this patient before treatment (A) and after treatment (B).

Distribution of Roundness values in responders (A) and nonresponders (B).
Survival Prediction
No differences are demonstrated in parameters. Kaplan–Meier survival curves of the overall survival (OS) demonstrate no differences in patients with high and low Roundness (OS, P = .6141). Roundness showed no significant associations with survival parameters (Figure 4).

Survival analysis of Roundness in patients.
Discussion
In this study, ROC curve is used to find the cutoff value. According to the previously published literature and opinions of related statisticians, there are 2 common methods: One is screening through ROC curve, and the other is screening through Cox regression, and which one is more suitable? There still exists argument. Comparing these 2 methods, the ROC curve combines sensitivity and specificity with graphic methods and retains small differences in parameters between different patients, a feature which is a comprehensive representative of the accuracy of the test. While Cox regression analysis incorporates numerical variables, so it poses a risk of quantifying qualitative data and may indirectly reduce the effectiveness of the screening. As the ROC curve retains small differences in parameters between different patients, we selected it as our primary screening method.
The next question is the choice of critical point in imaging analysis: Should it be the dividing value of the ROC or the median? In order to distinguish the patient from the parameters of imaging analysis, the determination of the critical point is important. In this process, 2 methods are available for reference: One is the dividing value of ROC and the other is the median value of the imaging parameters. If the median grouping method is adopted, it will only represent the medium level of the data and will not represent the whole status. This may result in the significant reduction or even disappearance of the meaning of the population screening. According to our results, the differences between the 2 studies will be more significant when grouped by the dividing value. Therefore, we suggest the following recommendations: If the median grouping method fails to achieve effective differentiation among patients based on actual clinical outcomes, the dividing value of ROC should be considered as the basis.
The imaging features in this study are sphericity, which reflects the shape of the tumor. Computed tomography imaging can quantitatively analyze the characteristics of tumor tissue, and the volume and surface area of tumor can be calculated by extracting the shape features. From the ratio of surface area to volume (surface area/volume), it can be seen that when the volume is constant, the surface area of the sphere shape is the smallest, the edge has the shape of protuberance or burr, and its surface area increases. For example, the burr sign of the tumor is a manifestation of tumor invasion and growth, and the prognosis is usually poor. 21,22 Other studies have confirmed that volume and maximum surface distance can be used to compare stability and accuracy. 23,24 Kidd et al found that 4 image features (energy, contrast, entropy, and average degree) can be used to predict the efficacy of patients. 25 The effectiveness of each imaging feature is different, and the significance of each imaging feature is also different.
However, despite intensive investigation of these and other imaging metrics, the predictive value of these metrics to allow accurate discrimination between different risk groups appears to be limited. More sophisticated tools that improve on existing imaging metrics are needed. Some scholars extracted 219 image features from 2 sets of CT imaging scanned repeatedly at intervals of 15 minutes, and their repeatability was evaluated by intragroup correlation coefficient. The results show that only 30% (66) of the features are repetitive, and most of the image features are unstable. 26
The significance of this study is that the sensitivity of patients to radiotherapy can be evaluated according to the CT imaging in the middle stage of radiotherapy, to increase or decrease the radiotherapy dose. In the recovery radiotherapy, roundness has some predicted effects on the partial result to the late period of esophageal cancer, but it has no predicted effect on the total lifetime. Computed tomography imaging has some significant meanings to the radiotherapy to the late period of esophageal cancer. The results of this study need to be further verified using a multicenter prospective study and by including more imaging parameters, mathematical modeling, and machine learning to guide clinical treatment decisions.
Conclusions
Computed tomography imaging in the middle stage of radiotherapy can predict the short-term outcome of CCRT for patients with locally advanced ESCC but have no predictive effect on the total survival time.
Footnotes
Acknowledgements
The authors would like to thank Ms Feng-Ming (Spring) Kong for excellent assistance.
Author contribution
Xiaolan Cao and Xindi Li have contributed equally to this work.
Declaration of Conflicting Interests
The author(s) declared no potential conflicts of interest with respect to the research, authorship, and/or publication of this article.
Funding
The author(s) disclosed receipt of the following financial support for the research, authorship, and/or publication of this article: This work was supported by the Key R&D projects in Shandong Province [grant number 2017GSF2018044].