
Abstract
While China has been experiencing unprecedented economic growth, depression is becoming one of the most striking social and mental health problems in recent years. Such a paradox to progress may partially be due to the notoriously poor air quality of the country. To verify this argument, we constructed an index of the prevalence of depression (IPD) using internet search query volumes in Baidu to proxy the potential depression and examined how IPD is associated with PM2.5, the major air pollutant in China. Our results from 2-way fixed effects models reveal that a 100 μg·m−3 increase in previous week’s PM2.5 in a city is significantly associated with 0.279 increase in its IPD, comparable to 7.34 hours decrease in weekly daylight, and such relationship is particularly pronounced in the spring and summer and in East and South areas. Our findings of large-scale pattern suggest that PM2.5 at current levels in China poses serious mental health risks.
Air pollution, as an environmental hazard, imposes a variety of adverse effects on individuals’ health. Exposure to air pollution is positively associated with the incidence of stroke, 1 respiratory diseases, 2 -4 and lung and cardiovascular dysfunction. 5 -10 Long-term exposure to air pollution even leads to higher rates of mortality. 11 -14
As Ambient Air Pollution, a 2016 global health report published by the World Health Organization (WHO), 15 reported, in 2012 alone, ambient air pollution was complicit in 3 million deaths and 85 million disability-adjusted life years. 16 Foremost among the pollutants associated with these mortality and morbidity numbers were airborne particulate matter known as PM2.5. As a mixture of fine particles and liquid droplets, PM2.5 is a particular danger because it is easily sucked into the lungs, where it can create a devastating impact on an individual’s health.
Aside from the role PM2.5 plays in physical health, previous studies have touched on the potential relationship between PM2.5 and individuals’ mental health. Depression, one of the leading cause of the disability-adjusted life years, is closely associated with physical illness and decreased quality of life 17 -19 and may also be associated with PM2.5. 20 -25 However, most of the existing studies focus on high-income countries, such as Canada, Europe, and United States; few have examined the situation in low-income countries, such as China (except 2 papers 24,26 )
In the past 2 decades, China has experienced unprecedented economic growth. However, the health and longevity of the Chinese people have not improved as a result. 27 It is argued that economic growth has had the opposite effect as the suicide rate and the incidence of mental illness have rapidly increased. 28 This paradox of progress may be due, in part, to the country’s notoriously poor air quality, 29 where PM2.5 could be the culprit behind hazy skies. According to the latest PM2.5 concentration data, on April 17, 2016, the annual average PM2.5 concentration in 210 cities in China was in the range of 11 to 128 μg·m−3, around 99% of cities surpassed 15 μg·m−3, the maximum limits of annual average PM2.5 concentration set by WHO. 30
In this study, we attempt to examine the potential PM2.5–depression link. We constructed a weekly index of the prevalence of depression (IPD) in 282 major cities in China using internet searches for depression-related terms on Baidu, the most widely used search engine in China. Note that there is unwarranted stigmatization associated with depression. Such stigma makes individuals embarrassed to confess their true feeling, and even avoid reaching out for help, leading to a high level of underreporting. 31,32 Internet search provides a way out, as internet searching is largely anonymous and confidential, without the presence of third party, and individuals are more likely to reflect the true feeling. Similar methods have been used in various studies to construct measures that cannot be captured in more traditional ways. 33 -38
Methods
Data
The data prepared for this analysis are from multiple sources. We constructed city-level IPD, and baseline web search index using search index extracted from Baidu, the most widely used internet search engine in China. We used Python 2.7.11 to gather search data from the web and chose “week” as the time unit.
City-level weekly PM2.5 was collected from China’s Air Quality Online Monitoring and Analysis Platform (https://www.aqistudy.cn/historydata). To rule out the potential confounding effect of weather, we collected the relevant meteorological information from the Chinese website Historical Weather (http://www.tianqihoubao.com/lishi) and the websites of Sunrise and Sunset in the website of Convenience Inquiry (https://richurimo.51240.com.zhongguo_richurimo).
Index of Prevalence of Depression
The dependent variable is the city-level IPD. To identify queries for depression, we searched for the 4 most common names for depressive disorders: depression (yi yu zheng), melancholia (you yu zheng), postpartum depression (chan hou yi yu zheng), and obsessive-compulsive disorder (OCD, qiang po yi yu zheng), as up to 75% of individuals with OCD have major depression. 39 We divided results into 52 weeks in 2017 and conducted a principal component analysis (PCA) to extract the largest component from the 4 items to serve as IPD (see Table 1). Similar results are shown when summing up the Z-score of the 4 time series as a proxy of IPD.
Factor Loadings of Depression Search Index in Baidu.a

a Principal component factor analysis. KMO = 0.83. Bartlett’s test of sphericity = 2.16e+05 (6), P < .001.
Control Variables
We control for several variables to take care of potential confounding effects and present the relevant descriptive statistics in Table 2. First, city-level internet usage. We average city-level weekly data from Baidu for 11 most popular portals (ie, Baidu, We-chat, QQ, Taobao, Alipay, Sina, Sohu, Netease, Tencent, Chinese Central Television, and Bulliet strain) and conducted a PCA to extract 1 factor from these items.
Descriptive Statistics of Major Variables.

Second, city-level weather conditions. They are (1) weekly daylight (Daylen) (weekly averaged day length multiplied by the weekly ratio of sunny days), (2) weekly averaged day mean temperature (Tem), (3) weekly ratio of rainy days (Rain), and (4) weekly averaged wind speed (Wind). All the information were collected from the Chinese website Historical Weather (http://www.tianqihoubao.com/lishi) and the websites of Sunrise and Sunset in the website of Convenience Inquiry (https://richurimo.51240.com.zhongguo_richurimo).
To deal with the temporal effects, we also controlled for week number (centered) and its squared term to capture the potential nonlinearity.
Model
To examine how PM2.5 might affect depression in China, we employed 2-way fixed effects model that is easy to rule out confounding effects rising from time-invariant, city-level factors. We use the lagged values (t − 1) of all explanatory variables to account for the potential time delay. The formula is written as follows:

In Equation 1,
Results
Distribution of Weekly PM2.5 and IPD
Figure 1 presents the distribution of weekly average PM2.5 in 282 cities in China. As shown, central China and some parts of northeast and northwest China with higher proportion of heavy industry are the most polluted areas as evidenced by the highest levels of PM2.5. In contrast, western China, Inner Mongolia, and some parts of northeast and south China have relatively low levels of air pollution.

PM2.5 level (weekly average) in 282 Chinese cities (2017).
The distribution of IPD is visualized in Figure 2. As shown, individuals living in northwest China, especially Tibet, are the least likely to search for depression-related terms, followed by individuals from northern China, and then from the south and some parts of central China. Such distribution seems in line with the regional differences in socioeconomic development, internet accessibility, and air pollution.

Depression-related online search volumes in 282 Chinese cities (2017).
Results From 2-Way Fixed Effects Model
Table 3 reports the results of a 2-way fixed-effects model. As Model 1 demonstrates, PM2.5 is positively and significantly associated with IPD. Specifically, a 100 μg/m3 increase in the previous week’s PM2.5 in a city is significantly associated with a 0.279 increase in its IPD (P < .01), suggesting a positive relationship between PM2.5 and depression. 20 -25 Consistent with previous research, 29,31 weekly daylight length (P < .001) and wind speed (P < .001) are significantly and negatively correlated with depression level. Specifically, a 1-unit increase in daylight length and wind speed level is associated with 0.038 and 0.378 increases of IPD, respectively.
As the contributions of particular components to particulate matter vary by season, we further conduct by-season analysis, presented in models 2 to 5. Results showed that PM2.5 is positively associated with depression searches in all seasons but is more pronounced and statistically significant in spring (P < .001) and summer (P < .01), party of reason is higher temperatures are often associated with a faster dissipation of airborne particles.
Two-Way, Fixed Effects Models Predicting Depression by Seasons.a

a Standard errors in parentheses.
b P < .01.
c P < .001.
d P < .05.
China covers a massive amount of land area, and PM2.5 patterns vary according to the region for reasons of geographical features, concentrations of industry, and regional idiosyncrasies; we further fitted models by region. As shown in Table 4, PM2.5 is associated with depression searches in all Chinese regions except the west, where both PM2.5 and depression searches are low. Specifically, the positive association between PM2.5 and depression searches is statistically significant for the east (P < .01) and the south (P < .001), where socioeconomic development level is higher than the rest of the region. Such a pattern can also be taken as a manifestation of the paradox of progress in China. That is, regions enjoy the benefits of economic gain and, meanwhile, suffer from increased depression resulting from air pollution.
Two-Way, Fixed Effects Models Predicting Depression by Regions.a
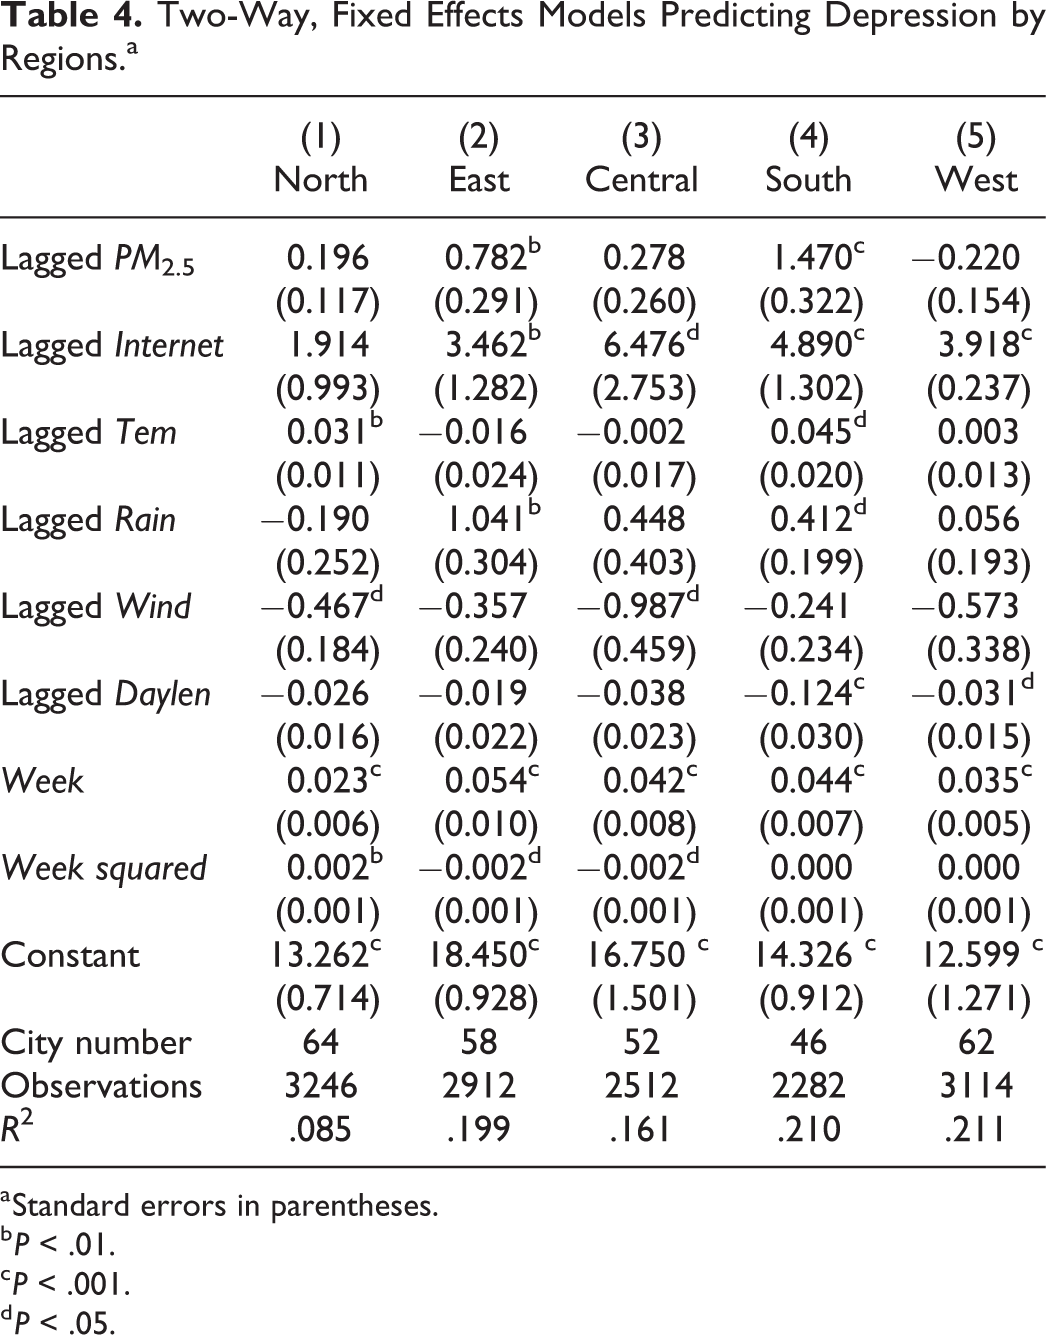
a Standard errors in parentheses.
b P < .01.
c P < .001.
d P < .05.
Discussion
While China’s economy has boomed in the past 2 decades, the quality of life of Chinese people has not. On the contrary, there is an increased risk of depression. Such a paradox to progress might be partly attributable to air pollution. In this article, we examined whether PM2.5, one of the most dangerous and heatedly discussed sources of air pollution, is associated with depression. We constructed a city-level weekly IPD using online query volume data from Baidu rather than self-reported depression to proximate the latent depression.
Our findings provide suggestive evidence on the source of China’s paradox of progress that economic success has not translated into a better quality of life for all. We recommend that future studies identify the sources of depression and the associated mechanisms that lead to this paradox and that they inform policy with the aim of improving the quality of life for all Chinese citizens.
Limitations
This study had some limitations. First, the valid finding of this research is premised upon the fact that no short-term social, economic, or political changes influence the PM2.5 level and searches for depression-related terms. We did not verify these short-term changes; thus, we cannot rule out the possibility that there have been some that affected air quality. Even if there were, changes in air quality often take relatively long periods of time to be observed. In this vein, the biased estimation is less of a concern in this analysis. Second, different from most of the extant studies that involve rigorous analyses at the individual level, our estimation of depression index is conducted based on less explored macro-city level, and we identified the PM2.5 as one potential risk factor that is negatively associated with implied depression; however, what drives such relationship remains unsolved, making the city-level pattern less intuitive. Note that due to difficulties of accessing data at macro-level and the wide concern of ecological fallacy, macro-level analyses remain rare in public health field, making the development of macro-theory stagnated. This analysis, although unsound, is a critical interrogation of available big data to harness their strength at the macro-level and from a macro perspective. It, to the least degree, can be taken as the first step to tap into the exploration of macro-theory.
Conclusion
To examine the possible correlation between PM2.5 and depression, we matched IPD with city-level weekly PM2.5 and weather condition variables. The results show that 1-week lag of PM2.5 can positively predict the IPD of the following week, holding constant weekly internet usage and various meteorological factors, and such effects are more prominent in spring and summer and in the East and South.
Footnotes
Author Contributions
G.H., Y.C., S.W., and Y.D. developed the ideas, analyzed the data, and drafted the paper. G.J and B.C collected the data and revised the paper.
Declaration of Conflicting Interests
The author(s) declared no potential conflicts of interest with respect to the research, authorship, and/or publication of this article.
Funding
The author(s) disclosed receipt of the following financial support for the research, authorship, and/or publication of this article: This research is funded by the Major Project of The National Social Science Fund of China (No. 19ZDA149).