
Abstract
Chronic inflammation mediates an extraordinarily wide range of diseases. Recent progress in understanding intracellular inflammasome assembly, priming, activation, cytokine signaling, and interactions with mitochondrial reactive oxygen species, lysosome disruption, cell death, and prion-like polymerization and spread of inflammasomes among cells, has potentially profound implications for dose–response modeling. This article discusses mechanisms of exposure concentration and duration thresholds for NOD-like receptor protein 3 (NLRP3)-mediated inflammatory responses and develops a simple biomathematical model of the onset of exposure-related tissue-level chronic inflammation and resulting disease risks, focusing on respirable crystalline silica (RCS) and lung cancer risk as an example. An inflammation-mediated 2-stage clonal expansion model of RCS-induced lung cancer is proposed that explains why relatively low estimated concentrations of RCS (eg, <1 mg/m3) do not increase lung cancer risk and why even high occupational concentrations increase risk only modestly (typically relative risk <2). The model of chronic inflammation implies a dose–response threshold for excess cancer risk, in contrast to traditional linear-no-threshold assumptions. If this implication is correct, then concentrations of crystalline silica (or amphibole asbestos fibers, or other environmental challenges that act via the NLRP3 inflammasome) below the threshold do not cause chronic inflammation and resulting elevated risks of inflammation-mediated diseases.
Introduction: Linear-No-Threshold Versus Threshold Dose–Response Models
As the field of quantitative risk assessment (QRA) for carcinogens has matured over the past 40 years, several fundamental questions have remained unresolved. One concerns the realism of the linear-no-threshold (LNT) assumption or hypothesis that exposure-related excess risk of cancer is proportional to exposure concentrations and durations, at least at relatively low levels of exposure. Despite its convenience and widespread use in regulatory risk assessments, enthusiasts of biologically based risk assessment and mode-of-action considerations have long criticized the LNT assumption as being unrealistic for important nongenotoxic and genotoxic carcinogens. 1 -3 Quantitative risk assessments using 2-stage clonal expansion (TSCE) and multistage clonal expansion (MSCE) models of carcinogenesis indicate that many carcinogens increase cancer risks by increasing the net birth rates of altered (eg, “initiated” or “premalignant”) cells, rather than (or in addition to) hastening mutations by acting directly on DNA. Exposure-related increases in proliferation (“clonal expansion” or “promotion”) of the pool of cells at risk of being transformed into malignant cells by a mutation can increase cancer risk even if exposure does not increase the mutation rate itself. Dose–response thresholds arise if compensating proliferation of cells in response to unrepaired cytotoxic damage (eg, regenerative hyperplasia subsequent to oxidative damage) occurs only at doses high enough to cause such damage, perhaps after depleting pools of protective resources such as antioxidants or saturating capacity for repair of oxidative damage. 2,4,5 This might be called the cytotoxicity/cell proliferation model of thresholds in carcinogen dose–response relations. It can also lead to U-shaped or J-shaped dose–response relations (hormesis) if low exposure levels upregulate production of antioxidants or other protective resources that become depleted or saturated at higher doses. 5 -8 Thresholds and hormesis have been discussed for important carcinogens including arsenic, 9 chloroform, 10 1,4-dichlorobenzene, 11 diesel exhaust, ionizing radiation, dioxin (TCDD), 5 saccharin, 12,13 and many others. 6,7
For lung carcinogenesis caused by inhaled particles or fibers, compensating proliferation of relevant cell populations (possibly including alveolar type II epithelial cells, bronchial basal cells, Clara cells, pulmonary neuroendocrine cells, and bronchioalveolar stem cells at bronchioalveolar duct junctions) depends not only on direct damage from particles but also on resulting releases of reactive oxygen species (ROS) from damaged cells and inflammation of the alveolar epithelium and the lung environment. 14 -16 The ROS is known to act as a second messenger affecting stem cell proliferation for self-renewal and differentiation in many systems. 17,18 In the lung, ROS signaling is involved in inflammation and cytotoxicity caused by quartz dusts and other particles, with response thresholds for measures of cytotoxicity and inflammation (eg, tumor necrosis factor α [TNF-α]) that depend on the physicochemical properties of the dust. 19 Experiments in rats show an exposure threshold above which lungs become overburdened and clearance of even low-solubility and relatively low toxicity particles by alveolar macrophages (AMs) becomes impaired. 20 However, the rat lung appears to be unique in this regard, so it is widely considered that there are no clear implications for human carcinogenicity of rat lung carcinogenicity that depends on such overburdening of the lung. 21
More recently, a different type of threshold has been elucidated for inflammatory responses in lungs exposed to mineral particles and mineral fibers. Cell-level inflammatory responses to a wide variety of environmental dangers, including inhaled respirable crystalline silica (RCS) and asbestos fibers, are mediated by the NOD-like receptor protein 3 (NLRP3) inflammasome, a supramolecular signaling complex that assembles in the cytosol of AMs, alveolar epithelial cells, and other lung cells and coordinates releases of inflammatory cytokines in response to a wide range of stimuli. 22 The complex contains a pattern recognition receptor that recognizes a variety of pathogen- and danger-associated molecular patterns—specifically, a nucleotide-binding oligomerization domain (NOD)-like receptor (NLR), from which the name “NOD-like receptor protein 3” is taken, although it is also often used to abbreviate longer and more descriptive names for the same complex (eg, “nucleotide-binding domain, leucine-rich repeat region-containing family, pyrin domain-containing-3” 23 ). The NLRP3 inflammasome has been implicated in the pathogenesis of exposure-related fibrosis, silicosis, asbestosis, lung cancer, mesothelioma, and many other diseases, from viral and bacterial infections to type 2 diabetes, heart disease, Alzheimer and Parkinson diseases, atherosclerosis, and arthritis, gout, and other autoimmune diseases. 24 It senses damage signals and disruption of cellular homeostasis and responds by producing the potent proinflammatory cytokines interleukin-1β (IL-1β) and IL-18 and inducing pyroptosis, a highly inflammatory form of programmed cell death that leads to swelling and lysis (rupture) of the cell membrane and release to the extracellular environment of its inflammatory contents—including IL-1β, IL-18, and activated NLRP3 inflammasomes. 22,25 -28 The NLRP3 inflammasome provides important portions of a previously missing link between exposure-related ROS-associated oxidative damage within the cell and the spread of inflammation between cells that creates chronic inflammation of tissue, a high ROS tissue environment, and increased risks of inflammation-mediated diseases. 29,30
This article focuses on RCS lung cancer dose–response relations as a specific example, but similar biological points hold more generally for other inflammatory agents and inflammation-mediated diseases. The main points in the following sections are as follows. Contrary to the LNT model, priming, assembly, and activation of the NLRP3 inflammasome in response to inhaled RCS, asbestos, and other agents involve clear dose–response thresholds. Both concentration and duration of exposure have thresholds: Neither high concentrations for too short a period nor prolonged exposures to too low a concentration can activate the NLR3 inflammasome. Exposures that do not generate sufficiently high concentrations of RCS particles in AMs for sufficiently prolonged durations do not activate their NLRP3-mediated responses. We review several different biological mechanisms that prevent NLRP inflammasome activation in response to brief or low-concentration exposures. Dose–response thresholds at the level of intracellular NLRP3 inflammasome activation imply tissue-level dose–response thresholds for inflammation, and specifically for the onset of chronic, irreversible inflammation mediated by activation of NLRP3 inflammasomes. We present a simple mathematical model linking individual cell-level thresholds for inflammation to resulting tissue-level thresholds for self-sustaining chronic inflammation in a population of cells. These dose–response thresholds hold also for induction of chronic inflammation-mediated diseases such as silicosis, fibrosis, or lung cancers in workers exposed to high and prolonged concentrations of RCS. We illustrate this point by embedding the tissue-level inflammation model between a previously developed physiologically based pharmacokinetic (PBPK) front-end model for RCS and a TSCE model of lung carcinogenesis. Realistic estimates of interindividual variability in dose–response thresholds suggest that populations of people (eg, occupationally exposed populations) also have exposure concentration and duration thresholds below which exposures do not increase risks of NLRP3 inflammasome-mediated diseases.
If dose–response thresholds exist, they dramatically change both the information requirements for QRA and the nature of risk management calculations that compare marginal benefits to marginal costs of incremental reductions in allowed exposure concentrations. This article concludes by briefly examining some of the risk assessment and risk management implications of exposure thresholds for inflammation-mediated diseases.
Biological Thresholds for NLRP3 Inflammasome Priming, Assembly, and Activation
This section reviews and synthesizes aspects of NLRP3 inflammasome biology related to dose–response thresholds for triggering NLRP3 activation and induction of inflammatory responses to stressors such as RCS. The goal here is qualitative: to review biological grounds for concluding that dose–response thresholds exist at the level of individual cells. The next section explains how cell-level thresholds create tissue-level thresholds for exposure-induced chronic inflammation. Quantitative assessment of how large this chronic inflammation dose–response threshold is for RCS, and how variable it is among individuals, are addressed subsequently.
The NLRP3 inflammasome is a multiprotein complex that forms in AMs and other cells in response to detection of sufficiently strong damage-associated signals or bacterial proteins by toll-like receptors (TLR; especially TLR4) on the cell surface or by other pattern recognition receptors. In response, signaling cascades transmitted via nuclear factor-κB (NF-κB) pathways to the cell nucleus induce it to upregulate production ofpro-IL-1β and of NLRP3 protein filaments, secreting them into the cytosol, thus “priming” the cell for assembly and activation of the NLRP3 inflammasome. 31 Two distinct thresholds, one for NF-κB signaling and one for MAPK activation, provide an ultrasensitive, switch-like response to TLR4-induced inflammation, preventing production of inflammatory cytokines by macrophages in response to weak TLR4 stimulation so that low levels of damage do not trigger inflammatory responses. 32 Priming also increases deubiquitination of NLRP3, allowing post-translational as well as transcriptional regulation of active NLRP3 protein balance (Song and Li 2018). 31,33,34 If the concentration of protein becomes high enough and damage signals continue to be received, Pyrin domain-containing sensors on the filaments lose their autoinhibition (eg, via deubiquitination) and begin a process of orderly nucleated polymerization (assembly of successive units) of apoptosis-associated speck like protein containing a CARD (ASC) and oligomerization (assembly of different types of protein units into a complex) to create a fully functional, wheel-shaped NLRP3 inflammasome in the cytosol (Song and Li 2018). 33,34 The completed inflammasome has a Pyrin domain-containing sensor in its NLRP3 component, a caspase-recruitment domain (CARD) effector component, and an adaptor molecule linking them: the ASC. The assembly process is cooperative: Once begun, addition of further units becomes more favorable, leading to a characteristic all-or-nothing response for inflammasome assembly. 33,35 Conversely, if damage signals are too rare or too brief, the critical concentration of uninhibited NLRP3 sensors and protein filaments required to initiate cooperative oligomerization is not reached, and assembly and activation of NLRP3 inflammasomes then do not occur. Thus, cooperative assembly in response to sustained damage signaling creates dose–response thresholds for NLRP3 inflammasome assembly and NLRP3-mediated inflammatory responses. In general, nucleated cooperative polymerization exhibits a sharp concentration threshold for the constituent subunits (eg, ASC): Below a critical concentration, they cannot self-assemble into polymers, but above it, they do. This has long been understood on biophysics grounds (eg, 36 ). Assembly of the NLRP3 inflammasome illustrates this general principle.
Activation of the assembled inflammasome requires a second signal, referred to as “signal 2,” that again appears to operate in part by deubiquitinating NLRP3. (In contrast to the mitochondrial ROS [mROS]-dependent deubiquitination involved in priming, deubiquitination induced by the second signal is mROS independent, indicating that distinct regulatory mechanisms are involved.) 31,37 Although the precise molecular identity of signal 2 is uncertain, the closely correlated events of potassium ion (K+) efflux, calcium ion (Ca2+) signaling, high mROS and cytoplasmic ROS production, inhibition of antioxidant thioredoxins, 30 mitochondrial damage, and lysosomal rupture following lysosome membrane permeabilization (LMP), leading to release of cathepsins from the lysosome, 38 have all been proposed to play critical and interrelated roles; these are reviewed in more detail elsewhere. 39,40 The LMP and rupture of the lysosome appears to be a central pathway for NLRP3 inflammasome activation, specifically for silica and other respirable particles. 41 Lysosome rupture is of course an intrinsically threshold phenomenon: It occurs only when intralysosomal concentrations of cell damage products become too high. Moreover, the fact that signal 2 must be received after the inflammasome has assembled and before it is deactivated and removed via ubiquitination and autophagy 42 implies a temporal threshold for activation: Substantial damage to the cell must be sustained long enough for priming, assembly, and activation to take place in a cell (ie, on a time scale of hours).
The activated NLRP3 inflammasome recruits caspases, including caspase-1, which cleaves the protective protein ends from pro-IL-1β and pro-IL-18, forming mature active IL-1β and IL-18 that are secreted by the AM and exert a number of potent proinflammatory effects via the cytokine and chemokine networks, including recruiting phagocytes (neutrophils and macrophages) to engulf and devour the sources of inflammation. Caspase-1 also causes mitochondrial damage and disassembly, production of mROS, and pyroptosis, leading to the swelling and bursting (lysis) of the inflamed cell and release of its inflammatory contents, fueling further inflammatory signaling to nearby cells. The release of ASC specks and NLRP3 inflammasomes into extracellular spaces facilitates ROS activation and spread of inflammation to nearby cells, as the released components continue to promote IL-1β maturation and broadcast inflammatory danger signals to neighboring cells, which can respond by becoming inflamed themselves. 25 The release and subsequent uptake of ASC specks also spreads inflammation among macrophages via a prion-like transmission mechanism: When phagocytized by macrophages, the previously released ASC specks induce lysosomal damage, nucleation of ASC oligomerization and fiber growth, and IL-1β activation in their new hosts, initiating a new round of inflammatory responses, pyroptosis and lysis, and release of the specks to continue the process. 43 Inflammation is like a contagious disease in the population of cells: Inflamed neighbors increase the probability that a currently uninflamed cell will become inflamed.
At the tissue level, if inflammation remains unresolved due to prolonged damage signaling and continued activation of NLRP inflammasomes, then it is plausible that the inflammatory response ceases to serve the health-preserving role of restoring homeostasis for local cells and tissue and instead crosses over to a pathological process of harmful unresolved inflammation: In response to chronic exposure to NLRP3-activating conditions, the homeostatic threshold of NLRP3 may be surpassed, resulting in excessive and detrimental inflammation, and ultimately disease.…NLRP3 becomes pathologic either because of too strong a response or because of the overactivation of macrophages due to the chronic presence of excessive amounts of [noxious] substances.
24
Modeling the Transition From Transient to Chronic Inflammation
The main point of this section is that inflammation dose–response thresholds for individual cell simply inflammation dose–response thresholds for cell populations and tissues. This conclusion holds in various models of inflammation. It is robust to many variations and uncertainties about the details of the inflammatory process, but follows mainly from the key assumption that the rate (probability per unit time) at which a cell or area of tissue becomes inflamed increases when its neighbors are inflamed. The spread of inflammation in a population of cells is then somewhat analogous to the spread of an infectious epidemic in a spatially distributed population of people. Dose–response thresholds for self-sustaining inflammation, analogous to epidemic thresholds, arise for a wide range of alternative assumptions about transmission among neighbors. The modeling in this section also seeks to clarify how sustained exposure can drive a transition from homeostatic, transient, self-resolving inflammation to pathological, self-sustaining, chronic inflammation.
Several mathematical and computational models have previously been proposed for lung tissue inflammation in response to inhaled microbial, viral, and particulate challenges. 44,45 Both ordinary differential equation (ODE) models 45 and agent-based models (ABMs) 46 have been used to simulate the dynamics of lung cell populations and their behaviors (eg, activation, functioning, and removal of AMs) over time and within different lung compartments or locations. However, no model of which we are aware has attempted to provide a realistically detailed account of the many variations in individual cell states or the complex interactions among cells within and between different cell populations, and nor shall we. Rather, models of lung inflammation typically aggregate many cell populations into a few representative types or compartments and study simplified version of their interactions to illuminate their qualitative and quantitative dynamics. The ABMs (and partial differential equations models) can consider locations as well as time, but typically model changes in the states of cells at specified locations as depending on the states of neighboring cells via very simple rules or functions. Current biological knowledge is probably too limited to permit much more detailed and realistic modeling; for example, the precise identity of the “signal 2” activating primed NLRP3 inflammasomes is not yet known, and many other details of inflammasome regulation both within and among cells (eg, which specific ubiquitins and deubiquitins are involved and how they vary over time and location within the cytosol) are still being elucidated. Despite these knowledge gaps, we propose that a simple model that borrows ideas from both ODE (compartmental) and ABM modeling can shed useful light on how exposure to RCS or other NLRP3-activating substances can shift responses from homeostatic inflammation (self-limiting inflammation that resolves itself after exposure ceases) to pathological chronic inflammation that sustains itself even in the absence of further exposure.
Consider a population of units, each of which is either “inflamed” or “not inflamed” at any moment. For example, we might focus on AMs as the units and declare a macrophage to be inflamed if it contains at least 1 activated NLRP3 inflammasome. Or, since there are many other cell types (eg, monocytes, neutrophils, dendritic cells) involved in lung inflammation, and knowledge and data to support detailed modeling of their behaviors, movements, and interactions are not readily available, the units might instead be interpreted as referring to locations or “patches” within the lung, with each patch being either inflamed or not at any moment. (Patches can be envisioned as small contiguous spatial areas that collectively tessellate the tissue, analogous to elements in a finite-element analysis grid. A patch might be defined as being inflamed if it harbors activated AMs, or has ASC specks or activated inflammasomes in its extracellular spaces, or has concentrations of IL-1β significantly above normal background levels, or meets other operational criteria for inflammation.) We can afford such useful ambiguity about the precise interpretation of the model because the same equations describe a wide range of phenomena and can be interpreted in different ways without affecting the validity of resulting conclusions about the spread of inflammation.
For notation, Let P(t) denote the fraction of the population (of cells or patches) that is inflamed at time t; thus, 1 − P(t) is the fraction that is not inflamed then. When time is not being emphasized, these quantities can be denoted more briefly as P and 1 P. Assume that inflamed cells are replaced by uninflamed ones at a rate of d replacements per inflamed cell per unit time. The parameter d represents the combined effects of inflammation-resolving mechanisms such as ubiquitination of active NLRP3 inflammasomes, autophagy by autophagosomes formed in response to, and partly colocalized with, inflammasomes, 42 removal of macrophages (perhaps with burdens of RCS particles that have not been successfully phagocytosized) via the mucociliary escalator, and pyroptosis and replacement of inflamed cells that have died (eg, via pyroptosis) or been removed by uninflamed ones. (Of course, modeling these clearance processes by a single rate constant is an oversimplification, as they have their own detailed dynamics. For example, particle overload in the rat lung compromises the efficiency of phagocytosis, corresponding to a decrease in d. 14,47 However, we shall focus on lower exposures and long averaging times, for which the simplified approximate description of clearance of inflamed cells by a single rate constant yields useful insights into inflammation dynamics on a time scale of months to years or decades, despite its undoubted inaccuracies on short time scales.) Conversely, uninflamed cells become inflamed at a rate that depends on the states (inflamed or not) of other cells. The flow of cell from uninflamed to inflamed at any moment is proportional to 1 − P and to the strength of proinflammatory signals that these currently uninflamed cells are receiving. Mean-field theory 48 suggests approximating this signal strength by some increasing function of P, which we will denote by f. Internal doses of RCS particles or other poorly soluble particles can also cause AMs to become inflamed as phagocytosis fails to dissolve the particles and they prime and activate NLRP3 inflammasomes. Letting c denote the fractional rate at which uninflamed cells become directly inflamed by internal dose, the mass-balance ODE describing the evolution of P over time has the following form:

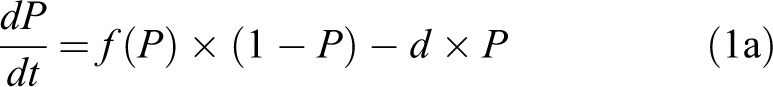
All of the parameters and P itself may vary over time and in response to dose. To focus at first on the dynamic response of the lung to previous inflammatory exposures, we will consider scenarios in which a history of exposure has led to some starting level of inflammation, denoted P(0) (with time 0 defined as the time at which we start tracking the inflammation process) and with no further exposure, ie, c = 0, over the time interval for which response is modeled. For such exposure scenarios, equation (1) simplifies to equation (1a).
To obtain an explicit model that supports simulation of time courses, it is necessary to specify the function f. The ABM simulations have each cell or patch (ie, each “agent” or unit) make state transitions (eg, from uninflamed to inflamed) at each moment based on the current states of its neighbors. Although mean-field approximations and lumped-parameter ODEs, such as equation (1a), do not explicitly identify the neighbors of individuals units, a stochastic ABM with discrete time steps would typically assume that each unit has N neighbors and that each uninflamed unit becomes inflamed if and only if at least k of its N neighbors is inflamed. The crucial assumption that each individual cell (or other unit) has a dose–response threshold for becoming inflamed is reflected in the threshold parameter k. (In reality, cells are heterogeneous and k may be different for different cells; this and other complexities are discussed subsequently.) When the fraction of units that are inflamed is P, the probability that a randomly sampled uninflamed unit will have at least k inflamed neighbors, and hence become inflamed itself, is determined from the binomial cumulative distribution function (CDF) with parameters k, N, and P: Using the notation of the R statistical programming language, it is simply 1 − pbinom(k, N, P), where pbinom(k, N, P) denotes the CDF for the binomial distribution with these parameters. An explicit formula for f(P) in discrete time, given the parameters K and N, is thus:

For example, if each patch has N = 4 neighbors and if it becomes inflamed if and only if at least 3 of them are inflamed, then the fractional inflammation rate per unit time will be:

This is just the probability that the number of inflamed neighbors is 4 or 3. In continuous time, assuming a mean field approximation with averaging over relevant time scales, f(P) refers to a fractional rate per unit time (which may exceed 1) rather than to a discrete probability, and equation (2) is replaced by equation (3):

Here, the parameter a converts from probability per discrete time step to fractional rate per unit of continuous time. It can be interpreted as a potency or intensity parameter reflecting how quickly a cell becomes inflamed once its inflammation dose–response threshold has been exceeded. The mean-field approximation ignores detailed stochastic fluctuations and considers only average values; thus, it is entirely possible that some cells with high probabilities of becoming inflamed during some interval won’t, while others with lower probabilities will; also, the local percolation of inflamed cells through parts of a population may take more or less time than average-case calculations reveal, with local patches of inflammation spreading or extinguishing randomly. Nonetheless, mean-field approximation gives useful analytic insight into drivers of the long-run dynamic behavior of the system, as discussed next, even though it is not the right tool for analyzing short-term stochastic fluctuations or variability around average-case behaviors. 48 Substituting equation (3) into the ODE model (1a) yields equation (4) as the final ODE model governing the evolution of inflammation P over time in the absence of further contributions from internal doses.

The qualitative nature of possible solutions (ie, time courses of P) for this model is of greatest interest, rather than specific numerical values. One qualitative question is whether there are any equilibrium values of P, corresponding to the levels of inflammation that will sustain themselves if they are reached. P = 0 is a trivial example of such an equilibrium—if the system starts with no inflamed cells and no inflammatory exposures, it remains with no inflamed cells—but the more interesting qualitative questions remain of how many nonzero equilibria there are (if any), their relative sizes, their local stability, and how they are approached (if at all) from any starting degree of inflammation, P(0). Answers can be gained by recognizing that, at equilibrium, dP/dt = 0 and hence the ODE in equation (4) reduces to the algebraic equation a(1 − pbinom(k, N, P)) × (1 − P) – d × P = 0, which can be rearranged as equation (5) if P is an equilibrium value strictly between 0 and 1 for the fraction of inflamed units.

As P is increased from 0 toward 1, the left side of equation (5) considered as a function of P increases from 0 toward infinity and the right side increases from 0 to a/d. Equilibrium levels of P occur wherever these 2 curves cross, so that equation (5) is satisfied. Since the right side of equation (5) approaches a horizontal line at height a/d and the left side approaches a vertical asymptote at P = 1, if the left side is ever less than the right side, then there must exist at least one nonzero equilibrium value of P at which the left curve crosses the right curve from below. Such an equilibrium is locally stable, since P/(1 − P) as a function of P crosses (a/d)(1 − pbinom(k, N, P)) from below only if P/(1 − P) < (a/d)(1 − pbinom(k, N, P)), which can be rearranged as a(1 − pbinom(k, N, P)) × (1 − P) − d × P > 0, or (by equation (4)) as dP/dt > 0. In other words, P is increasing at P values to the left (and, conversely, is decreasing at P values to the right) of the intersection point, making it a stable equilibrium. At the origin, where P = P/(1 − P) = (a/d)(1 − pbinom(k, N, P)) = 0, the function P/(1 − P) on the left side of (5) has slope 1 and the function (a/d)(1 − pbinom(k, N, P)) on the right side of (5) has slope 0, so dP/dt < 0 at the origin, implying that P = 0 is a locally stable equilibrium. Figure 1 diagrams both of these functions of P (P is on the horizontal axis) and shows their intersections for the specific combination of values of the model parameters a/d = 2, k =2, N = 6.

Left and right sides of equation (5) as functions of the inflammation level P on the horizontal axis. T is an unstable equilibrium. The origin and E are stable equilibria.
Although different choices of these parameter values change the exact form of the S-shaped curve for (a/d)(1 − pbinom(k, N, P)) in Figure 1, the following qualitative properties do not depend on details of the curve or the precise numerical values of its parameters. The origin is a stable equilibrium (since P/(1 − P) > (a/d)(1 − pbinom(k, N, P)), so dP/dt < 0). In other words, small levels of inflammation tend to resolve themselves. There is a threshold level of inflammation, corresponding to the unstable equilibrium intersection point T in Figure 1, below which the inflammation level P will decrease to 0 over time (self-resolving transient inflammation). In the jargon of dynamical systems theory, the “basin of attraction” for the healthy equilibrium point P = 0 extends from 0 to T. From any initial inflammation level 0 < P(0) < T, the values of P(t) decrease toward zero as time t increases. If the vertical scaling factor a/d is small enough so that the 2 curves only intersect at P = 0, then T becomes effectively infinite and P = 0 is the only equilibrium and is globally stable. Otherwise, if the threshold T is finite (between 0 and 1), a second stable equilibrium exists, as described next. There is a unique nonzero stable equilibrium level of inflammation, corresponding to intersection point E in Figure 1. From any initial inflammation level to the right of T, the inflammation level P will move toward E over time (self-sustaining chronic inflammation). The basin of attraction for E extends from P = T to P = 1.
Figure 2 shows explicit trajectories (time courses) for P(t) starting from different initial levels of inflammation, P(0), on the vertical axis. (For variety, this is illustrated for an inflammation process described by parameters k = 2, N = 3, d = 0.2, and a = 0.4, although the qualitative properties of interest do not depend on these specific numerical values.) The vertical axis is scaled in percentages, running from 0% to 100% of units inflamed. Time is on the horizontal axis, with units reciprocal to those of the fractional rate parameters a and d; if they are in fraction per day, then time units would be days; if they are in fraction per month, then the time units would be months, and so on. Since the qualitative nature of the trajectories is of central interest, we leave the time units unspecified for now. For sufficiently small initial inflammation levels (below T on the vertical axis), all trajectories lead down to 0, although the times for them to reach any given level become longer and longer as the initial inflammation fraction increases toward T. At a starting value of P(0) = T, the time to decline becomes infinite (since T is an equilibrium level, albeit an unstable one). For initial inflammation levels greater than T, the trajectories instead approach a self-sustaining higher equilibrium value, E = 50% on the vertical axis, with the approach taking less time from initial inflammation levels closer to E.
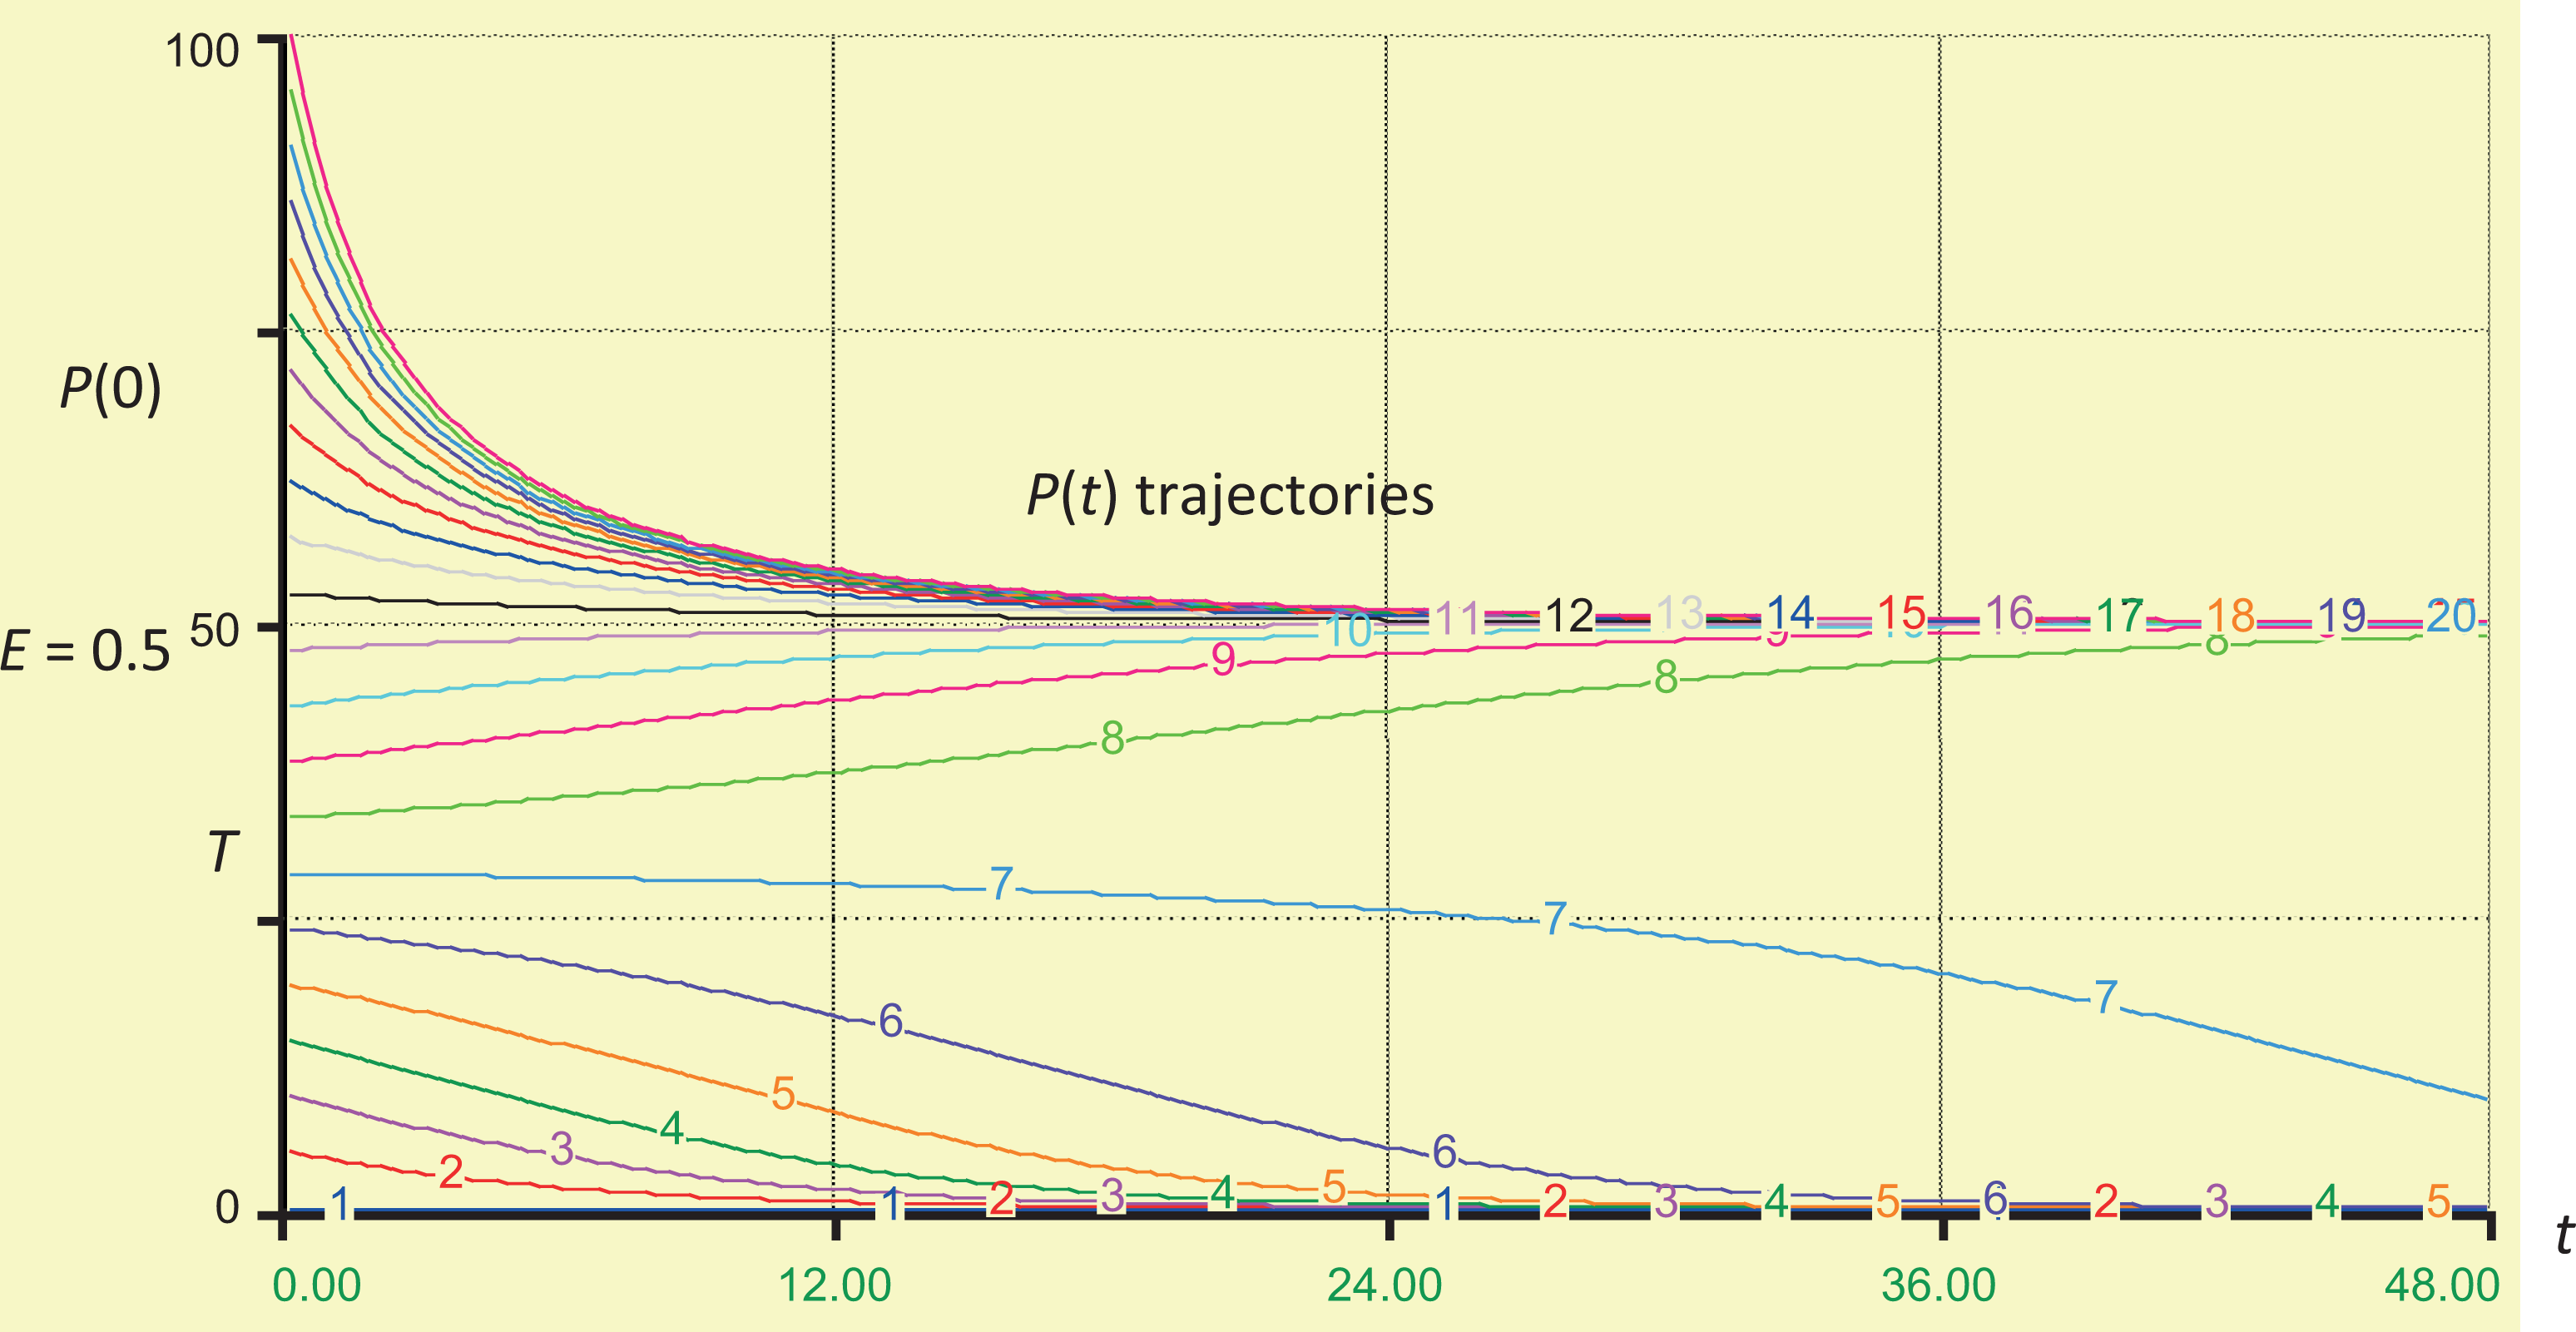
A family of P(t) inflammation trajectories starting from different initial inflammation levels on the vertical axis (numbers show percent of units inflamed). Time is on the horizontal axis. Time units are left unspecified here; they are the inverse of the units for the rate parameters a and d. For these trajectories, k = 2, N = 3, d = 0.2, and a = 0.4. Time (nominal units, eg, months or years, depending on rate constants).
If internal dose is constant and contributes an additional fractional rate of inflammation c per unit time by inhaled particles interacting directly with as-yet uninflamed cells, then equations(4) and (5) generalize to equations (6) and (7), respectively.


The qualitative analysis is almost identical to that already given for the case c = 0, but now continued exposure shifts the S-shaped curve in Figure 1 upward by c/d (which shifts T down and E up and moves the stable homeostatic equilibrium from 0 to a positive value).
Figures 1 and 2 show how sufficiently large exposures in this model can eventually shift inflammation from self-limiting to chronic by pushing the system from the basin of attraction for P = 0 (below threshold T) to the basin of attraction for P = E (above threshold T). The system dynamics described by equation (4) exhibits bistability: Exposure histories that do not inflame more than the threshold fraction T of units lead to transient inflammations that eventually resolve themselves in the absence of continued exposure, returning to 0 units inflamed, but inflammation above this threshold level leads to irreversible chronic inflammation that settles at the new, higher level E. Thus, spread of inflammation among cells provides a different route to bistability than positive feedback loops, a well-known source of bistability in biological control systems that are also important in RCS-induced lung inflammation. 49 Rather than a feedback loop, a tipping point (similar to an epidemic threshold) better describes the bistability here: Once the proportion of inflamed cells exceeds threshold T, it becomes easier (more likely) for other cells to become inflamed than to remain uninflamed. The inflamed fraction expands until a new dynamic equilibrium is reached in which the numbers of inflamed cells being created and cleared per unit time are again equal.
It may be useful to compare the implications of the ODE model in equation (6) to those from ABM models. Although the analysis in Figures 1 and 2 show that equation (6) describes a bistable system, observations over a relatively short time horizon would not reveal that trajectories that start near-threshold T eventually reach either of 2 levels, homeostatic equilibrium or the pathological equilibrium level, E. This is consistent with observations of 3 types of observed trajectories reported for a simple ABM simulation model, as reported by Brown et al
46
: An agent-based model (ABM) was created to examine the response of an abstracted population of inflammatory cells (nominally macrophages, but possibly including other inflammatory cells such as lymphocytes) and cells involved in remodeling (nominally fibroblasts) to particulate exposure.…The model yielded three distinct states that were equated with (1) self-resolving inflammation and a return to baseline, (2) a pro-inflammatory process of localized tissue damage and fibrosis, and (3) elevated pro- and anti-inflammatory cytokines, persistent tissue damage, and fibrosis outcomes. Experimental results consistent with these predicted states were observed in histology sections of lung tissue from mice exposed to particulate matter.
Although the particular combination of ODE, ABM, and mean-field theory simplifications in equation (6) for modeling the transition from acute to chronic inflammation is new to the best of our knowledge, the finding that there is a threshold below which self-sustaining inflammation does not occur and above which it does has many analogies and generalizations in the biomathematical theory of epidemics and in percolation theory for spatial stochastic processes. The existence of such a threshold is robust to many modeling details. It occurs in a wide variety of stochastic models that allow for realistic complexities such as heterogeneity in the thresholds for different units, or heterogeneous and time-varying numbers of neighbors for different units. 50 -52 The key feature driving the occurrence of bistability and a threshold between 2 basins of attraction for extinction versus self-sustaining activation of units in such models is that a unit is more likely to become activated when more of its neighbors are activated. This interdependence is realistic for phenomena ranging from spread of forest fires to epidemics, and we believe that it is also realistic for NLRP3-mediated spread of pyroptosis and lung inflammation.
To summarize this section, the inflammation model in equation (6) takes as input an initial level of inflammation, P(0), and produces as output a time course of subsequent inflammation levels, P(t), as illustrated in Figure 2. In the long run, initial levels of inflammation above a threshold T lead to a high chronic level of inflammation, E, as a stable equilibrium. By contrast, initial levels of inflammation below the threshold lead to resolution and 0 inflammation in the absence of further exposure. Although the time required to approach the long-run level (0 or E) can be arbitrarily long if the initial level is arbitrarily close to the threshold T, it is shorter for starting values far from T.
A PBPK Model for Internal Doses of RCS
To extend a model of lung inflammation to provide a dose–response model for RCS and lung cancer (or for other agents and diseases), it is necessary to embed the inflammation model between a front-end model describing how dose affects inflammation and a back-end model describing how inflammation affects lung cancer or other disease risks. This section describes a front-end PBPK model that takes RCS exposure histories as inputs and produces resulting time courses of inflammation levels as outputs. A later section develops a lung cancer response model that takes time courses of inflammation levels as inputs and produces resulting time courses of lung cancer risk as outputs.
Physiologically based pharmacokinetic (PBPK) models have previously been developed for RCS exposures and measures of resulting AM and neutrophil inflammation in the lungs of exposed rats and humans. 53 -55 Although these models preceded the elucidation of the role of the NLRP3 inflammasome, they provide useful descriptions of how RCS exposures affect resulting time courses of inflammation markers in the lung, consistent with considerable data from rat experiments and limited data in humans. 54
Figure 3 shows the structure of the main part of the PBPK model for RCS described and partly validated by Tran et al. 54 This figure uses standard visual conventions for systems dynamics modeling environments: Rectangular boxes represent compartments (“stocks”), thick arrows represent flows among compartments, thin arrows represent information about dependencies, circles represent constants or calculated quantities, and dashed circles represent quantities input or calculated from outside the part of the model shown in the diagram. All quantities are allowed to be time varying. Thus, Figure 3 describes a dynamic system in which dose (specified exogenously as a time series of concentrations of RCS in inhaled air) causes a flow of crystalline silica particles to the alveolar surface of lung; X 1 denotes the mass in mg of alveolar silica. (Surface area of deposited silica particles is a crucial aspect of internal dose, as discussed later.) From the alveolar surface, RCS is redistributed to AMs (X 2 = mg of silica burden in AMs), the interstitium (X 3 = mg of silica in the interstitium), and lymph nodes (X 4 = mg of silica in the lymph nodes). The RCS in AMs can be cleared by the mucociliary escalator or returned to the alveolar surface (eg, as is now understood, following pyroptosis of an AM). The RCS in the interstitium is eventually translocated to the lymph nodes, although the process is relatively slow.

Systems dynamics model diagram for a basic RCS PBPK model, adapted from Tran et al. 54 The diagram was created using the iThink software, www.iseesystems.com/. RCS indicates respirable crystalline silica; PBPK, physiologically based pharmacokinetic.
Table 1 summarizes the ODEs and rate constants describing these time-varying flows of RCS among the PBPK model compartments for low levels of exposure. The model described in Figure 3 and Table 1 can be downloaded as an iThink file (“RCS_PBPK_small.itm”) from http://cox-associates.com/CausalAnalytics/. The full PBPK model developed by Tran et al is considerably more complicated, in part because, at higher exposure levels, phagocytosis becomes impaired and several of the fractional rate constants in Table 1 (and in additional modules describing dose–dependent recruitment of macrophages and neutrophils, eventual fibrosis, and changes in oxidants and markers such as NF-κB) become dependent on the silica burden in AMs, denoted by X 2. As explained by Tran et al, 54
Human Lung RCS PBPK Model and Parameter Values, From Tran et al. 54

Abbreviations: AMs, alveolar macrophages; PBPK, physiologically based pharmacokinetic; RCS, respirable crystalline silica.
The AM-mediated defense of the alveolar region is effective (i.e. phagocytosis and clearance of silica particles by AMs are unimpaired) as long as the silica burden inside AMs (X
2) remain below a critical burden level (mcrit
). Once mcrit
is reached clearance quickly becomes impaired and an inflammatory reaction is switched on.
To understand how the time until acute inflammation is initiated depends on exposure concentrations, Figure 4 shows the trajectories for accumulation of silica loads in AMs (measured in mg, X 2 on the vertical axis) over time (measured in days on the horizontal axis) for different exposure concentrations, as predicted by the PBPK model in Table 1. As just discussed, this model ignores the accelerated rate of accumulation of RCS that occurs once the load exceeds m crit, and therefore the trajectories in Figure 4 are only meant to be descriptively accurate for X 2 values on the vertical axis that are no greater than m crit = 146.8. (Although, as discussed next, we do not believe that the part of the Tran et al PBPK model that describes what happens after inflammation is triggered is correctly specified, it is still useful for quantitatively estimating RCS accumulation until that point and hence for quantifying the time for X 2 to reach m crit, ie, the time until acute inflammation is triggered.) The concentrations are varied from 0.08 (curve 1, the lowest curve in Figure 4) to 0.18 mg/m3 (curve 11, the highest curve) in increments of 0.01 mg/m3.

Predicted time courses of silica load (mg) in AMs for 11 different exposure concentrations, 0.08 mg/m3 (curve 1) through 0.18 mg/m3 (curve 11), increments of 0.01 mg/m3. Predictions are made using the PBPK model in Table 1. The threshold level m crit = 146.8 mg for acute inflammation is reached only for exposure concentrations >0.13 mg/m3 (curve 7). Most exposures that achieve this threshold do so within about 3 to 6 months. AMs indicates alveolar macrophages; PBPK, physiologically based pharmacokinetic.
The main results from the PBPK modeling, as shown in Figure 4, are as follows: Exposures to sufficiently low concentrations of RCS in inhaled air (below about 0.13 mg/m3) do not trigger inflammation: The AM load accumulation curves flatten out below m
crit. Most exposure concentrations that are high enough to trigger acute inflammation (ie, that cause load curves that eventually exceed m
crit = 146.8) do so relatively quickly, within about 3 to 6 months, as shown by the times where the curves for X
2(t) cross the horizontal line X
2 = m
crit. For prolonged exposures to constant concentrations, the entire PBPK model acts as a multiplier, yielding a steady-state AM RCS load in mg equal to 1115.1 times the inhaled concentration of RCS in mg/m3. Thus, a threshold for the minimum concentration of RCS that can initiate acute inflammation when m
crit = 146.8 can be estimated as follows: m
crit/1115.1 = 146.8/1115.1 = 0.13 mg/m3. Even concentrations that are high enough to trigger acute inflammation (above about 0.13 mg/m3) do so only if exposure lasts for long enough (typically 3-6 months) for the curves to rise to exceed m
crit. Thus, there is a minimum duration of exposure necessary for an exposure concentration greater than 0.13 mg/m3 to trigger acute inflammation. This agrees with experimental data in rodents.
47
The threshold value m
crit is clearly similar to threshold T in Figures 1 and 2, insofar as both represent a critical threshold for inflammation. However, there are the following crucial differences between them. First, m
crit is for the onset of acute (neutrophil) inflammation as a response to internal dose (AM load) of RCS, while T is for the onset of chronic inflammation as a response to any stimulus that increases the level of inflammation. Second, although m
crit is a threshold for dose–dependent parameter values, it does not separate the basins of attraction for 2 different stable equilibria. No matter how detailed, complex, and well-validated for goodness-of-fit in describing experimental time course data it may be, any PBPK model in which parameter values depend only on RCS loads and inhaled RCS is eventually cleared implies that, after cessation of exposure, all parameters will eventually return to their initial levels. This contrasts with the bistability in Figures 1 and 2, where crossing threshold T implies that the system will move toward the new pathological equilibrium E and will never return to its initial (homeostatic) equilibrium, even if exposure ceases. Empirically, Human epidemiologic studies have found that silicosis may develop or progress even after occupational exposure has ended, suggesting that there is a threshold lung burden above which silica-induced pulmonary disease progresses without further exposure, and similar thresholds have been found for chronic inflammation and fibrosis in RCS-exposed rats at exposure concentrations and durations that do not cause lung overload.
14,47
The PBPK model in Table 1 was developed before the roles of the NLRP3 inflammasome and the importance of self-sustaining inflammation and bistability were well understood. Its focus on the load of RCS crystals in AMs (X 2) as the key driver for an inflammation threshold was an important and useful contribution, although in hindsight, it is probably not phagocytosis (or attempted phagocytosis) of RCS crystals by AMs per se but rather activation of NLRP3 inflammasomes in AMs in response to RCS crystals that is the rate-limiting step for the onset of RCS-induced NLRP3 inflammasome-mediated inflammation. 57 Despite their limitations for describing the time course of acute and chronic inflammation (below T and above T, respectively) after inflammation has been initiated, PBPK models such as the one in Table 1 are highly useful for relating concentrations of RCS in inhaled air to time courses of RCS loads in various compartments before inflammation begins and for predicting when and whether these loads reach specified levels such as m crit.
Once acute inflammation has been initiated, what happens next? The most usual outcome is that the acute, neutrophil-dominated inflammation runs its course and then resolves itself via a number of well-characterized mechanisms involving apoptosis and efferocytosis. 58 Porter et al 47 expressed concern that “relatively low silica exposures may pose a serious health risk because silica-induced disease, once initiated even at low threshold lung burdens, can progress even in the absence of further exposure” but noted that “However, the mechanism(s) responsible for the progression of silica-induced pulmonary disease, despite decreasing silica lung burden [after exposure ceases], remains to be established.” Figure 1 suggests a more reassuring answer, assuming that the mechanism of self-sustaining disease progression involves activation and propagation of ASCs and NLRP3 inflammasomes among cells (especially, AMs), as well as silica particle-induced LMP and pyroptosis (or necrosis) of macrophages. A sustained constant internal dose at a level high enough to induce inflammation (represented by c > 0 in equation (6)) shifts the S-shaped curve in Figure 1 upward (by an amount c/d). This, in turn, shifts rightward the left-most intersection between the 2 curves in Figure 1, which is at the origin when c = 0, creating a locally stable positive equilibrium level of inflammation. Because this is a stable equilibrium, nothing else happens as long as internal dose is not further increased: The new, low-level inflammation persists as long as internal dose continues to create local inflammation (eg, by RCS particles interacting with AMs and causing them to undergo inflammation and pyroptosis). Discontinuing exposure (so that c returns to 0) will cause the inflammation to return to 0. Only if exposure is increased and sustained so that inflammation exceeds threshold T will the system move into the basin of attraction for chronic inflammation. In short, because the left-most (homeostatic) equilibrium in Figure 1 is locally stable, inflammation will not spontaneously progress when exposure ceases, but will subside back down to 0. Self-sustaining inflammation and progression of inflammation-mediated diseases is only triggered by exposures that lead to inflammation greater than the threshold T. Low exposure concentrations of RCS (eg, below about 0.13 mg/m3 in Figure 4) do not even trigger acute inflammation, much less chronic inflammation, and thus, according to the model in Figure 1, they cannot initiate inflammation-mediated diseases that will then progress even after exposure ceases.
Sensitivity to Interindividual Variability and Physical and Chemical Properties of RCS
The following qualitative modeling conclusions are robust to scientific and modeling uncertainties and interindividual variability, in the sense that they do not depend on the specific parameter values or details of the models used: Prolonged exposure to a relatively low constant concentration of RCS leads to a steady-state level in each PBPK compartment that is approximately proportional to the inhaled concentration of RCS (eg, the steady-state burden of RCS in AMs, in mg, is about 1115.1 times the concentration of RCS in inhaled air in mg/m3). This direct proportionality is a consequence of the fact that internal pools of RCS increase until the amount cleared per unit time just balances the amount added per unit time from further inhalation of RCS. Hence, it holds independent of the details of the PBPK model used (eg, the number of compartments, how they are connected, and the fractional flow rate parameters governing rates of flow among them), although of course the specific numerical value of the constant of proportionality is sensitive to these details. This part of the model satisfies LNT assumptions. As a corollary, only exposure concentrations in excess of a certain threshold, maintained for at least a certain minimum duration, can cause the size of a given pool to reach or exceed a specified threshold size (eg, in Figure 4, only exposure concentrations greater than about 0.13 mg/m3 cause X
2 to eventually exceed m
crit, triggering neutrophil inflammation).
Because these properties do not depend on details of the models used, interindividual variability and uncertainty in parameter values and variations in physicochemical details of the RCS particles to which individuals are exposed do not change the conclusion that thresholds exist. However, such variations can alter the numerical values of the thresholds for different individuals and compositions of RCS. It is worthwhile to consider the plausible extent of resulting variability in threshold values.
Many studies have established that toxicity of specific quartz dusts is most strongly correlated with properties that affect the surface area (rather than the mass or volume) of the particles interacting with AMs and other lung cells. The specific quartz dust assumed in Table 2 is DQ12. Other quartz dusts vary widely in their potencies for eliciting various inflammatory responses and triggering LMP and activation of the NLRP3 inflammasome in AMs based on factors such as polymorphic type; freshly fractured versus aged surfaces; particle size, shape, and surface area; and the presence of iron or other substances (Clouter et al., 2001). 19,61 -66 For example, Clouter et al compared inflammatory responses in rats exposed to workplace samples of RCS to rats exposed to DQ12 and reported that
TSCE Model Equations, Functions, and Parameter Values for RCS-induced Lung Cancer.

Abbreviations: RCS, respirable crystalline silica; TSCE, 2-stage clonal expansion.
The workplace samples did not cause inflammation at any dose or time point [but] DQ12 quartz caused marked inflammatory responses, as measured by an increased number of neutrophils in the lungs of instilled animals for both time points and doses. Apart from quartz samples with an activity close to that of DQ12, one also finds examples with a very low activity.…Threshold effects in the range of 15 to ≥ 120 microg can be demonstrated” for the relatively sensitive TNF-α responses to different quartz dusts in in vitro tests.
19
Even for identical exposures to the same quartz dust, different individuals can form different burdens of RCS in AMs, reflecting differences in their individual PBPK or biochemical parameter values. This widens the range of RCS concentration thresholds that might trigger acute inflammation. Based on a Bayesian uncertainty and variability analysis that compared respirable dust loads found in lungs of autopsied coal miners in the United States and the United Kingdom to amounts predicted using a 3-compartment PBPK model similar to the one in Table 1, Sweeney et al
67
concluded that On average, the model predictions were within a factor of just less than 2 of the experimentally measured amounts of dust in lungs and lymph nodes. Almost all of the predictions for [individual] miners were within 10-fold of the measured values.
Mamuya et al
68
quantified exposure estimation errors for respirable dust and quartz dust (RCS) for individual workers in a coal mine by comparing the exposure estimates based on job teams to actual measurements based on personal dust sampling. They found that [R]atios of the 97.5th and 2.5th percentiles of the between-worker distribution of respirable dust exposure were relatively low, varying between 1.0 and 22.5 in the 8 job teams, while the analogous within-worker distribution varied between 2.2 and 3902.
Inflammation-Mediated Promotion of Lung Cancer in a TSCE Model
It has recently become well understood that chronic inflammation plays an essential role in promoting RCS-induced lung cancer 14,69 and other inflammation-mediated exposure-related lung cancers, in part by promoting cell proliferation and tumor formation. 70,71 However, to our knowledge, this qualitative understanding of the role of chronic inflammation has not yet been incorporated into quantitative mathematical models of carcinogenesis such as the TSCE model (Vineis et al 71 , Zeka et al 59 for silica- and asbestos-associated lung cancer 72 and for joint carcinogenicity of radon and silica). The purpose of this section is to develop a TSCE model for RCS-induced lung cancers that incorporates the promoting role of chronic inflammation.
Figure 5 shows the structure of a TSCE model for carcinogenesis using the same systems dynamics graphical notation as for the PBPK model in Figure 3. Table 2 lists the corresponding system of ODEs, which are determined directly from the diagram. Parameter values are drawn from the literature, as follows: a 1 = a 2 = 1.4E−7 is taken from McCarthy et al. 60 Table 1 for lung cancer initiation and promotion rates, respectively, in nonsmokers. g = g 0(1 + (1 − exp(−0.373E))) is the estimated functional dependency between exposure E and net proliferation rate g for initiated cells specified for RCS and lung cancer by Zeka et al 59 under the assumption that RCS exposure acts only as a promoter, increasing g but not the other parameters. Here, g 0 is the baseline (0-exposure) net proliferation rate for initiated cells, estimated as g 0 = 0.075 by McCarthy et al Table 1.

The TSCE models, also called MVK (Moolgavkar-Venzon-Knudson) models after the researchers who pioneered them, have been extensively developed and well described in many existing sources (eg, 59,60 ), along with careful discussions of how well their deterministic equations approximate the underlying stochastic processes. For our purposes, their most important features are that they provide excellent fits to many data sets, as illustrated in Figure 6 for the American Cancer Society CPS II data set for lung cancer hazard functions for nonsmoking men and women; and they can be used to predict the effects on lung cancer of exposures with different modes of action, such as increasing the first mutation rate (often called “initiator” carcinogens in the older literature, especially for skin cancer), increasing the net proliferation rate of initiated cells, for example, by increasing their division rates or slowing their apoptosis rates (“promoter” carcinogens), or increasing the second mutation rate (“progressor” carcinogens).

Comparison of observed data (points) and TSCE model predictions of age-specific hazard functions (top curve for men, bottom curve for women) in the ACS CPS I data set for nonsmokers. (“Knoke” is an additional, non-TSCE, model.) TSCE indicates 2-stage clonal expansion; ACS, American Cancer Society. Source: Reproduced from Figure 2 of McCarthy et al 60 ).
Of course, some carcinogens can act via multiple modes of action, represented by making 2 or more of the TSCE rate parameters a 1, a 2, and g functions of exposure. However, a recent review of mechanistic information for RCS-induced genotoxicity suggests that a much higher dose of RCS is required to reach a threshold for genotoxic effects than to reach a threshold for persistent inflammation in the rat lung, by a factor of 10- to 20-fold (2-4 mg vs 0.2 mg), and that carcinogenic effects of inhaled RCS are driven by inflammation, 14 consistent with earlier findings. 69 We therefore use the TSCE model in Table 2, in which exposure increases the proliferation of initiated cells by increasing the net proliferation rate, g, but has no significant direct effect on the mutation rates a 1 or a 2.
Lung cancer typically develops on a timescale of decades. On this timescale, exposure affects lung cancer risk primarily by inducing chronic inflammation of the lung, which then increases 1 or more parameters in the TSCE model. From this perspective, exposure-related increases depend mainly on (a) when chronic inflammation begins and (b) how much it increases age-specific hazard functions. We propose that the relation between exposure and risk on the timescale of decades can be usefully approximated as a jump in TSCE model parameters from their baseline levels to new, higher levels following chronic inflammation. This contrasts with the usual modeling assumption that risk increases smoothly with exposure as in the TSCE model in Table 2. 59 However, the following considerations suggest that a discontinuous jump may be more realistic than continuous dependence of risk on exposure. The underlying epidemiological data, 73 shown in Figure 7, do not indicate that lung cancer risk is increased by exposure levels below the highest category (≥5 mg/m3-years); to the contrary, they appear more consistent with a U-shaped (hormetic) relationship. As stated by Zeka et al, 59 “excess mortality based on 77 lung cancer deaths was found in association with cumulative crystalline silica equal or greater than 5 mg/m3-years (RR = 2.11, 95% CI 1.07 to 4.11…)”. (Median duration of employment was 5.54 years in this cohort, and mean cumulative exposure to RCS was 2.16 mg/m3-years, suggesting RCS exposure concentrations on the order of 2.16/5.54 ≈ 0.4 mg/m3). Even for the highest cumulative exposure category, the increase in lung cancer risk is barely significant (lower 95% confidence limit just above the no-effect line relative risk [RR] = 1), without adjustment for multiple testing. On the other hand, the TSCE model with continuous dependence of model parameter g on cumulative exposure to RCS substantially overpredicts observed RRs at high exposure concentrations. Using the model in Table 2, for example, the RR of lung cancer compared to background increases smoothly from 1 (no effect) to more than 7 as exposure concentration E increases from 0 to 2 mg/m3. But real-world RRs seldom exceed 2 to 3 and are commonly less than 2 even for the highest exposure categories. A recent meta-analysis of ECS-lung cancer associations found that

Relative risk (RR) of lung cancer (middle curve) for different levels of cumulative RCS exposure, with estimated upper and lower 95% confidence limits (top and bottom curves). The data points shown use the midpoint for each of the first 4 cumulative exposure interval (<0.5, 0.5-1.1, 1.1-2.1, 2.1-5 mg/m3) considered by Checkoway et al.
73
By repeating the pattern of doubling the previous midpoint, 7 mg/m3 is used to represent the highest cumulative exposure interval (
workers in the mining industry had the highest risk of lung cancer with a pooled SMR [standardized mortality ratio] of 1.48 (95% CI 1.18–1.86)…. The positive association between silica and lung cancer became weaker with increasing quality of the included studies, from 2.56 (95% CI 1.57–4.19) among SMR studies with an NOS [Newcastle-Ottawa scale for study quality] score of 1–3 to 1.24 (95% CI 1.01–1.52) in those with an NOS score of 7–9.
74
If it is assumed instead that g increases from its base value of 0.075 to a somewhat higher value such as 0.09 when and if occupational exposure triggers chronic inflammation, and then remains at this increased level (corresponding to the stable right-most equilibrium, E, in Figure 1), then these disagreements with data disappear. No excess risk occurs at exposure concentrations too low to trigger inflammation, but RRs remain in the observed range even for high-exposure concentrations. Figure 8 illustrates the increase in age-specific risk (hazard rate) of lung cancer mortality for workers with and without occupational exposure that induces chronic inflammation of their lungs at age 50, assuming that the effect of the inflammation is to increase g by 20%, from 0.075 to 0.09. (In Figure 8, ages are shifted leftward by 5 years compared to those in Figure 6 because, following Zeka et al, 59 we model the lag [latency] period between creation of a malignant cell and observed lung cancer as negligible. Assuming a positive lag before lung cancer mortality would shift the age axis rightward by the amount of the lag, which is 5 years in Figure 6.) Figure 9 repeats this exercise for ages at the onset of chronic inflammation ranging from 30 to 80 years in 5-year increments. The corresponding RRs of lung cancer mortality for exposed workers range from 1.00 (no excess risk) if inflammation is avoided to 1.6 if it begins at age 30. This range is consistent with observed RRs in populations occupationally exposed to RCS. 74 Thus, the proposed inflammation-mediated TSCE (I-TSCE) model with the background promotion proliferation rate g being increased by about 20% following the onset of chronic inflammation, and no other effects of RCS exposure on lung cancer, appears to provide a satisfactory fit to epidemiological data, showing no clear increase in risk for less-exposed workers and very limited increases in RRs even in the highest exposure categories. Of course, transient inflammation might also increase risk while it lasts, if it increases the proliferation rate g for initiated cells; data permitting, a refined analysis could model such transient increases in g. However, on a timescale of decades, simply approximating the effect of exposure on risk as a one-time increase in the value of g when chronic inflammation begins, ignoring the smaller contributions from transient inflammations, appears adequate for explaining the main qualitative and quantitative features of the data examined.

Age-specific hazard rates for lung cancer mortality with (upper curve) and without (lower curve) onset of chronic inflammation at age 50, assuming that the effect of inflammation on cancer risk is to increase g from 0.075 to 0.09.

Sensitivity analysis of increase in lung cancer mortality hazard rates with age versus age at which chronic inflammation begins (curve 1 = age 30, curve 11 = age 80, 5-year increments). Corresponding relative risks for lifetime probability of tumor vary from RR = 1 (no excess risk) for inflammation onset age = 80 to RR = 1.6 for inflammation onset age = 30 years. RR indicates relative risk.
Discussion and Conclusions: Implications for RCS Dose–Response Modeling
The inflammation model (Figures 1 and 2), PBPK model (Figures 3 and 4), and inflammation-based lung cancer model (I-TSCE model; Figures 5, 6, 8, and 9) have the following strong implications for exposure modeling and dose–response models. First, cumulative exposure (in units such as mg/m3-years) is not an appropriate exposure metric, despite its widespread use in practice (eg, 59,73 ). One reason is that it does not discriminate between many years of exposure to a concentration below the inflammation threshold (eg, at 0.75 × T in Figure 1) and half as many year of exposure to twice the concentration, which may be well above the threshold (eg, at 1.5 × T in Figure 1). A second reason is that, once chronic inflammation has been initiated, continued exposure plays no further role, at least in the simple I-TSCE model we have described. This modeling assumption may be too extreme for substances that exert toxic or immunosuppressive effects that modify the course and effects of inflammation. But the general point remains that exposure contributes to cancer risk differently before and after onset of inflammation. Standard exposure metrics such as cumulative exposure do not take this into account. Doing so raises challenges for statistical inference, since when and whether chronic inflammation begins for each individual is not typically recorded in industrial hygiene data sets. Thus, the times at which I-TSCE model parameters change are latent (unobserved) variables. For practical risk analysis, however, simple sensitivity analyses and bounds on risks, similar to Figure 9, can help to quantify plausible ranges of exposure effect sizes on risks.
Second, dose–response thresholds for inflammatory changes at the micro level of individual cells and organelles imply dose–response thresholds for inflammation in cell populations and tissues. We have reviewed how the existence of dose–response thresholds for AM inflammatory responses to RCS and other NLRP3 inflammasome-activating substances at the subcellular level is now firmly established on biological grounds, for example, from ultrasensitive switching in signaling via NF-κB and MAPK pathways to the nucleus to secrete NLRP3 protein filaments into the cytosol; switch-like cooperative polymerization of ASC and cooperative oligomerization in assembly of the NLRP3 inflammasome once concentrations in the cytosol exceed critical threshold levels; LMP and lysosome membrane rupture and release of cathepsins into the cytosol; receipt of signal 2 to activate the NLRP3 inflammasome; and pyroptosis and release of ASCs and activated NLRP3 inflammasomes into extracellular spaces, where they are taken up by, and activate inflammation in, nearby cells. We argued that such intracellular threshold mechanisms, which have been increasingly well elucidated by recent biochemical and biophysical research, create (probably heterogeneous) thresholds for activating AMs. These cell-level thresholds, together with transmission of inflammatory signals and elements (ASCs and inflammasomes) to neighboring cells, imply a corresponding exposure concentration threshold for triggering spread of self-sustaining chronic inflammation in cell populations or tissues (specifically, the administered concentration in inhaled air that produces a steady-state internal dose of RCS particles interacting with AMs in Figure 3 corresponding to inflammation level T in Figure 1). These concentration thresholds for causing chronic inflammation, in turn, imply concentration thresholds for increasing lung cancer risk in the I-TSCE model. Thus, the existence of dose–response thresholds for activating NLRP3-mediated inflammation at the intracellular level ultimately implies dose–response thresholds for lung cancer caused by NLRP3-activating agents such as RCS or asbestos.
Qualitatively, because the existence of thresholds in the inflammation and PBPK models does not depend on the precise numerical values of the various parameters involved, the fact that PBPK parameters and RCS properties vary around their nominal values (eg, the values shown for DQ12 quartz dust in Table 1) does not alter the conclusion that each individual has a threshold concentration for RCS exposures below which they do not increase risk of chronic inflammation or inflammation-mediated lung diseases such as fibrosis, silicosis, or lung cancer. Interindividual variability and heterogeneity in the inflammation, PBPK, and I-TSCE models do not smooth out the population dose–response function to create an aggregate population dose–response function that satisfies LNT assumptions. Rather, the existence of ranges of values for the steady-state levels of RCS in AMs in Figure 3 for any given RCS concentration in inhaled air, together with ranges of values for the inflammation thresholds in Figure 1 and the resulting times of onset of chronic inflammation in Figure 9, simply implies that there is an overall range of values for the RCS exposure concentration thresholds that increase risk of lung cancer in different individuals, as well as a range of values for the resulting increase in risk (eg, from RR = 1 to RR = 1.6 in Figure 9). The lower end of the RCS concentration range for increasing risk in different individuals is a population exposure concentration threshold below which population risk is not increased. Thus, it is ultimately intracellular thresholds for priming, assembling, and activating NLRP3 inflammasomes via signals 1 and 2 that prevent sufficiently small (or brief) exposure concentrations from increasing risks of inflammation and resulting diseases in exposed populations, and hence prevent LNT-like population dose–response relations from emerging from aggregation of individual dose–response relations.
Quantitatively, past PBPK models suggest possible lower bounds on RCS concentrations that can trigger acute (neutrophil-dominated) inflammation in rat lungs. These can be scaled to estimate corresponding thresholds in humans (eg, at around 0.13 mg/m3 in Figure 3 for DQ12 quartz dust, and about 1 mg/m3 for a dust with about one-eighth of the inflammatory potency of DQ12). Such acute inflammation responses are part of normal, healthy, self-resolving inflammation as a means of responding to and clearing RCS. Corresponding thresholds for triggering chronic (macrophage-dominated) inflammation—the numerical value of T in Figure 1—cannot be easily derived for humans from acute inflammation data in rats. If no clear excess risk of lung cancer is found at cumulative exposures less than about 5 mg/m3-years (Figure 7) among workers with a median exposure duration of 5.54 years, then average exposure concentrations below about 5/5.54, or about 1 mg/m3, may not increase lung cancer risk under past exposure conditions. Such averages do not reveal the concentrations required to cause chronic inflammation and increased lung cancer risk, however, since some individual RCS workers under past exposure conditions might have accumulated exposures 1 or more orders of magnitude greater than the estimated values for the job groups to which they belong. 68 If the excess risks observed among workers come primarily from those with the highest exposure concentrations, then the threshold RCS concentrations for causing chronic inflammation and excess risk of lung cancer could also be 1 or more orders of magnitude higher than calculations based on estimated values suggest, for example, more than 10 mg/m3 instead of less than 1 mg/m3. Almost all past risk assessments for RCS have ignored such exposure estimation error in fitting risk models, which can make even exposure-response relations with clearly defined, unique thresholds mistakenly appear to satisfy LNT assumptions. 76,77 To better estimate the exposure concentrations and durations needed for RCS to induce chronic inflammation, it will be essential to model individual exposure uncertainty and variability in future RCS risk assessments.
For QRA, uncertainty about true exposures may dominate other sources of uncertainty and variability in estimating the excess risk of lung cancer created by a given estimated exposure history. An estimated average exposure concentration such as 0.1 mg/m3 for years or decades might occasionally produce much higher exposures for an individual worker. 68 If enough such anomalously high-exposure events happen to occur closely enough together in time to trigger chronic inflammation, then lung cancer risk may be permanently increased, even though the threshold would never have been crossed had the variance around the mean concentration been smaller. Study designs and risk assessments that pair observed lung cancer mortality rates with estimated average cumulative exposure levels based on job exposure matrices or other dose reconstruction efforts, ignoring errors and interindividual variability around the estimated exposures (eg, 73 ), mistakenly attribute to the estimated average exposure concentration adverse effects that arise from such unmodeled variability. Hence, they can greatly overestimate the (possibly 0) risks from low concentrations. 76 To obtain more realistic guidance for protecting worker health, the PBPK model in Table 1 can calculate numerically how the distribution of daily exposure concentrations affects the probability distribution of the time to cross an internal dose threshold such as m crit. The I-TSCE model (Figure 9) quantifies the consequences for lung cancer risk of initiating chronic inflammation at different ages. Data are not yet available to quantify how many times greater the RCS concentration needed to trigger chronic inflammation is than the concentration required to trigger acute inflammation, but RCS exposure histories that avoid letting internal doses of RCS in macrophages cross the acute inflammation threshold m crit will also avoid initiating chronic inflammation.
The analysis in this article has several limitations. The modeling is deliberately very simplified; as noted in several places, detailed transients and stochastic fluctuations are ignored, and smoothed (mean-field) approximations on relatively long timescales are used throughout. This keeps the data requirements and modeling tractable, but at the cost of omitting potentially important interindividual variability of individual risks around the average-case values. Stochastic simulation or agent-based models could provide much more information about such variability than the deterministic ODE modeling and sensitivity analyses presented here (eg, Figure 9). In addition, the proposed model has not been thoroughly validated. Although it appears to explain some aggregate epidemiological data fairly well, and although the PBPK and TSCE submodels have been studied and validated as providing useful descriptions of other data sets, the integrated I-TSCE model with inflammation is, to our knowledge, new. It has yet to be applied and validated using diverse data sets (eg, for asbestos-induced lung cancer and perhaps mesothelioma) in addition to RCS; thus, at this stage, we regard it as a promising proposed approach, but in need of further application and validation. Finally, it is possible to model mechanisms of RCS-induced lung cancer without modeling the NLRP3 inflammasome-mediated inflammation mechanism emphasized here. For example, a previous model 49 describes an inflammatory mode of action in which prolonged exposure to high RCS concentrations activates overlapping positive feedback loops involving recruitment and activation of AMs and neutrophils, increasing levels of ROS and nitrogen species, increased levels of proinflammatory cytokines, and eventual increases in apoptosis and compensating proliferation of the alveolar epithelium. That model, which has considerable biological support, describes the sources and consequences of chronic inflammation in terms of feedback loops among cell populations and signals, without specifying how events within individual cells create and propagate inflammation. The NLRP3 inflammasome biology discussed earlier supplies these missing details, explaining how sustained RCS exposure leads to signaling to the AM cell nucleus, secretion of NLRP3 protein to the cytosol, intracellular assembly and activation of the NLRP3 inflammasome, secretion of mature IL-1β and IL-18, upregulation of other proinflammatory cytokines, recruitment of neutrophils and macrophages, increases in ROS, eventual lysosome rupture, pyroptosis, and propagation of activated NLRP3 and ASC specks between cells. Although the models are consistent, it is not necessary to understand or model the NLRP3-mediated events within and between cells to describe the interdependencies and positive feedback loops among cell populations and the chemokine and cytokine signals that they generate. The model in this article explains why sustained high exposures eventually lead to an inflammation “tipping point” beyond which inflammation spontaneously spreads (Figures 1 and 2), but dose–response models that simply accept this as an empirical fact and that do not seek to derive it from cell-level thresholds could be.
Although this article was focused on RCS as a case study, the NLRP3 inflammasome mediates inflammatory responses to many other agents, from viruses and bacteria 24 to radiation 78 to mineral fibers such as asbestos. 22 The bistability illustrated in Figures 1 and 2 does not depend on which particular substance activates the NLRP3 inflammasome. Rather, it reflects the fact that NLRP3 inflammasome assembly and activation in some cells, followed by pyroptosis and discharge of NLRP3 inflammasomes and ASC specks to the intracellular environment, makes induction of this same process in nearby cells more likely. In this sense, NLRP3-mediated inflammation is analogous to a contagious condition in a population (of cells); as in many models for contagious processes and epidemics, a threshold exists below which the contagion process moves toward a low-prevalence equilibrium and above which it moves toward a higher prevalence equilibrium level for the contagious condition (ie, NLRP3-mediated inflammation). This aspect of the model may be applicable to many substances other than RCS that act via NLRP3 inflammasome-mediated inflammation of various tissues.
In conclusion, the existence of dose–response thresholds for NLRP3 inflammasome-mediated diseases emphasizes the need and opportunity to protect worker health by reducing high exposures that can trigger chronic inflammation. This may not affect average exposure concentrations much (or, perhaps, at all), but it is probably essential to reduce risk of inflammation-mediated diseases such as RCS-associated lung cancer.
Footnotes
Acknowledgments
The author thanks Professor Ed Calabrese for the invitation and challenge of preparing a paper on biomathematical modeling implications of recent advances in inflammation biology for dose–response functions.
Declaration of Conflicting Interests
The author(s) declared no potential conflicts of interest with respect to the research, authorship, and/or publication of this article.
Funding
The author(s) disclosed receipt of the following financial support for the research, authorship, and/or publication of this article: Development of the risk modeling approach reported here was supported in part by the following contract research projects undertaken by the author’s employer, Cox Associates LLC: (1) A multiyear applied research program funded by the National Stone, Sand, and Gravel Association (NSSGA) in 2017 and 2018 on modeling the human health risks from respirable crystalline silica (RCS), elongated mineral particles, and asbestos, including a project to develop the integrated computational model of RCS pharmacokinetics, pharmacodynamics, and lung cancer risk presented here. (2) A collaboration with the George Washington University Regulatory Studies Center, supported in part by funding from the Searle Freedom Trust for applied research on “Improving the Economic and Scientific Analysis of Regulations.” All aspects of this article, including the research questions addressed, the methods developed and applied, and the conclusions reached, are solely the author’s, and no funder or third parties reviewed or commented on the work prior to its submission.