
Abstract
Cotton’s environmental impact due to high water, fertilizer, and pesticide use is a concern despite the rising demand for natural fibers; however, significant research on different natural fiber blends is lacking. This study aims to bridge this gap by conducting a comparative analysis of sustainable yarn blends. Six different natural cellulosic fibers, cotton, sisal, banana, flax, hemp, and jute were used to make two different yarn blends in 80:20 and 60:40 blend ratios. Fiber’s mechanical, structural properties were analyzed by using scanning electron microscopy, Fourier transform infrared spectroscopy and X-ray diffraction. Further yarn tenacity, yarn elongation, hairiness of the yarns, coefficient of variation of mass, and Imperfection Index were evaluated. Dunnett analysis is also used to identify notable variations between the yarn blends. The results showed that increasing the blend ratio of alternative fibers with cotton from 20% to 40% resulted in a decrease in the tenacity and breaking elongation of the yarn. This study developed 11 yarns by blending cotton with natural fibers (flax, banana, hemp, sisal, and jute) while blends like cotton/sisal showed potential for enhanced strength, most exhibited decreased tenacity, increased hairiness, and a higher imperfection index with higher blend ratio of alternative fiber.
Introduction
Textiles stand out as one of the most essential materials globally due to their indispensable role across various applications, contributing significantly to community welfare and societal health. Individuals encounter textiles in diverse forms, from clothing and household fabrics to industrial and technical uses, highlighting their pervasive importance throughout life. 1 A wide range of raw materials, structures, properties, and production techniques are employed in creating textiles, indicating that their development would be impractical without fibers. 2 Natural fibers are well-known for their biodegradable nature and lack of environmental pollution characteristics. Because of their exceptional comfort, advantageous mechanical characteristics, widespread availability in nature, affordability, acoustic qualities, and biodegradability, natural fibers are preferred over synthetic fibers. 3
Cotton, a natural textile fiber, is globally renowned for its widespread usage owing to its softness, breathability, biodegradability, comfort, and various other favorable properties. Cotton, historically vital, faces global production declines due to challenges like competition with higher-income biofuel crops and resource-intensive cultivation. 4 Cotton farming demands significant resources, with reports indicating that producing one ton consumes 290 kg of fertilizers, 6.0 kg of pesticides, and 2300 m³ of water. Approximately 100 million tons of cotton stalks are annually produced, often burned, leading to severe air pollution. Burning one-ton releases pollutants including 9.7 kg of particulate matter, 1400 kg of carbon dioxide, 95 kg of carbon monoxide, 3 kg of methane, and 7 kg of volatile organic compounds. 5
Therefore, the textile industry has been undergoing a significant shift toward environmentally sustainable practices in recent years. A key aspect of this transformation is the increasing adoption of natural, sustainable fibers, driven by growing concerns over the environmental impact of conventional textile manufacturing methods, especially the extensive reliance on 100% cotton. These alternatives not only offer sustainable solutions but also possess qualities akin to cotton, potentially reducing the environmental impact while maintaining the durability and esthetic appeal of textile products.6 –11 Despite the benefits and sustainability of alternative natural cellulosic fibers, they cannot be processed into yarn and fabric in pure form due to high imperfections and lower strength. Therefore, a key focus in sustainable textile innovation lies in the development and application of blends combining natural yarns. As yarn forms the foundational element in fabric production and dictates the functional attributes of the end-use textiles, these blends, incorporating fibers like flax, hemp, jute, sisal, and banana with cotton, present a unique opportunity to create eco-friendly and sustainable yarns.12 –14
These fibers were chosen for their sustainability, unique inherent properties, and relevance to market demand. They are biodegradable, eco-friendly, cost-effective, and abundantly available, with some, like banana and flax fibers, derived from agricultural waste. Their excellent mechanical and thermophysiological properties make them well-suited for blending with cotton, particularly for clothing applications. Blending these fibers with cotton creates versatile yarns with improved performance and eco-friendly attributes, catering to the growing demand for sustainable textiles. For instance, hemp fiber is known for its superior strength and resilience compared to other natural fibers like cotton, flax, and nettle, making it a cost-effective and eco-friendly option for a wide range of textile products.15 –18 Flax, or linen, is valued for its durability and high tensile strength, suitable for heavy-duty applications like upholstery. Its excellent moisture absorption qualities also make it ideal for household textiles and apparel. Jute, the “golden fiber,” is celebrated for its strength, biodegradability, and affordability compared to other natural fibers. It offers versatile applications in textiles, packaging, and construction, combining durability with environmental sustainability.19 –21 Sisal fiber stands out for its strength and abrasion resistance, while banana fiber is gaining popularity for its strong tensile strength, softness, and moisture absorption, making it an excellent cotton alternative.22 –31
Several studies have examined the potential of natural fibers in various blends, investigating different blend ratios and their effects on yarn properties.32,33 Goudar and Kulloli examined blending flax fiber with cotton in varying proportions (40:60, 30:70, and 20:80) on a ring frame to create blended yarns, alongside spinning pure flax and pure cotton yarns for comparison. Results demonstrated that pure cotton fiber yielded the highest yarn count compared to pure flax and blended yarns. The 30:70 and 20:80 flax/cotton blended yarns exhibited superior yarn properties compared to the 40:60 blend. Moreover, both pure cotton and pure flax yarns exhibited higher strength and lower hairiness percentage compared to the blended yarns. In a study, researchers have examined the properties of fabrics obtained through blending jute with cotton and viscose. Their findings suggest that a blend comprising 30% jute, 40% cotton, and 30% viscose exhibits superior qualities, such as cost-effectiveness, when compared to other ratios. The blending of jute and viscose not only enhances color, luster, and softness but also improves weaving efficiency and diminishes imperfections.34,35 Ahirwar and Bahera 36 examined the esthetic and low-stress mechanical properties, as well as the handle value of plain-woven fabrics blending hemp and cotton in ratios of 70:30 and 50:50. Linear density compact and ring yarns of 16Ne and 30Ne were generated and employed in the production of plain-woven suiting and shirting fabrics, respectively. Blended fabrics showed enhanced durability, resilience, and rigidity, with increased surface friction and roughness compared to pure cotton. Meanwhile, 50:50 cotton-hemp blends exhibited higher crispness, particularly suitable for summer suiting and shirting.
Research on jute-cotton blends has also been conducted, exploring various blend ratios and their suitability as a cotton alternative. Some studies have explored the production of rotor-spun yarns ranging from 30 to 80 tex by blending modified jute with cotton fibers in a 20:80 ratio. Findings indicate that increasing opening roller speed up to 8700 rpm initially boosts yarn tenacity and elongation%, while reducing unevenness and imperfections. However, yarn tenacity decreases, and unevenness increases with higher rotor speed.37 –40 Studies have also examined the physical and mechanical properties of fabrics made from jute and banana yarn, 41 the blending of etherified jute fibers, 42 and different jute-cotton yarn blends.43,44 However, most research on sisal has been limited to its use in composites.45,46
Numerous studies have explored the blend of cotton with natural fibers like flax, hemp, banana, and jute, and analyzed the effects of different blend ratios and yarn counts on mechanical properties. However, there is currently no research available on developing blended yarns consisting of cotton with hemp, flax, banana, jute, and sisal fibers under identical parameters and comparing their properties to determine the optimal blend ratio and natural fiber for use with cotton. Therefore, this study aims to develop yarns in two distinct blend ratios (80:20 and 60:40) with a combination of cotton, banana, flax, hemp, jute, and sisal fibers. The blended yarns were evaluated for tenacity, elongation, coefficient of mass variation, hairiness, and total imperfections. Additionally, the results were statistically analyzed using one-way analysis of variance (Dunnett) to identify the most suitable blend ratio and fiber combination for clothing textile applications.
Materials and methods
Materials
Six different natural fibers, including flax, hemp, banana, jute, cotton, and sisal were used for yarn production. The banana, flax, sisal, and cotton fibers were locally sourced from Pakistan, while flax and hemp fibers were imported from China. Banana, sisal, and Jute fibers underwent a chemical treatment process with the exception of cotton, flax and hemp. Specifically, these fibers were subjected to a degumming process. The fibers were treated with sodium hydroxide (NaOH) 10% concentration for 1 h at 90°C. NaOH is most commonly used to treat bast fibers to make them spinnable as per literature. Then the fibers were washed and dried at room temperature. 47
The mechanical properties of the six fibers – cotton, hemp, banana, jute, flax, and sisal – are given in Table 1. Table 2 presents the physical properties of cotton fiber in detail.
Physical and chemical properties of fibers.

Physical properties of cotton and other cellulosic fibers.

Methodology
To explore the effect of fiber blending, two distinct fiber blend ratios were employed in yarn development, the specifics of which, including their respective code names, are listed in Table 3. The yarns samples were developed using a lab-scale spinning line. Blending ratios were selected based on literature. When the blend ratio of fibers is increased beyond 40%, it negatively affects the properties of the resulting yarn. To avoid this deterioration in yarn properties, the study chose to focus on blend ratios of 20% and 40%, likely because these ratios were found to maintain better or acceptable yarn properties compared to higher ratios. 14
Particulars of yarn samples.
The process commenced with the blending of fibers in their predetermined ratios of 80:20 and 60:40 as given in Table 3. Fiber mixing was done manually. After blending, the fibers were processed through a Trutzschler-1992 blow room for lap formation. The blow room was used for mixing and lap formation. Each lap had a weight specification of 12 oz per yard.
Following the lap formation, the lap sheet was channeled through a Howa-CM80 carding machine, to create a carded sliver, which was precisely measured at 5.66 g/m. The carded slivers were then advanced to a Rieter-RSBD-40 for further processing. At this stage, the output sliver for the pre-drawing phase was set to be 4.96 g/m, and for the finisher phase, the specifications were set to 4.60 g/m.
The draw frame settings were meticulously adjusted for optimal fiber alignment and uniformity. For the pre-drawing phase, the draft setting was configured to 6.857 with a break draft of 1.28. Similarly, for the finisher phase, the draft setting was adjusted to 6.46, maintaining the same break draft of 1.28.
Post-drawing, the slivers were transferred to a Schlafhorst-Se8 rotor spinning machine for the final yarn formation. Rotor spinning provides more flexibility in blending different kinds of fibers together in different ratios. It is also more suitable for processing the coarser fibers as used in this study. The twist per meter was set at 968 to produce a yarn count of 20s. This was complemented by a twisting gear configuration of Z1 = 23 and Z2 = 39, and a drafting gear arrangement of Z3 = 19 and Z4 = 38. It is important to note that all yarn samples maintained a consistent count of 20Ne. Machines with manufacturers used for yarn production are given in Table 4. To provide a comprehensive overview of the yarn preparation process, a detailed flow chart is presented in Figure 1.
Machines with manufacturers for yarn production.

Flow chart of the process for yarn development.
Characterization
X-ray diffraction (XRD) analysis was conducted utilizing a Philips XRD testing apparatus to ascertain the crystalline structures of the fiber samples after treatment. The intensity of the diffracted rays was measured across a 2θ range spanning from 10° to 50°. To quantify the crystallinity index of each fiber, the OriginPro software suite was employed. This index was derived by evaluation of the peak areas corresponding to both crystalline and amorphous regions within the XRD spectra. This analytical approach facilitates a precise determination of the degree of crystallinity, which is essential for understanding the material properties of the fibers. The SEM images were taken from scanning electron microscope.
Fourier transform infrared (FTIR) analysis was conducted unitizing a Spotlight 400 testing apparatus. The chemical nature of all cellulosic fibers was observed after treatment with FTIR technique in the range of 500–4000 cm−1 range.
The tensile strength of the fibers was measured using a single fiber strength tester (M250-2.5CT Testometric, Rochdale, England), following ASTM D3822 standards. Prior to testing, the samples were preconditioned according to ASTM D1776. For the assessment of mechanical properties of yarns, the Tensorapid tensile testing machine was used to evaluate yarn tenacity and elongation in accordance with ASTM-2256. Furthermore, yarn uniformity, hairiness, and the total imperfection index were measured using the Uster-5 tester, in accordance with the ASTM D 1425 standard. All the testing procedures were conducted under controlled standard atmospheric conditions, as stipulated by ISO 139, to ensure consistency and reliability of the results.
Results and discussion
X-ray diffraction
XRD was employed to determine the crystalline structure of the fibers that provided insights into the cellulose content and crystallinity, which impact the yarn’s strength, elasticity, and dyeability. Figure 2(b) illustrates the XRD Intensity peaks of cotton, sisal, banana, flax, hemp and jute. The Y-axis represents the intensity peaks while X-axis represents the 2θ values from 10° to 50°. It can be observed from the figure that all fibers exhibit peaks in the range of 15° to 25°. Each peak corresponds to planes of atoms in the fibers that diffract the X-rays. The position of each peak along X-axis can be used to identify the fiber’s phase and crystalline structure. Each fiber shows specific peaks, characteristics of its crystalline structure. The numbers in parentheses (e.g. (300), (390)) correspond to the Miller indices, which are a notation system in crystallography for planes in crystal (lattice) structures.

(a) crystallinity index of all the natural fibers used for blending in the development of yarn and (b) XRD spectra of cotton, sisal, banana, flax, hemp and jute fibers.
Cotton fibers exhibit two sharp peaks at 14.53° and 22.57°. Sisal fibers exhibit the highest number of peaks and new phases formed at 14.83°, 21.64°, 23.85°, 29.18° and 45.17°, suggest that sisal has a complex structure with multiple crystalline forms. This may affect its mechanical properties and could be exploited in applications where varied structural characteristics are beneficial. Banana fibers exhibit two sharp peaks at 15.48° and 22.17°. Flax fibers show the highest intensity peaks at 15.06° and 22.49°. Hemp fibers show two peaks at 14.85° and 21.98°. Jute fibers exhibit two peaks at 14.93° and 21.66°. From XRD results it can conclude that sisal shows highest number of new phases and is more crystalline in nature. The presence of the highest number of peaks in Sisal at specific 2θ values, suggests that sisal has a complex structure with multiple crystalline forms. This may affect its mechanical properties and could be exploited in applications where varied structural characteristics are beneficial. The crystallinity index of all fibers calculated from the XRD peaks is represented in 2a. Cotton shows the highest crystallinity index (67%), followed by flax (65%), hemp (60%), sisal (54%), jute (49%) and banana (48%). For industrial applications, such as textile manufacturing, crystallinity and phase information can guide the choice of fiber for specific end-uses. For example, higher crystallinity fibers like cotton and flax might be more suitable for durable clothing, whereas sisal, with its varied phases, might be better for specialty composites. The crystallinity index of all fibers calculated from the XRD peaks is represented in Figure 2(a). Flax and cotton show highest crystallinity index% and high intensity peaks.
Fourier transform infrared (FTIR) analysis
FTIR is one of the most effective analytical methods for identifying the functional groups found in a variety of chemical compounds. By using this technique on cellulose-based fibers, such as cotton, sisal, banana, flax, hemp, and jute, a detailed analysis of their molecular composition is feasible that contribute to properties like moisture absorption, dyeing behavior, and biodegradability. 50
The FTIR spectra of the tested fibers, including cotton, sisal, banana, flax, hemp, and jute, reveal characteristic peaks associated with their respective compositions is shown in Figure 3 and the comparison of peaks at different wavenumbers for each fiber is given in Table 5. All fibers show substantial O-H stretching vibrations in the IR range of 3000–4000 cm−1 as shown in Figure 3, which is suggestive of the presence of hydroxyl groups. Furthermore, there are peaks associated with C-H stretching, C-H bending, and C=C stretching vibrations in the infrared region between 1500 and 3000 cm−1. These observations suggest that the fibers contain aliphatic and potentially aromatic compounds typical of cellulose found in natural fibers. In addition, peaks in the 500–1500 cm−1 range represent C–O stretching vibrations linked to glycosidic linkages in cellulose, a common constituent of plant fibers. While the peaks in this range that correspond to C-H bending vibrations highlight the aliphatic nature of these fibers. The presence of these characteristic peaks in the FTIR spectrum is valuable for confirming the identity of the cellulose-based material and provides information about its chemical structure. These structural differences contribute to the unique mechanical properties of each fiber, such as tensile strength, flexibility, and water absorption capacity.

FTIR spectra of cotton, sisal, banana, flax, hemp and jute fibers.
FTIR wave numbers and corresponding functional groups of natural fibers.

A broad band is observed in the infrared region (4000–3000 cm−1) for all tested fibers, which is mainly explained by the OH-stretching vibrations resulting from hydrogen bonding in cellulose. It is specifically the intra-molecular hydrogen bonding that is responsible for the peak that can be found at Cotton:3320, Sisal: 3325, Banana: 3332, Flax: 3318, Hemp: 3335, and Jute: 333 cm−1. 51 Several distinctive peaks are seen in the infrared region (IR) between 1500 and 3000 cm−1 for all tested fibers. Peaks in the 1500–3000 cm−1 range are indicative of C–H bending and C=C stretching vibrations. The consistent presence of aliphatic C–H stretching vibrations, which are indicative of organic compounds can be observed at Cotton: 2934, Sisal: 2933, Banana: 2938, Flax: 2933, Hemp: 2936, and Jute: 2935 cm−1. While peaks at Cotton: (1442, 1612), Sisal: (1446), Banana: (1442, 1612), Flax: (1446, 1612), Hemp: (1297), Jute: (1263) indicate C–H bending and C=C stretching vibrations. 52 A range of distinctive peaks are visible in the infrared (IR) range of 500–1500 cm−1. Peaks found in Cotton: 1008, Sisal: 1017, Banana: 1005, Flax: 1005, Hemp: 1005, Jute: 1006, indicate C–H bending vibrations, highlighting the aliphatic character of these fibers. Peaks found at Cotton: 622, Sisal: 638, Banana: 670, Flax: 622, Hemp: 681, Jute: 625 range, which represent C–H bending vibrations, also serve to emphasize structural arrangements inside the fibers. Presence of C–O stretching vibration-related peaks, especially in the 1116–1167 cm−1 range, confirms that cellulose, a key component of plant fibers, contains glycosidic linkages.
Scanning electron microscopy (SEM)
SEM was used to visualize the surface morphology of the fibers and the yarn to assess the distribution and adhesion of the different fibers within the yarn, indicating the effectiveness of the blending process. Figure 4 Represents the microscopic and SEM images of all these natural fibers. The leftmost images were taken with an optical microscope, which show the fibers at lower magnification. These images reveal the general structure, thickness, and arrangement of the fibers. The middle images were captured using a scanning electron microscope (SEM) at a lower magnification, to provide a detailed view of the fiber surface morphology, revealing textures and patterns that are not visible with optical microscopy. The rightmost images were taken with SEM at a higher magnification. These images show the microstructural details of the fibers, such as the fibril arrangement, the roughness of the fiber surfaces, and any micro-scale defects or features.
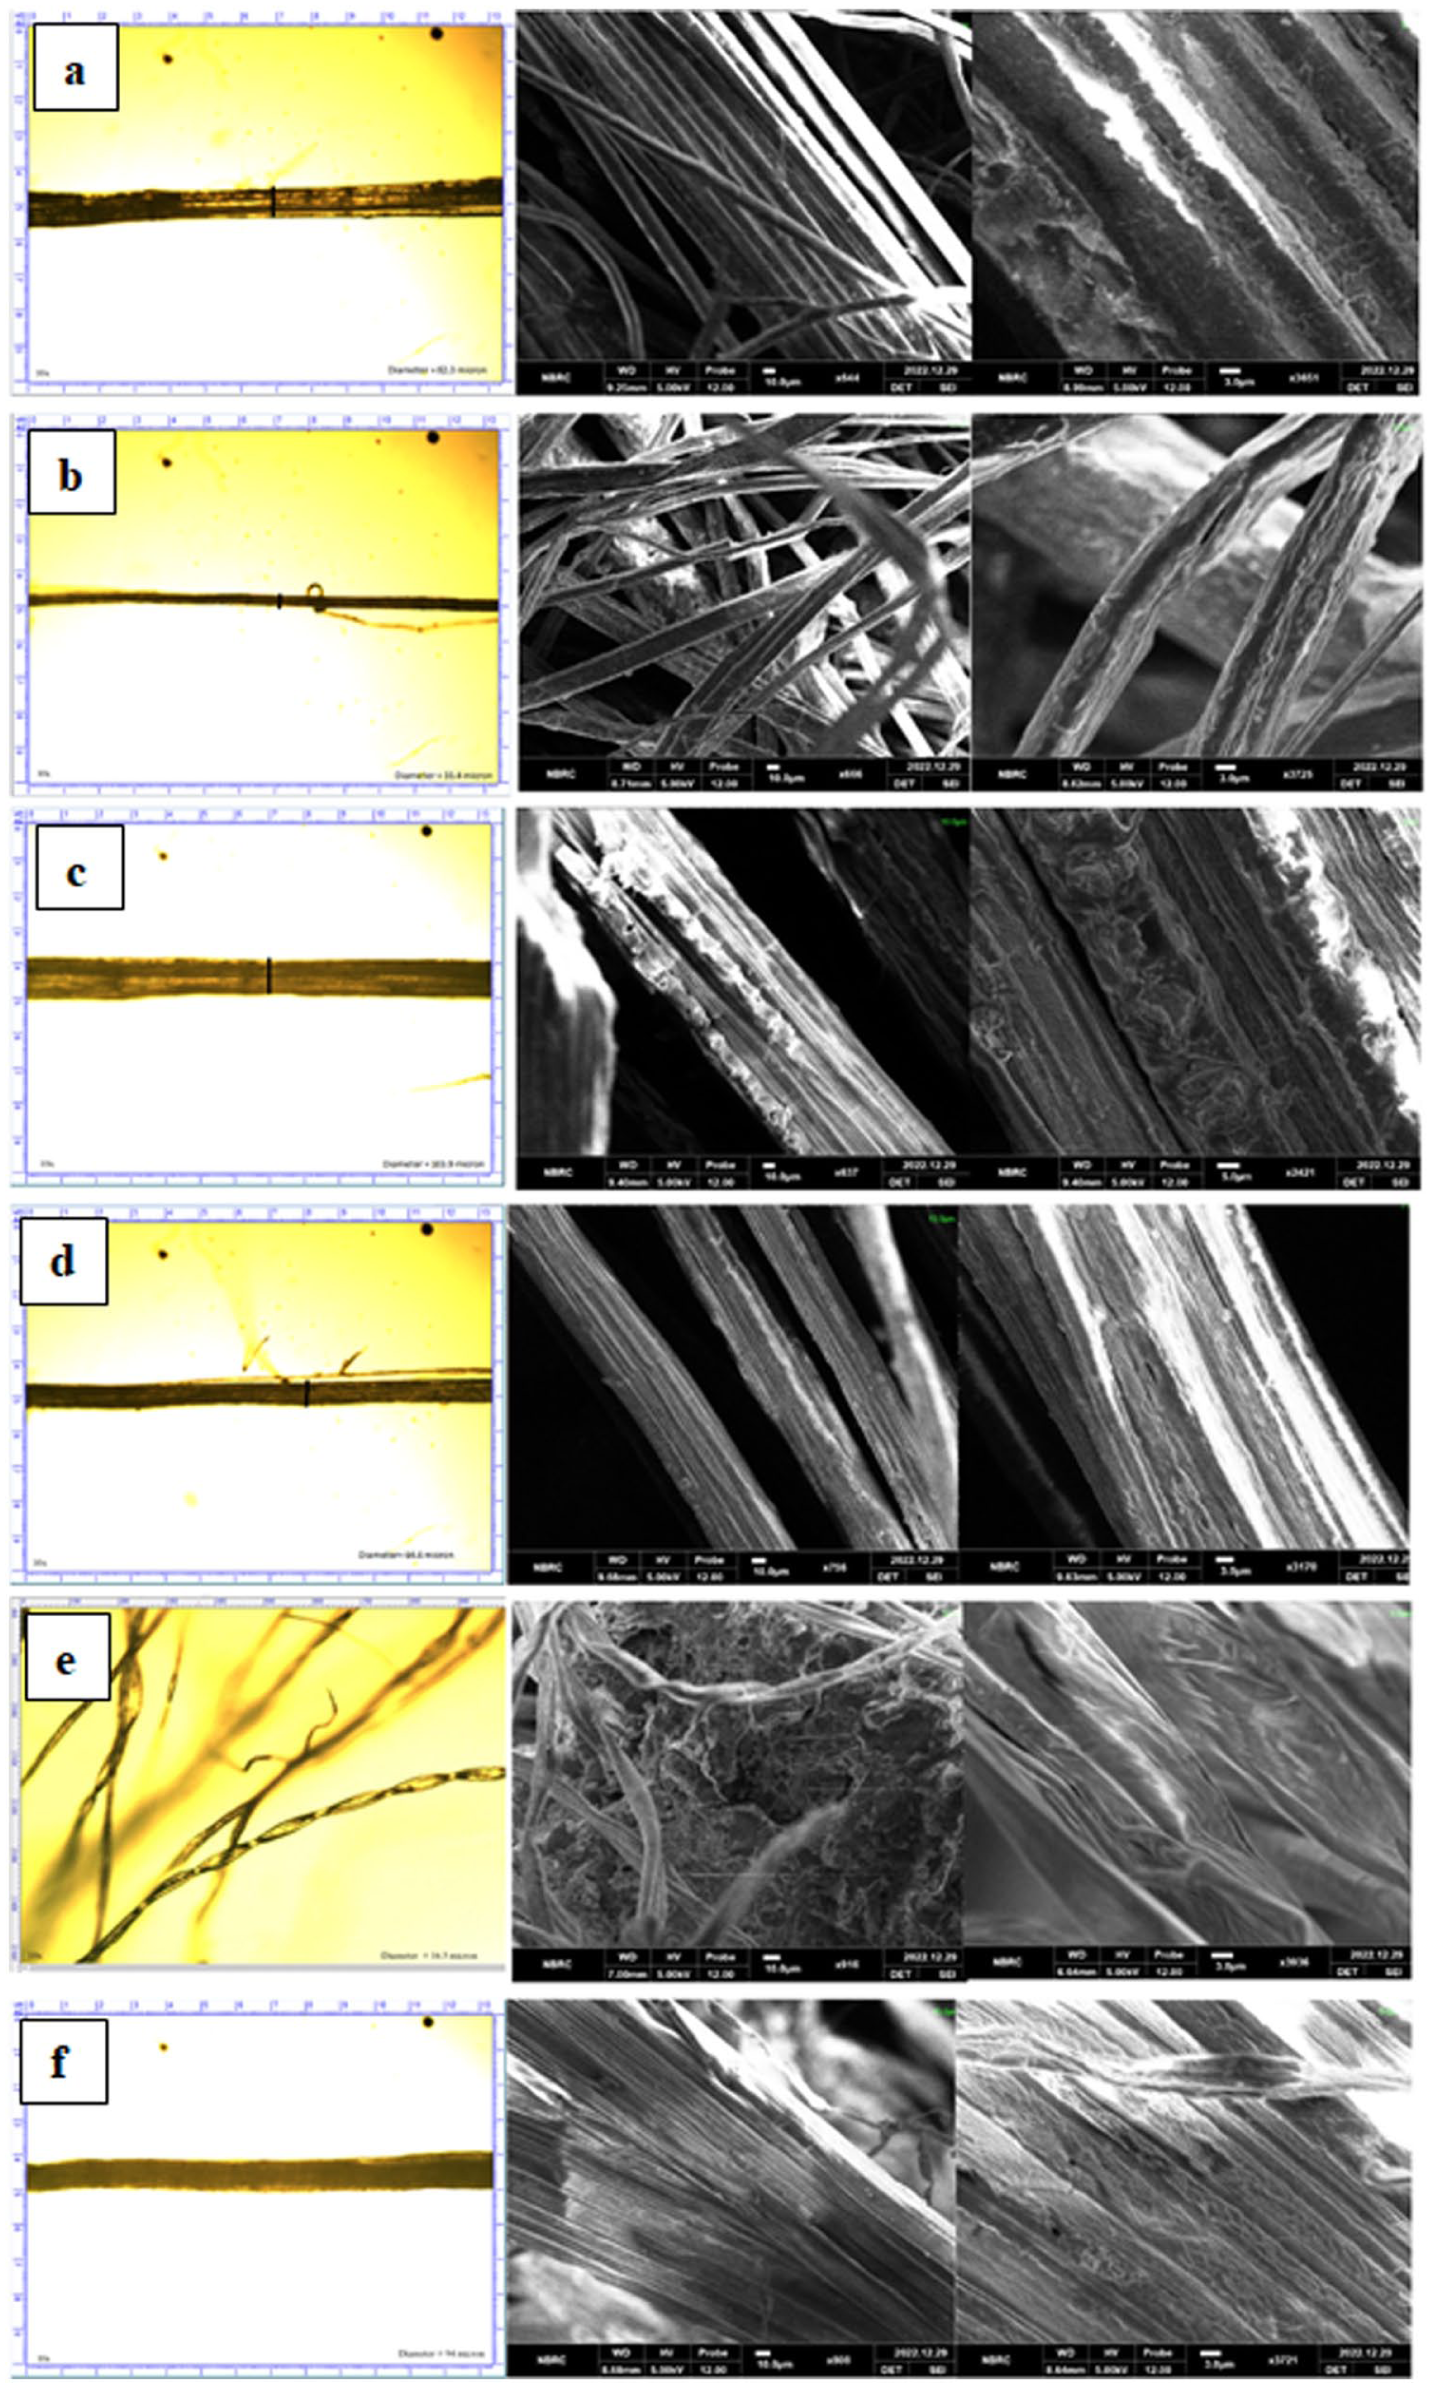
Microscopic and SEM images of (a) flax, (b) hemp, (c) banana, (d) jute, (e) cotton, and (f) sisal.
The flax images show the smooth, longitudinal striations characteristic of flax fibers, which are known for their strength and used in linen. The hemp fibers display a similar structure to flax but with more pronounced grooves and ridges, indicating a rougher surface, which can affect the fiber’s properties. The banana fibers have a more irregular surface compared to flax and hemp, which might be due to the presence of more lignin and other non-cellulosic components. The jute fibers exhibit a rough surface with visible dislocations or nodes along the fiber, which are typical of jute. Cotton fibers have a distinctive flat, ribbon-like structure with a high twist, which is responsible for its softness and flexibility. Sisal fibers appear to have longitudinal striations, less pronounced than the flax.
Tenacity of the yarns
Tenacity, a critical indicator of the strength and durability of materials, serves as a pivotal metric of yarn quality. In this study, tenacity was a focal parameter in evaluating our blended yarn samples. This characteristic is influenced by a myriad of factors including the types of fibers selected, their compatibility and proportions in the blend, and the specific methods employed in spinning and twisting. 53 Figure 5(a) illustrates the Tenacity (cN/tex) of yarn made only from cotton fibers and the yarns made from cotton blended with other fibers in 80:20 and 60:40 blend ratios. The vertical columns represent the average Tenacity (cN/tex) values, while the error bars indicate the standard deviation showcasing the variability in Tenacity (cN/tex) among the samples.

(a) Tenacity (cN/Tex) results for the different blended yarn samples. (b) Dunnett analysis (tenacity) of 80:20 blend ratio samples in comparison with cotton. (c) Dunnett analysis (tenacity) of 60:40 bled ratio in comparison with cotton.
Cotton yarn serves as a reference, with its average tenacity value of 10.61 cN/tex. The average tenacity of the 80:20 blend of cotton/hemp, cotton/banana, cotton/jute, cotton/flax, and cotton/sisal were 8.9, 9.85, 10.30, 8.09, and 11.34 cN/tex respectively. The average tenacity of the 60:40 blend of Cotton/hemp, cotton/banana, cotton/jute, cotton/flax and cotton/sisal were 8.03, 8.85, 10.06, 7.60, and 11.02 cN/tex respectively. The results clearly indicate that the increase in fiber ratio of banana, jute, flax and hemp fiber from 20% to 40 % resulted in the decrease of yarn tenacity. Banana, jute, flax, and hemp fibers are coarser and nonuniform fibers compared to cotton fibers. The yarn may become weaker because of an unequal stress distribution caused by the presence of non-uniform fibers in the blend and fiber length disparities.32,54 During yarn spinning, the varying physical properties of different fiber types lead to distinct interactions with cotton fibers. These differences require careful optimization of spinning parameters to account for divergent fiber behaviors and achieve optimal blending performance. The variation in the fiber characteristics requires adjustments in production parameters for yarn development. The mixing of other fibers with cotton can be done up to a certain percentage at the same production conditions. 55 Above that percentage level, the yarn characteristics can be negatively affected as indicated in 5a. In descending order, the tenacity values of the blended yarn samples were Cotton/Sisal > Cotton/Jute > Cotton/Banana > Cotton/Hemp > Cotton/Flax in both 80:20 and 60:40 blend ratios. The results also indicate that the cotton/Jute and cotton/sisal 80:20 samples had comparable yarn tenacity (i.e. 10.3 and 11.34 cN/tex respectively), with the 100% cotton yarn sample.
Dunnett’s analysis shown in Figure 5(b) and (c) reveals that Flax-cotton blended yarn had significantly lower tenacity as compared to 100% cotton yarn. The findings agree with previous studies.56,57 Cotton-Flax yarn had significantly lower strength while Sisal-cotton yarn had significantly higher strength. Because the physical properties of flax and cotton fiber naturally differ, blended yarns frequently have less tenacity than pure cotton yarns. During the spinning process, the longer flax and hemp fibers might not align perfectly with the softer and shorter cotton fibers. These differences in fiber properties cause processing variations in the blended yarn with less structural integrity. Because of these factors, the blend tends to have a lower tensile strength than a yarn made from 100% cotton fibers, even though it may still have other desirable properties like increased durability or texture.
Sisal fibers are derived from the leaves of the agave plant and are known for their strength and durability. When blended with cotton, which is softer and has shorter fibers, sisal enhances the overall tensile strength of the yarn. As a result, the tenacity of a cotton/sisal blended yarn is often higher than that of pure cotton yarn. By adding durability to the yarn structure, the stronger sisal fibers help to overcome some of the shortcomings of pure cotton yarn. The synergy of the blending process produces a yarn with enhanced tenacity, which makes it suitable for uses where greater strength and resilience are required, like manufacturing specific technical textiles or composite structures.
Breaking elongation of the yarns
The breaking elongation of the rotor spun blended yarn samples mainly depends upon fiber characteristics, spinning process and environmental conditions. Fiber characteristics include fiber type, blend ratio, fiber length, fiber fineness and fiber flexibility.58,59 Different fibers have different elongation properties, and blend ratio determines the overall elongation of the yarn. Moreover, finer fibers result in a more uniform and closely packed structure. In the spinning process, rotor speed, drafting tension, yarn twist level, temperature and humidity directly influence the yarn elongation. Higher rotor speed, higher drafting tension and higher twist level reduce the yarn elongation.60,61
Figure 6(a) illustrates the breaking elongation (%) of yarn made only from cotton fibers and the yarns made from cotton blended with other fibers in 80:20 and 60:40 blend ratios. The vertical columns represent the average elongation (%) values, while the error bars indicate the standard deviation showcasing the variability in elongation (%) among the samples. Cotton yarn serves as a reference, with its average elongation value of 5.08%. The average elongation of the 80:20 blend of cotton/hemp, cotton/banana, cotton/jute, cotton/flax, and cotton/sisal were 4.95%, 5.59%, 5.50%, 4.22%, and 5.81% respectively. The average elongation of the 60:40 blend of cotton/hemp, cotton/banana, cotton/jute, cotton/flax and cotton/sisal were 4.41%, 5.32%, 5,73%, 4.55%, and 6.47% respectively. The possible reason is that breaking elongation results indicate that fiber type and blend ratio significantly influence yarn extensibility. Cotton/sisal and cotton/banana blends showed increased elongation due to the natural flexibility and extensibility of sisal and banana fibers. In contrast, blends with flax and hemp exhibited reduced elongation, attributed to their stiff and brittle nature, which limits yarn stretchability. The decline in elongation with higher flax content is consistent with earlier studies, confirming that rigid fibers reduce overall ductility in blended yarns. A previous study found a decrease in elongation with an increase in flax percentage in cotton blend. 57

(a) Elongation (%) results for the different blended yarn samples, (b) Dunnett analysis (elongation) of 80:20 blend ratio samples in comparison with cotton, and (c) Dunnett analysis (elongation) of 60:40 bled ratio in comparison with cotton.
Figure 6(b) and (c) shows that the cotton/banana, cotton/jute and cotton/sisal had higher elongation values than the controlled sample. These natural fibers are more extensible and flexible because of their higher elongation at break (cotton 5.4%, Banana 15%, Sisal 16%, and jute 43%). Because flax and hemp are less elastic than cotton, they reduce the stretchability of the blended yarn before breaking.
Coefficient of variation of mass (CVm)
The degree of variance or fluctuation in the mass of individual yarn units within a given sample or batch is referred to as mass variation in yarn. Usually, yarn is made with a target mass, or weight, per unit length. However, the actual mass of individual yarn units may vary due to a variety of factors in the spinning and production processes. One typical metric used to measure this variability is the coefficient of variation of mass (CVm). It is computed as the percentage of the mean mass divided by the standard deviation of the mass of yarn units.62,63 Less mass variation is indicated by a lower CVm, which points to greater yarn homogeneity. On the other hand, a higher CVm denotes more mass variability. In the production of textiles, controlling mass variation is critical, particularly in applications where consistency is required, such as the creation of high-quality fabrics or clothing. Yarn having stable mass properties improves the overall performance and quality of the textile product. Manufacturers can decrease mass variation and achieve client expectations by implementing quality control techniques and modifications in the production process. 64
Figure 7(a) illustrates the CVm (%) of yarn made only from cotton fibers and the yarns made from cotton blended with other fibers in 80:20 and 60:40 blend ratios. The vertical columns represent the average CVm (%) values, while the error bars indicate the standard deviation showcasing the variability in CVm (%) among the samples. Cotton yarn serves as a reference, with its average CVm value of 14.93%. The average CVm of the 80:20 blend of cotton/hemp, cotton/banana, cotton/jute, cotton/flax, and cotton/sisal were 18.52%, 15.17%, 16.35%, 18.78%, and 15.21% respectively. The average CVm of the 60:40 blend of Cotton/hemp, cotton/banana, cotton/jute, cotton/flax and cotton/sisal were 21.79%, 16.97%, 17.70%, 23.04%, and 16.53% respectively. The results clearly indicate that, increase in fiber ratio of banana, jute, flax and hemp fiber from 20% to 40 % results in the increase of yarn CVm value.

(a) CVm% results for the different blended yarn samples, (b) Dunnett analysis (CVm%) of 80:20 blend ratio samples in comparison with cotton, and (c) Dunnett analysis (CVm%) of 60:40 blend ratio samples in comparison with cotton.
The increase in yarn CVm values as the fiber ratio of banana, jute, flax, and hemp increases from 20% to 40% can be attributed to several factors related to the characteristics of these fibers and their interactions in the yarn manufacturing process. The bananas, jute, flax, and hemp naturally have distinct physical characteristics from cotton. These variations may be related to surface properties, diameter, and fiber length. The differences in unique characteristics of these fibers may contribute to the mass variations in the yarn produced when they are blended with cotton. The less compatibility of the fibers results in uneven distribution and alignment of fibers in the yarn, contributing to mass variations. Moreover, fibers with different characteristics may not behave uniformly during processes like carding, drawing, and spinning, which leads toward the mass variations in the resulting yarn. 65 The lower CVm in cotton-sisal blends compared to pure cotton may be attributed to the inherent stiffness and coarser structure of sisal fibers, which contribute to a more uniform distribution during blending and spinning. Sisal’s properties are likely to reduce irregularities and enhance the evenness of the yarn mass.
Dunnett’s analysis shown in Figure 7(b) and (c) reveals that in 80:20 blend ratio the samples cotton/jute, cotton/flax and cotton/hemp were statistically different as compared to 100% cotton yarn. In 60:40 blend ratio all the samples were statistically different as compared to 100% cotton yarn. The increase in blend ratio of alternative natural fibers results in variations in the blending process, such as uneven mixing or distribution of fibers, leading to differences in mass among individual yarn units.56,65,66
The fibers in cotton/banana, cotton/sisal, cotton/flax, cotton/jute, and cotton/hemp blends are different and distinct from one another, their coefficient of variation of the mean (CVm) is typically higher than that of pure cotton yarn. Cotton can be blended with banana, sisal, flax, jute, hemp, or banana to introduce a variety of fiber properties, such as varying lengths, strengths, and flexibilities. Blends containing fibers increase the heterogeneity of the yarn and cause it to deviate more from its average properties than pure cotton yarn, which has a more uniform fiber composition.
Hairiness of the yarns
In the context of blended yarns, “hairiness” describes the existence of loose fibers or projecting strands on the surface of yarns. It is a characteristic that can affect the appearance, had-feel, and performance of the final fabric or textile product. The hairiness of blended yarn can be influenced by various factors, including the type of fibers used, the blending process, and the spinning technique.67,68 Yarn with excessive hairiness can be both advantageous or disadvantageous in certain aspects. Positively, the warmth and softness of the cloth may be enhanced by a certain amount of hairiness. However, too much hairiness may result in a less smooth and more uneven surface, affecting the overall fabric appearance and potentially causing issues during the knitting or weaving process. 69 Yarn manufacturers frequently try to strike a compromise between desirable qualities and avoiding too much hairiness. A certain type of blended yarn can have its desired level of hairiness achieved by implementing quality control procedures and making modifications during the spinning process.
Figure 8(a) illustrates the Hairiness (H) of yarn made only from cotton fibers and the yarns made from cotton blended with other fibers in 80:20 and 60:40 blend ratios. The vertical columns represent the average hairiness (H) values, while the error bars indicate the standard deviation showcasing the variability in (H) among the samples. Cotton yarn serves as a reference, with its average hairiness value of 5.89. The average hairiness of the 80:20 blend of cotton/hemp, cotton/banana, cotton/jute, cotton/flax, and cotton/sisal were 6.06, 6.14, 6.33, 6.26, and 6.38 respectively. The average hairiness of the 60:40 blend of Cotton/hemp, cotton/banana, cotton/jute, cotton/flax, and cotton/sisal were 6.20, 6.64, 6.45, 6.28 and 6.57 respectively. The results clearly indicate that, increase in fiber ratio of banana, jute, flax and hemp fiber from 20% to 40 % result in the increase of yarn hairiness.13,56,63,70

(a) Hairiness (H) results for the different blended yarn samples, (b) Dunnett analysis (hairiness) of 80:20 blend ratio samples in comparison with cotton, and (c) Dunnett analysis (hairiness) of 60:40 blend ratio samples in comparison with cotton.
There are multiple reasons for the increase in yarn hairiness when the fiber ratio of hemp, banana, jute, and flax rises from 20% to 40% in the blends with cotton. The fibers from bananas, jute, flax, and hemp are recognized for being comparatively coarser and longer than those from cotton. The overall coarseness of the fibers in the yarn increases along with the ratio of these fibers in the blend. Higher levels of hairiness are caused by longer, coarser fibers that tend to stick out more from the surface of the yarn. The yarn structure in a blend can also be influenced by the interactions between the various fibers. The heterogeneous combination may cause the fibers to align less consistently during spinning as the percentage of hemp, banana, jute, or flax increases. This can lead to more protruding fibers, contributing to higher hairiness. 71 The higher hairiness in blends of cotton with banana, jute, and sisal fibers compared to blends with flax and hemp can be attributed to the different physical properties and surface characteristics of the fibers. Banana, jute, and sisal fibers tend to be coarser, rougher, and more rigid than flax and hemp, which are finer and smoother. These coarser fibers are more likely to protrude from the yarn during spinning, contributing to increased hairiness. In contrast, flax and hemp fibers have smoother surfaces and better alignment with cotton during spinning, resulting in less fiber protrusion and lower hairiness. Additionally, flax and hemp have a more consistent length and less surface irregularity, which helps reduce hairiness in the final yarn blend.
Dunnett’s analysis shown in Figure 8(b) and (c) reveals that in 80:20 blend ratio the samples Cotton/jute and in 60:40 blend ratio Cotton/Banana and Cotton/Sisal were statistically different as compared to 100% cotton yarn. With the increase in blend ratio of alternative natural fibers, it results in variations in the blending process, such as uneven mixing or distribution of fibers, can result in increase in hairiness.
Imperfection index (IPI)
In the textile industry, the Imperfection Index (IPI) is a widely recognized standard for evaluating yarn quality. This index quantitatively measures the extent of flaws or imperfections present in the yarn, which are critical determinants of the quality of the final textile product. The IPI accounts for various types of yarn imperfections, including neps, thick and thin areas, and other structural irregularities. Each type of imperfection is assigned a specific numerical value, and the aggregation of these values constitutes the overall Imperfection Index. It is important to note that there can be variations in the formula used to calculate the IPI. Different textile mills and standardizing organizations may adopt distinct computational approaches depending on the type of yarn being produced and the quality benchmarks set by the industry. These variations reflect the diverse requirements and expectations within the textile sector. The Imperfection Index serves as a crucial metric, with lower values indicating higher yarn quality, characterized by minimal defects. This correlation is particularly significant in applications such as weaving and knitting, where uniformity and consistency in yarn quality are vital for the optimal performance of the finished textile, as cited in reference. 72
Figure 9 illustrates the IPI of yarn made only from cotton fibers and the yarns made from cotton blended with other fibers in 80:20 and 60:40 blend ratios. The vertical columns represent the average IPI values, while the error bars indicate the standard deviation showcasing the variability in IPI among the samples. Cotton yarn serves as a reference, with its average IPI value of 583. The average IPI of the 80:20 blend of cotton/hemp, cotton/banana, cotton/jute, cotton/flax, and cotton/sisal were 1972, 683, 1292, 2382, and 600 respectively. The average IPI of the 60:40 blend of Cotton/hemp, cotton/banana, cotton/jute, cotton/flax, and cotton/sisal were 3706, 796, 1420, 4586, and 1107 respectively. The results clearly indicate that, increase in fiber ratio of banana, jute, flax and hemp fiber from 20% to 40% result in the increase of yarn IPI.57,73 The increase in the Imperfection Index (IPI) of yarn from a 20:80 to a 40:60 blend of cotton with banana, jute, flax, and hemp fibers suggests that these alternative fibers contribute to a higher level of imperfections in the resulting yarn. Several factors could contribute to this increase in IPI.

(a) Imperfection index (IPI) results for the different blended yarn samples, (b) Dunnett analysis (IPI) of 80:20 blend ratio samples in comparison with cotton, and (c) Dunnett analysis (IPI) of 60:40 blend ratio samples in comparison with cotton.
The lower imperfection index in blends of cotton with banana, jute, and sisal fibers compared to blends with flax and hemp can be attributed to the differences in fiber morphology and behavior during spinning. Banana, jute, and sisal fibers, despite being coarser and rougher, have relatively more uniform and shorter lengths, which can result in fewer imperfections such as thick and thin places in the yarn. These fibers tend to better interlock with cotton, helping to minimize irregularities in the spinning process. On the other hand, flax and hemp fibers are finer and longer, which can cause more variation in length and more frequent interruptions in the spinning process, leading to higher imperfections in the final yarn. Their smoother surfaces and greater fiber length may also cause them to slide or align less efficiently with cotton, resulting in more thickness variation, leading to a higher imperfection index.
Different fibers have different tensile strengths and cohesive qualities. The alternative fibers (hemp, banana, jute, flax, and hemp) have less cohesiveness than cotton. It causes more breakages or irregularities in the yarn structure during the spinning process. This could result in higher IPI values. The processing and blending techniques used to combine different fibers, also directly impact the final yarn quality. Inadequate blending or processing methods may lead to uneven distribution of fibers, causing variations in yarn thickness and resulting in higher IPI values.64,74,75 Optimizing the quality of yarn produced from blended fibers necessitates careful adjustments in spinning parameters and refining blending techniques. Moreover, the selection of fibers with properties that closely resemble those of cotton can also reduce yarn imperfections.
The increased hairiness and imperfection index could result in several issues. Fabrics made from such yarn may experience uneven dye uptake, leading to poor dyeing and color variation, requiring additional treatments to address these problems. Similarly, the higher hairiness and imperfections can cause issues during weaving, such as increased friction and breakages, which reduce weaving efficiency. Finally, when used in clothing, the fabric may lack smoothness and feel harsh, potentially causing discomfort for the wearer. To address these issues, optimized spinning, fiber pre-treatment, post-treatment processes like singeing and brushing, improved dyeing techniques, and enhanced weaving and finishing treatments can help reduce hairiness, imperfections, and improve fabric quality.
Dunnett’s analysis shown in Figure 9(b) and (c) reveals, that in 80:20 blend ratio the samples cotton/Banana and Cotton/Sisal have comparable IPI in comparison with cotton while in 60:40 blend ratio all the samples were statistically different except Cotton/Banana blend as compared to 100% cotton yarn. With the increase in blend ratio of alternative natural fibers, uneven mixing or distribution of fibers, can result in increase in yarn imperfection index.13,32,76,77 The fibers from jute, flax, and hemp are longer, coarser, and more variable than those from cotton, that can cause irregularities when spinning, resulting in higher IPI.
Conclusion
In this study, 11 different types of yarn were developed using six different types of fibers (cotton, flax, banana, hemp, sisal, and jute) and two different types of blend ratios (80:20 and 60:40). The characterization techniques including XRD, FTIR, SEM used to analyze fibers while tenacity, breaking elongation, Coefficient of mass variation (CVm), Hairiness and Imperfection index (IPI) were performed to evaluate the mechanical performance of developed yarns. Tenacity, a key yarn quality metric, declined with increased proportions of banana, jute, flax, and hemp fibers from 20% to 40%. For example, cotton/flax blends dropped from 8.09 cN/tex (80:20) to 7.60 cN/tex (60:40), whereas cotton/sisal blends maintained superior strength (11.34 and 11.02 cN/tex), even outperforming pure cotton (10.61 cN/tex) making it suitable for uses requiring greater strength and resilience, such as manufacturing technical textiles. Dunnett’s test confirmed significantly lower tenacity for flax blends and higher strength for sisal blends. Breaking elongation varied with fiber type: pure cotton had 5.08%, while banana and sisal blends showed higher elongation (up to 6.47%), and flax/hemp blends showed reduced stretchability (as low as 4.22%). Mass variation (CVm) rose with higher alternative fiber content—pure cotton had 14.93%, increasing to 23.04% for cotton/flax (60:40). Hairiness also increased, especially with sisal (6.57 vs 5.89 in pure cotton). The Imperfection Index (IPI) revealed quality challenges, with flax blends showing the highest imperfections (up to 4586), while banana and sisal blends remained closer to cotton’s baseline (IPI 583). Future work should focus on optimizing blend ratios and pre-treatment processes to enhance yarn uniformity and mechanical performance for sustainable textile applications.
Footnotes
Funding
The authors disclosed receipt of the following financial support for the research, authorship, and/or publication of this article: The research was funded by Researchers Supporting Project number (GCF-63).
Declaration of conflicting interests
The authors declared no potential conflicts of interest with respect to the research, authorship, and/or publication of this article.
Data availability statement
The data will be made available as per requirement.