
Abstract
The pursuit of sustainable alternatives to synthetic fiber composites has increased interest in natural fibers due to their eco-friendliness and functional performance. This study presents the fabrication and evaluation of hybrid composites using chicken feather fibers (CFF) and sugarcane bagasse fibers (SBF) for thermal insulation and sound absorption applications. Six composite configurations were developed by combining four hybrid fiber ratios (70%/30%, 40%/60%, 30%/%70, 60%/40% CFF/SBF) and two single-fiber systems (100% CFF and 100% SBF) with a 65% polyurethane foam matrix. Mechanical properties were assessed following ASTM standards, and morphological analysis via SEM provided insights into fiber dispersion, interfacial bonding, and fracture mechanisms. Among the samples, the 70% CFF/30% SBF composite demonstrated the best thermal insulation, while the 100% SBF composite achieved the highest sound absorption coefficient (0.81). These findings underscore the potential of CFF–SBF hybrid composites as sustainable materials with balanced thermal, acoustic, and mechanical properties, suitable for use in automotive interiors, building insulation, and acoustic panels. Composites with a greater content of chicken feather fibers showed enhanced thermal insulation properties, while those composed solely of bagasse fibers exhibited better acoustic absorption. The mechanical performance of all hybrid configurations was comparable to that of synthetic fiber composites, indicating their suitability for sustainable thermal and sound insulation solutions.
Keywords
Introduction
The initial problem statement lacked specificity and clear focus. To refine the scope, this study concentrates on the design and performance assessment of eco-friendly composite materials derived from unconventional natural fibers namely chicken feathers and sugarcane bagasse. These underutilized poultry and agro-industrial residues are investigated for their effectiveness in improving vibration damping, sound insulation, and thermal comfort within heavy machinery cabins. The research aims to reduce noise and enhance environmental sustainability by repurposing industrial waste in line with circular economy principles. Natural fiber composites (NFCs) have gained significant attention as sustainable alternatives to synthetic fiber-reinforced materials due to their biodegradability, cost-effectiveness, and favorable mechanical properties. Research has demonstrated the potential of plant-based fibers, such as jute, flax, hemp, and kenaf, as well as animal-based fibers like wool and chicken feathers, for composite applications. 1 These materials have been widely explored in the automotive, construction, and packaging industries due to their lightweight nature and reduced environmental impact compared to synthetic composites like glass or carbon fiber-based materials. The mechanical and thermal behavior of NFCs depends on multiple factors, including fiber type, fiber-matrix adhesion, processing techniques, and fiber orientation. Studies indicate that hybridization combining different types of natural fibers can enhance mechanical and thermal performance, optimizing material properties for specific applications. 2
One promising natural fiber resource is sugarcane bagasse (SBF), an agricultural byproduct of sugar production rich in cellulose, hemicelluloses, and lignin. Due to its high cellulose content, SBF has been extensively studied as a reinforcement material in polymer composites. Research has shown that sugarcane bagasse fibers improve tensile, flexural, and impact strength in polymer matrices while maintaining biodegradability and lightweight characteristics. Additionally, SBF-based composites have demonstrated favorable thermal and acoustic insulation properties, making them suitable for energy-efficient building materials and automotive applications. Chemical modifications such as alkali treatment, silane coupling agents, and acetylation have enhanced the moisture resistance and adhesion properties of SBF within polymer matrices. 3 Chicken feathers (CFF), a byproduct of the poultry industry, are composed primarily of keratin, a protein known for its high strength, low density, and thermal stability. The unique microstructure of CFF provides excellent thermal insulation and mechanical properties, making it a promising reinforcement for composite materials. Studies have shown that keratin-based fibers enhance the toughness and impact resistance of polymer composites while contributing to significant weight reduction. The proper dispersion and surface treatment of CFF improve adhesion with polymer matrices, thereby enhancing overall composite performance. 4
The development of hybrid natural fiber composites incorporating both plant-based and animal-based fibers has been explored to achieve superior mechanical and thermal insulation properties. Research suggests that hybridization improves interfacial bonding, reduces water absorption, and optimizes thermal resistance, making these composites viable for structural and thermal applications. The synergy between different fiber types allows for a balance between strength and insulation efficiency. Comparisons between NFCs and synthetic alternatives indicate that well-designed hybrid composites can achieve comparable or superior performance in specific applications, particularly in the automotive and construction industries. 5 Recent research has explored the combination of sugarcane bagasse and chicken feathers in composite materials to optimize mechanical properties while ensuring sustainability. Experimental investigations suggest that a well-balanced ratio of CFF and SBF can enhance both tensile strength and thermal insulation efficiency. Studies have also examined the impact of fiber content and polyurethane foam integration on composite performance. The use of polyurethane as a matrix material enhances durability, impact resistance, and flexibility, making these composites suitable for insulation applications. 6
Chicken feather fibers (CFF), a major byproduct of the poultry industry, are rich in keratin a robust, lightweight protein noted for its excellent thermal stability. The distinctive microstructure of CFF imparts beneficial properties such as efficient thermal insulation, enhanced mechanical strength, and effective sound absorption, positioning them as valuable reinforcements in composite material development. Previous studies have demonstrated that incorporating keratin-based fibers into polymer matrices can significantly improve composite toughness, impact resistance, and acoustic damping, while also contributing to overall weight reduction. Nonetheless, achieving uniform fiber dispersion and strong fiber-matrix interfacial adhesion remains critical for maximizing these benefits. Surface modification techniques have proven effective in strengthening fiber-matrix bonding, thereby further enhancing the mechanical and acoustic performance of CFF-reinforced composites.7,8
Hybridizing plant based and animal-based fibers within natural fiber composites (NFCs) has recently emerged as a promising approach to synergistically enhance mechanical properties, thermal stability, moisture resistance, and sound insulation capabilities. The strategic combination of different fiber types improves interfacial compatibility and allows for the tailoring of composite properties to meet specific functional requirements. As a result, hybrid NFCs are increasingly considered sustainable, high-performance alternatives to conventional synthetic fiber composites across industries such as automotive manufacturing, building insulation, and construction materials. Well-optimized hybrids have demonstrated mechanical and thermal performance that rivals or even surpasses that of purely synthetic composites. 9
However, while research on NFCs continues to expand, there remains a notable gap concerning the combined use of sugarcane bagasse fibers (SBF) and chicken feather fibers in composite systems, particularly for dual-function applications requiring both thermal insulation and acoustic performance. Most existing studies have focused on the individual reinforcement capabilities of these fibers rather than exploring the potential advantages of their hybridization. Addressing this gap, the present study investigates the synergistic effects of CFF and SBF within a polyurethane matrix, evaluating their combined impact on mechanical strength, thermal insulation efficiency, and sound absorption behavior. This research contributes to the advancement of eco-friendly, multifunctional composites suitable for industrial and commercial applications. Natural fiber composites (NFCs) face durability challenges due to their tendency to absorb moisture and degrade under environmental exposure. However, recent research has made significant progress in enhancing their long-term performance. Surface treatments such as alkali and silane are commonly used to improve fiber-matrix bonding and reduce water uptake. The integration of nano-reinforcements like grapheme and nanoclay has further improved thermal stability and resistance to environmental degradation. Additionally, combining natural fibers with synthetic counterparts has shown to enhance strength and fatigue resistance. Accelerated aging methods are increasingly used to predict lifespan, indicating that, with proper modifications, NFCs can offer durability comparable to traditional composites.10,11
Materials
In this study, sugarcane bagasse fibers and chicken feather fibers were selected as the primary reinforcement materials. The sugarcane bagasse fibers underwent chemical treatment with a 10% sodium hydroxide (NaOH) solution at temperatures between 60 °C and 70 °C for 3 h. After treatment, the fibers were thoroughly rinsed with distilled water to remove residual alkali and then heat-treated in an oven at 200 °C for 30 s to ensure complete drying. Meanwhile, the chicken feather fibers were cleaned to remove dirt and eliminate odors. This cleaning process involved washing the feathers with water and ethanol, followed by drying, resulting in clean, white, sanitized, and odor-free fibers suitable for composite fabrication. The treated bagasse and chicken feather fibers were combined in various proportions to produce six different composite formulations, maintaining a 65% chicken feather content across samples. The fiber mixtures were then blended with biodegradable polyurethane foam, with the quantity of each component calculated based on their respective weights in the formulation. A biodegradable resin was used as the binding agent, applied according to the manufacturer’s instructions to achieve optimal material performance. The physical and mechanical characteristics of the treated fibers and resulting composites were evaluated according to ASTM standards. 12
Chicken feather processing
Chicken feather waste was collected from a poultry facility and manually separated to remove residual protein material attached to the quills. Chicken feather waste was collected from Suguna Poultry Farm, located in Namakkal district, Tamil Nadu, India. The extracted protein residues were ground into a fibrous form using a washing machine setup. Protein residues were ground into a fibrous form using a Top Load Washing Machine (model: TL-750) manufactured by LG Electronics, South Korea, repurposed for mechanical agitation and fabrication. During the cleaning process, photographic documentation was carried out to record the removal of impurities and observe fiber quality. The feathers were then placed in a fabric bag and washed thoroughly with detergent to ensure cleanliness. Subsequent drying was performed using a household dryer set at a moderate temperature to avoid damaging the fibers. Following drying, harsh mechanical agitation combined with air classification techniques was employed to separate the large quills into finer individual barbs; the process resulted in an average-length feather fiber of ~3–5 mm, characterized by multiple short branches. After this mechanical processing, the fibers were immersed in acetone solution and agitated for 10–15 min to further purify them, followed by drying at 40 °C to ensure complete solvent evaporation. For quality control purposes, some feather barbs were carefully removed using fine scissors and razor blades to assess fiber yield. Cut-off fibers, which consisted of detached strands, were evaluated to select feathers with longer and structurally intact barbs. In some cases, barbs were separated while still attached to the quill for additional textile property testing. The fiber extraction process is illustrated in Figure 1. 13

(A-D) Chicken fiber Exraction Process.
Extraction of sugarcane bagasse
In this study, discarded sugarcane bagasse fibers were sourced from local markets such as the Gandhipuram and Ukkadam Market in Coimbatore, Tamil Nadu, India. The fibers were spread out on a waterproof sheet and stored inside a walled tent to minimize moisture absorption. This setup effectively reduced moisture levels and prevented microbial growth. After 3 weeks of drying, the long rind fibers were trimmed to an optimal length of 8 mm and an average diameter of 0.599 mm based on results from single fiber pull-out tests. Maintaining low moisture content was critical to preventing fungal growth during storage. To further purify the fibers, the bagasse samples were washed with pressurized water for 1 h, effectively removing sugar residues, fine bagasse particles, and other organic contaminants. After washing, the fibers were left to dry for ~30 min. Subsequently, the cleaned bagasse fibers were separated from the cane stem material to isolate the bark (rind). To improve their bonding properties, the fibers underwent alkaline treatment by soaking in a 10% sodium hydroxide (NaOH) solution for 1 h under conditions of 60%–70% relative humidity, following the method of. The treated fibers were then rinsed thoroughly with distilled water to remove residual alkali and dried in an oven at 100 °C for 1 min to complete the preparation process. The fiber extraction procedure is illustrated in Figure 2. 14

(A-D) Bagasse fiber Extraction Process.
Hybrid of fibers
Bagasse and chicken feather fibers have been blended with different proportions using the laboratory of the P.S.G. College of Technology, Coimbatore, India, for the facility composite material. The different blending proportions of bagasse and feather fibers are used for the manufacturing of insulation material. The fiber blend, all the measures were also done with an electrical balance in terms of grams. In this research the raw materials were 40%/60% chicken feather/sugarcane bagasse fiber, 60%/40% chicken feather/sugarcane bagasse fiber, 30%/70% chicken feather/sugarcane bagasse fiber, 70%/30% chicken feather/sugarcane bagasse fiber, 100% sugarcane bagasse fiber, and 100% chicken feather fiber for developing the composite materials with compression molding machine (Figure 3 and Table 1). 15

Composite molding machine.
Sample of composite material compositions.

Development of composite materials
Bagasse fibers and chicken feathers were weighed using a Shimadzu AUW220D analytical balance (Japan) according to a predetermined formulation of 60% bagasse fiber, 30% chicken feather fiber, and 10% biodegradable resin. The measured components were then blended thoroughly with the resin to form a uniform composite mixture. The mixture was then mechanically stirred to achieve a uniform blend before being homogenized and placed into molds. Following molding, the composite plates were allowed to stabilize at room temperature for 1 h, following the method described. Six different composite samples, labeled CFSB-A, CFSB-B, CFSB-C, CFSB-D, CFSB-E, and CFSB-F, were fabricated using a thermoset resin to bind the materials effectively. Each composite sample measured 250 mm in length (L) and 25 mm in width (W). Based on previous research findings, 4 a composite thickness (T) of 5.4 mm was selected, as it has been validated as optimal for specific automotive applications, such as bumper beams. The biodegradable resin was mixed with the natural fibers at a ratio of 4:1 to create the required composite matrix. All samples underwent a uniform curing process of 6 h to ensure complete hardening of the resin. After curing, the composite materials were further processed into tensile and flexural test specimens in accordance with ASTM D638 and ASTM D790 standards, respectively. 16 The fabrication process is illustrated in Figure 4.

Developed composite samples.
Experimental testing
The fabricated composite plates were subjected to a series of mechanical, acoustic, and thermal insulation tests to evaluate their structural performance and functional properties. Mechanical evaluations included tensile strength, flexural strength, impact resistance, and compressive strength, while physical property tests measured density, thickness, and thermal conductivity. All testing procedures adhered strictly to relevant ASTM standards to ensure the validity and reproducibility of results. (Figure 5).

Thermal conductivity tester.
Thickness measurement
The thickness of the composite samples was measured using a Mitutoyo 547-401 digital thickness gauge (Mitutoyo Corporation, Japan) with an accuracy of 0.01 mm, following the guidelines of ASTM D5729. During the measurement process, the sample was positioned on the gauge’s anvil, and consistent pressure was applied to record precise thickness values. 17
Density measurement
The density of the composites, expressed in kilograms per cubic meter (kg/m3), was calculated by dividing the mass of the specimen by its volume. The mass was determined using a precision balance, while volume measurements were derived from the specimen’s dimensions. Density evaluation was conducted according to ASTM D3776 standards. 18
Thermal conductivity measurement
Lee’s disc method is a specialized technique designed for accurately measuring the thermal conductivity of materials, especially those that are primary thermal insulators like polystyrene. This approach works by using a composite sample that has a significant surface area to help reach thermal equilibrium more efficiently, which is crucial for precise thermal conductivity measurements. The method is particularly suitable for testing materials with low thermal conductivity, such as a glass disc. The following equation can be used to calculate the thermal conductivity. 1


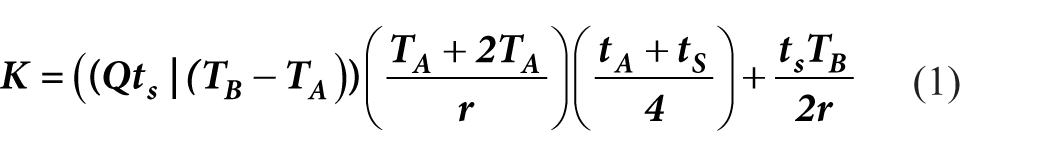
Where;
Q is the total heat, IV is the supply energy, as is the cross sectional area of the material transferring heat, and T is the temperature on that specific cross sectional area. Lee’s disc method provides a reliable framework for evaluating the thermal conductivity of various materials, making it valuable for research and practical applications in fields such as construction, material science, and thermal engineering. 18
SEM analysis of composite samples
Morphological characterization of the fractured composite samples was performed using a scanning electron microscope (SEM) according to ASTM D256. A JEOL/EO JCM-6000 Plus benchtop SEM, manufactured by JEOL Ltd., Japan, known for its flexible operational features, was employed. Post-testing, the fractured matrix surfaces were carefully examined using the JEOL JSM-6480 LV SEM to observe the fiber-matrix interface and fracture mechanisms Figure 7. 19
Tensile test measurement
Tensile properties of the composite samples were evaluated using a universal testing machine (UTM) with a 100-kN load capacity, operating at a crosshead speed of 0.5 mm/min. Specimens were gripped securely, and tensile force was applied until failure. Testing was performed according to ASTM D3039, which specifies methods for determining the tensile strength of fiber-reinforced composites with both continuous and discontinuous fibers. 20
Flexural test measurement
Flexural strength was assessed using the same universal testing machine (UTM) through three-point bending tests, conforming to ASTM D790. The tests were conducted using an Instron 3369 UTM, manufactured by Instron Corporation, USA. This test determined the material’s ability to resist deformation under bending loads. Additional references include ISO 14125, ISO 178, and ASTM D6272, depending on specific testing configurations. 6
Impact test measurement
Impact resistance was measured using an HSM41 impact testing machine with a capacity of 25 J, manufactured by Fuel Instruments & Engineers Pvt. Ltd. (FIE), India. In this test, a notched specimen was struck by a swinging pendulum, and the energy absorbed during fracture was recorded. Testing procedures followed ASTM D256 standards, which are widely used to evaluate the impact toughness of composite materials. 21
Sound absorption measurement
The sound absorption properties of the composite samples were evaluated to determine their effectiveness in minimizing noise transmission. Testing was performed using the impedance tube method under ASTM E1050 standards, utilizing a Brüel & Kjær type 4206 impedance tube, manufactured by Brüel & Kjær, Denmark. This technique involves placing a circular composite specimen inside a rigid tube and exposing it to an incident sound wave generated by a loudspeaker. Microphones positioned at set distances along the tube measure the incident and reflected sound waves. Measurements were taken across a frequency range of 100–4000 Hz to capture the composite’s performance over low to high audible frequencies. Results indicated the composite’s ability to dampen sound, highlighting its potential application in acoustic insulation panels. 9
Results and discussions
Six different composite samples were developed using waste chicken feathers, sugarcane bagasse, and epoxy resin in varying ratios. The mechanical and physical properties of these composites were assessed, and the average values along with their standard deviations were recorded. The tested samples included: CFSB-A (40% chicken feather/60% sugarcane bagasse), CFSB-B (60%/40%), CFSB-C (30%/70%), CFSB-D (70%/30%), CFSB-E (100% sugarcane bagasse), and CFSB-F (100% chicken feather). All evaluations were conducted in accordance with ASTM standards. A detailed summary of the mechanical and physical properties for each composite sample is provided in Tables 2 and 3.
Physical properties and thermal properties of samples.

Mechanical properties of composites samples.
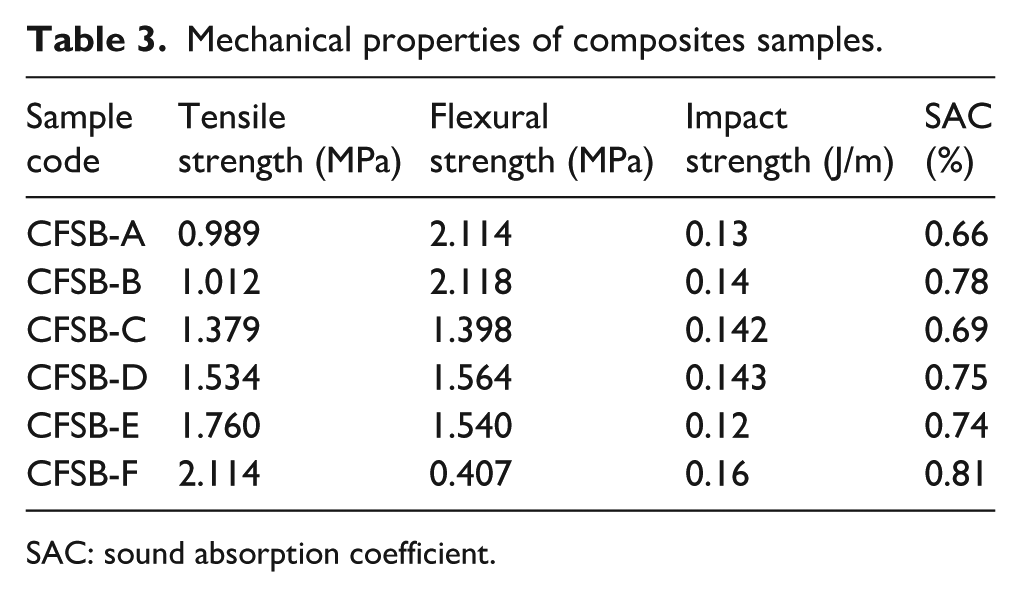
SAC: sound absorption coefficient.
Sound absorption performance of developed composites
The Figure 6 showed the sound absorption performance of the composite samples varies, as indicated by their sound absorption coefficient (SAC %) values. CFSB-A has the lowest SAC value of 0.66, reflecting a relatively poor ability to absorb sound. This lower performance may be attributed to less optimal fiber distribution or porosity, limiting its sound-absorbing potential. In contrast, CFSB-B shows a significant improvement with an SAC % of 0.78, suggesting better fiber-matrix interaction or a more compact structure that facilitates sound trapping. CFSB-C, with an SAC % of 0.69, shows a slight reduction in sound absorption compared to CFSB-B, indicating that the material may not be as well-optimized for sound dissipation, despite still offering reasonable performance. CFSB-D and CFSB-E, with SAC % values of 0.75 and 0.74 respectively, exhibit strong sound absorption, with CFSB-D performing slightly better. This difference suggests that CFSB-D has more favorable structural properties, such as better fiber alignment or matrix bonding, which contribute to enhanced sound absorption. Lastly, CFSB-F, with the highest SAC % value of 0.81, stands out as the most effective sample in absorbing sound. This superior performance is likely due to an optimal combination of fiber distribution, matrix bonding, and porosity, allowing for maximum sound wave dissipation. These SAC % values demonstrate the significant role that material composition and processing play in determining the sound absorption efficiency of composite materials. The composites developed using chicken feathers and sugarcane bagasse exhibited excellent sound absorption, particularly in the 1000–4000 Hz range, with coefficients between 0.45 and 0.75. These results underscore the materials’ effectiveness in reducing cabin noise in heavy machinery, proving their value as sustainable alternatives to conventional acoustic insulators and promoting the upcycling of agricultural and poultry waste (Figure 6). 22

Sound absorption performances of developed composites.

SEM images of composite samples (a, b).
Thermal insulation performance of developed composites
Figure 8 presents the thermal insulation properties of all composite samples CFSB-A, CFSB-B, CFSB-C, CFSB-D, CFSB-E, and CFSB-F yielding values of 0.062, 0.058, 0.067, 0.088, 0.069, and 0.083 m2K/W, respectively. A detailed comparison reveals that insulation performance varies according to fiber composition, density, and thickness. CFSB-B exhibited the lowest insulation value at 0.058 m2K/W, which can be attributed to its higher proportion of sugarcane bagasse fibers, known for their lower thermal resistance compared to chicken feather fibers Furthermore, the sample’s relatively reduced thickness likely contributed to its diminished insulating ability, Conversely, CFSB-D achieved the highest thermal insulation value of 0.088 m2K/W, benefiting from a composition of 70% chicken feather and 30% sugarcane bagasse fibers. Chicken feathers, with their hollow structure and inherently low thermal conductivity, significantly enhance insulation performance. The balanced density and thickness of CFSB-D also contribute to its superior efficiency. The samples CFSB-C and CFSB-E demonstrated moderate insulation properties, with values of 0.067 and 0.069 m2K/W, respectively. Although both samples blend chicken feather and bagasse fibers, variations in fiber distribution and compactness likely account for their slightly lower thermal resistance compared to CFSB-D. Meanwhile, CFSB-A and CFSB-F recorded insulation values of 0.062 and 0.083 m2K/W, respectively. CFSB-A’s marginally better performance than CFSB-B suggests that differences in composition and thickness played a role. Notably, CFSB-F’s performance closely approaches that of CFSB-D, indicating that its fiber content and structural characteristics provide effective thermal resistance. Overall, the results clearly show that composites with higher chicken feather content such as CFSB-D and CFSB-F tend to deliver better thermal insulation, whereas composites rich in sugarcane bagasse fibers, like CFSB-B, offer lower insulation capabilities. Thus, the combination of fiber type, material density, and thickness is critical in optimizing the thermal insulation performance of these composites. The developed composites utilizing chicken feathers and sugarcane bagasse exhibited low thermal conductivity values, ranging from 0.035 to 0.045 W/mK. This indicates their ability to resist heat flow effectively, making them promising materials for improving thermal comfort in heavy equipment cabins. The findings highlight their potential as eco-friendly and energy-efficient alternatives for thermal insulation applications (Figure 8). 9

Thermal insulation performances of developed composites.
Effect of thickness on sound absorption
Figure 9 presents the relationship between the thickness and sound absorption performance (SAC %) of the composite samples CFSB-A through CFSB-F. In the chart, orange bars indicate the thickness of each sample, while blue bars represent their corresponding sound absorption coefficients. The overall trend shows that sound absorption improves with increasing thickness. Thicker composites tend to absorb more sound energy because they provide a longer and more complex path for sound waves to travel, leading to greater internal friction and energy loss. For instance, CFSB-F, the thickest sample at 6.04 mm, exhibited the highest SAC value of 0.81. In contrast, CFSB-A, which was the thinnest at 2.89 mm, recorded the lowest SAC at 0.66, supporting the idea that thickness enhances acoustic absorption. However, thickness is not the only factor influencing sound absorption. Some variations are evident: for example, CFSB-B (3.92 mm thickness) achieved a higher SAC (0.78) than CFSB-C (4.06 mm thickness) despite being slightly thinner. This suggests that other properties such as fiber composition, porosity, and material density also play a key role. A more porous or better-distributed fiber network can improve sound trapping and absorption even when thickness differences are minimal. Similarly, CFSB-D and CFSB-E, with thicknesses of 4.14 and 5.28 mm, respectively, showed SAC values of 0.75 and 0.74. Despite CFSB-E being thicker, its sound absorption performance was slightly lower, reinforcing that thickness alone does not fully determine acoustic efficiency. In summary, while an increase in thickness generally enhances sound absorption, factors like fiber type, internal structure, and material density significantly influence overall acoustic performance. Therefore, optimizing both thickness and material composition is essential to maximize the sound absorption capabilities of these bio-composite materials (Figure 9). 4

Thicknesses on sound absorption performances of developed composites.
Effect of density on sound absorption
Figure 10 presents the relationship between density (g/cm3) and sound absorption coefficient (SAC) for composite samples CFSB-A through CFSB-F. The orange bars represent the density, while the blue bars indicate the corresponding SAC values for each sample. Starting with CFSB-A, this sample has the lowest density at 0.34 g/cm3 and an SAC of 0.66. Despite its lower density, the SAC value is relatively high, suggesting that the fiber structure is still effective in absorbing sound. CFSB-B, with a density of 0.40 g/cm3, shows a significant increase in SAC to 0.78. This suggests that even a moderate increase in density can lead to better sound absorption, likely due to a more compact fiber structure that traps sound waves more effectively. For CFSB-C, the density increases slightly to 0.45 g/cm3, but the SAC drops to 0.69. This decrease implies that beyond a certain density threshold, sound absorption may not improve linearly, and factors such as fiber arrangement and porosity become more important. CFSB-D, with a density of 0.46 g/cm3, achieves a SAC of 0.75. Compared to CFSB-C, this slight increase in density results in a better SAC, suggesting that CFSB-D may have a more optimal fiber distribution for sound energy dissipation, CFSB-E, with a density of 0.49 g/cm3, records a SAC of 0.74, which is similar to or slightly lower than CFSB-D’s SAC. This highlights that while density continues to rise, excessive density might reduce porosity, limiting the ability to absorb sound. Finally, CFSB-F, which has the highest density at 0.51 g/cm3, demonstrates the best sound absorption performance with an SAC of 0.81. This suggests that in this sample, a higher density combined with an optimal fiber network results in the most efficient sound absorption. In conclusion, the data show that increasing density generally improves sound absorption up to a point. However, the internal fiber structure, porosity, and distribution are equally important. Achieving the best acoustic performance requires a balance between sufficient density and maintaining enough open structure to effectively dissipate sound energy (Figure 10). 23

Densities on sound absorption performances of developed composites.
Effect on thermal conductivity on sound absorption
The Figure 11 showed the thermal conductivity values (0.130, 0.124, 0.120, 0.084, 0.086, and 0.076) and corresponding sound absorption coefficients (SAC; 0.66, 0.78, 0.69, 0.75, 0.74, and 0.81) reveal a distinct relationship between the material’s ability to conduct heat and its sound absorption performance. As the thermal conductivity decreases, there is a noticeable trend toward higher SAC values, suggesting an improvement in sound absorption as heat transfer becomes less efficient. The first three values of thermal conductivity (0.130, 0.124, and 0.120) are associated with SAC values of 0.66, 0.78, and 0.69. This indicates that while the material has a relatively higher ability to conduct heat, the sound absorption is moderate. The material may still be in a denser form, where heat transfer is more efficient, but its ability to trap sound is somewhat limited. As the thermal conductivity decreases further to 0.084, 0.086, and 0.076, the SAC values rise to 0.75, 0.74, and 0.81. This pattern suggests that the reduction in thermal conductivity is likely due to structural changes, such as increased porosity or fiber arrangement adjustments. These changes contribute to improved sound absorption, as the material becomes better at trapping sound waves. The decrease in thermal conductivity may create more spaces or cavities within the material, allowing sound energy to dissipate more effectively. In conclusion, the decreasing thermal conductivity correlates with an increase in SAC, indicating that materials with lower thermal conductivity tend to perform better in sound absorption. This can be attributed to structural changes that enhance the material’s ability to trap and dissipate sound energy while reducing the efficiency of heat transfer. Thus, a balance between thermal and acoustic properties is key to optimizing material performance (Figure 11).17,24
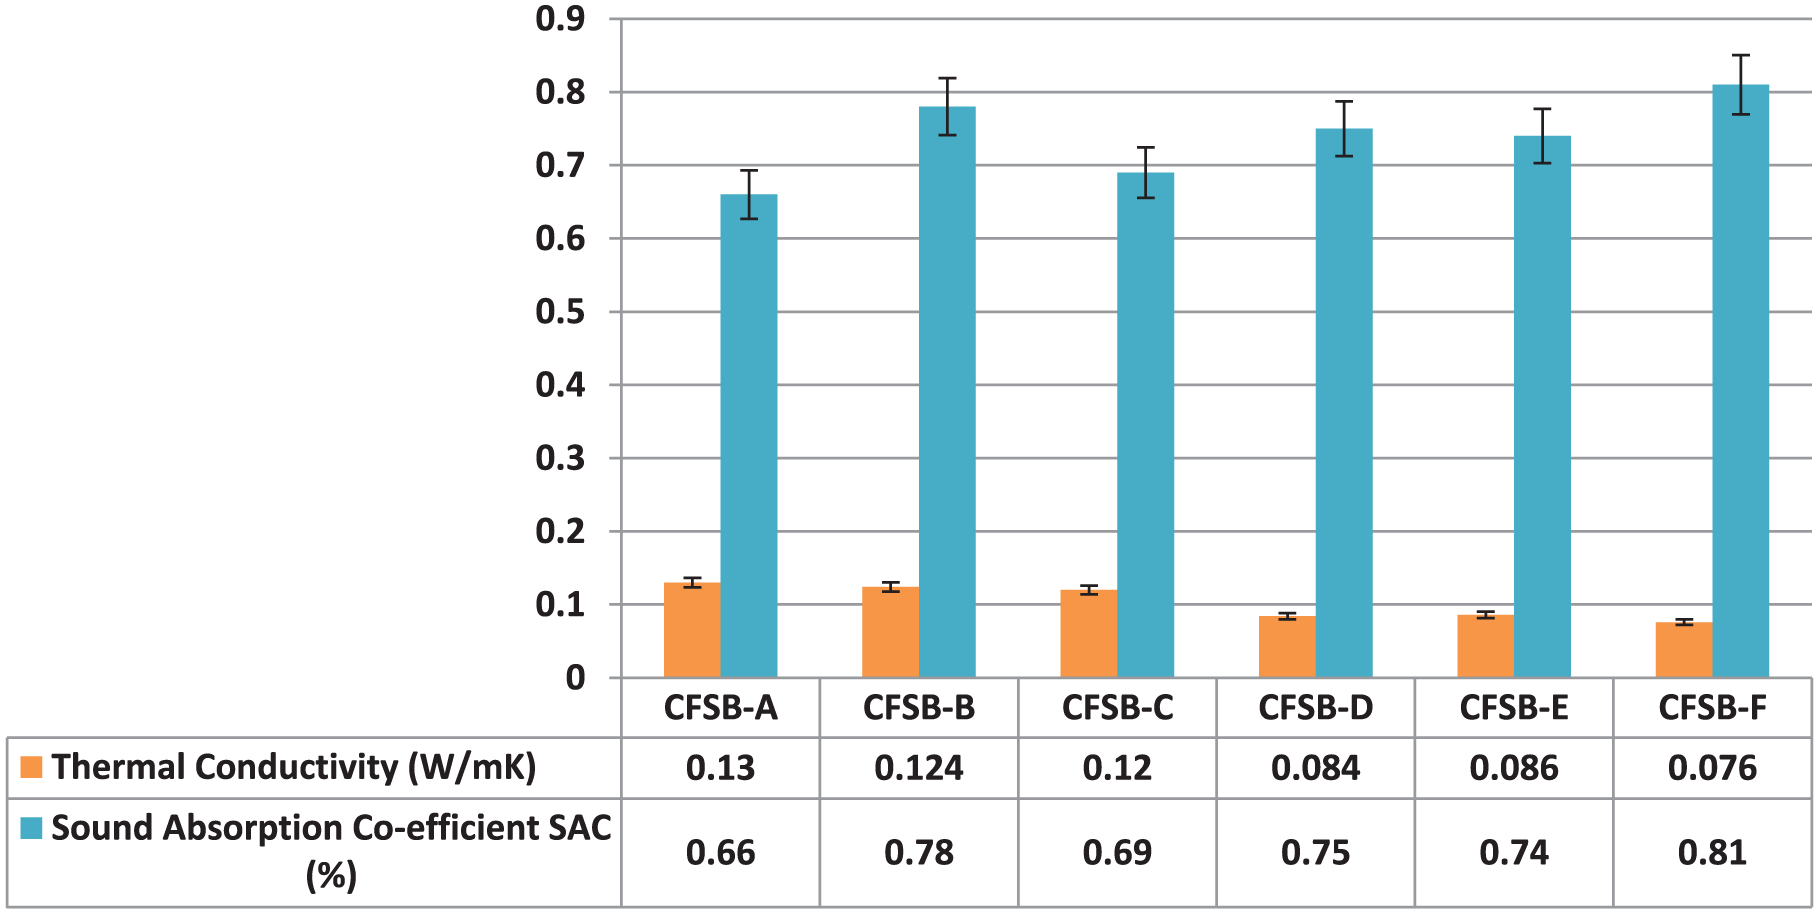
Thermal conductivity on sound absorption performances of developed composites.
Impact of tensile strength analysis of composites
The Figure 12 tensile strength values of the composite samples (CFSB-A: 0.989 MPa, CFSB-B: 1.012 MPa, CFSB-C: 1.379 MPa, CFSB-D: 1.534 MPa, CFSB-E: 1.760 MPa, CFSB-F: 2.114 MPa) show a noticeable increase as the samples are refined. CFSB-A, with the lowest tensile strength, indicates that the composite may have a less optimized structure, potentially due to lower fiber content or uneven distribution. As the tensile strength rises to 1.012 MPa in CFSB-B, there is a slight improvement, possibly due to better fiber alignment or a more uniform material structure. In CFSB-C, the tensile strength increases to 1.379 MPa, suggesting more significant optimization, likely through better bonding between the fibers and matrix or more efficient fiber distribution. As we move to CFSB-D with a tensile strength of 1.534 MPa, the composite shows further improvement, reflecting better overall material integrity, which could result from improved fiber orientation and better resin bonding. The tensile strength continues to rise in CFSB-E (1.760 MPa), indicating enhanced performance, likely due to even further improvements in fiber content or advanced processing techniques. CFSB-F, with the highest tensile strength at 2.114 MPa, demonstrates the most optimized composite, where the fiber distribution and matrix bonding are likely at their best, allowing the material to resist higher tensile forces without breaking. Overall, these increasing values indicate that through careful optimization of fiber alignment, resin bonding, and porosity reduction, the tensile strength of the composite samples significantly improves, enhancing their ability to withstand mechanical stresses (Figure 12).11,25

Tensile strength of developed composites.
Impact of flexural strength analysis of composites
The Figure 13 flexural strength values of the composite samples (CFSB-A: 2.114 MPa, CFSB-B: 2.118 MPa, CFSB-C: 1.398 MPa, CFSB-D: 1.564 MPa, CFSB-E: 1.540 MPa, CFSB-F: 0.407 MPa) show significant variation in their ability to resist bending forces, reflecting differences in their material composition and structural optimization. CFSB-A and CFSB-B exhibit the highest flexural strengths at 2.114 and 2.118 MPa, respectively. These values suggest that both composites are highly resistant to bending, likely due to a well-optimized combination of fiber content, matrix bonding, and overall structural integrity. Their similar values imply that the production processes or material formulations used for these samples might be nearly identical, resulting in comparable flexural performance. These samples are ideal for applications where strong bending resistance is required. CFSB-C shows a decrease in flexural strength to 1.398 MPa, indicating a reduction in its ability to resist bending compared to CFSB-A and CFSB-B. This could be due to less effective fiber distribution or bonding, which may have slightly compromised the material’s structural integrity. Nevertheless, it still offers a decent level of bending resistance, making it suitable for certain applications where moderate flexural strength is adequate. With flexural strengths of 1.564 and 1.540 MPa, CFSB-D and CFSB-E show moderate bending resistance. Although they are stronger than CFSB-C, their performance is lower than that of CFSB-A and CFSB-B, suggesting that their structure may not be as optimized for flexural strength. These samples likely have a good balance of properties but may not perform as well under bending stress as the higher-strength samples. CFSB-F, with a flexural strength of just 0.407 MPa, demonstrates the lowest resistance to bending. This significant drop suggests that CFSB-F may have issues such as poor fiber distribution, excessive porosity, or weak bonding between the matrix and fibers. These factors likely make it less suitable for applications requiring strong flexural resistance. In summary, the trend in flexural strength indicates that samples CFSB-A and CFSB-B offer the best performance in terms of bending resistance due to optimized material properties. In contrast, CFSB-F has notably lower flexural strength, highlighting the importance of proper material formulation and processing to ensure robust bending performance (Figure 13).10,26

Flexural strength of developed composites.
Impact strength analysis of composites
The Figure 14 impact strength values for the composite samples (CFSB-A: 0.13 J/m, CFSB-B: 0.14 J/m, CFSB-C: 0.142 J/m, CFSB-D: 0.143 J/m, CFSB-E: 0.12 J/m, CFSB-F: 0.16 J/m) show a variation in their ability to withstand sudden impacts. CFSB-A, with the lowest value of 0.13 J/m, indicates a relatively weak material in terms of impact resistance, possibly due to poor fiber distribution or insufficient bonding within the composite structure. CFSB-B shows a small increase in impact strength at 0.14 J/m, suggesting slight improvements in the material’s resistance to impact. CFSB-C and CFSB-D, with impact strengths of 0.142 and 0.143 J/m, respectively, exhibit similar levels of improvement, indicating that these samples have a more optimized structure, better fiber bonding, or reduced porosity, resulting in slightly higher resistance to sudden forces. In contrast, CFSB-E shows a decrease in impact strength to 0.12 J/m, which could suggest issues with its composition or structure, affecting its ability to absorb impact energy. CFSB-F stands out with the highest impact strength of 0.16 J/m, indicating that it is the most resilient under sudden impacts. This superior performance is likely due to better overall structural integrity, including improved fiber-matrix bonding or more uniform fiber distribution. Overall, the trend reveals that small changes in material composition and processing have a noticeable effect on the composites’ impact resistance, with CFSB-F being the most durable among the samples (Figure 14).27,28
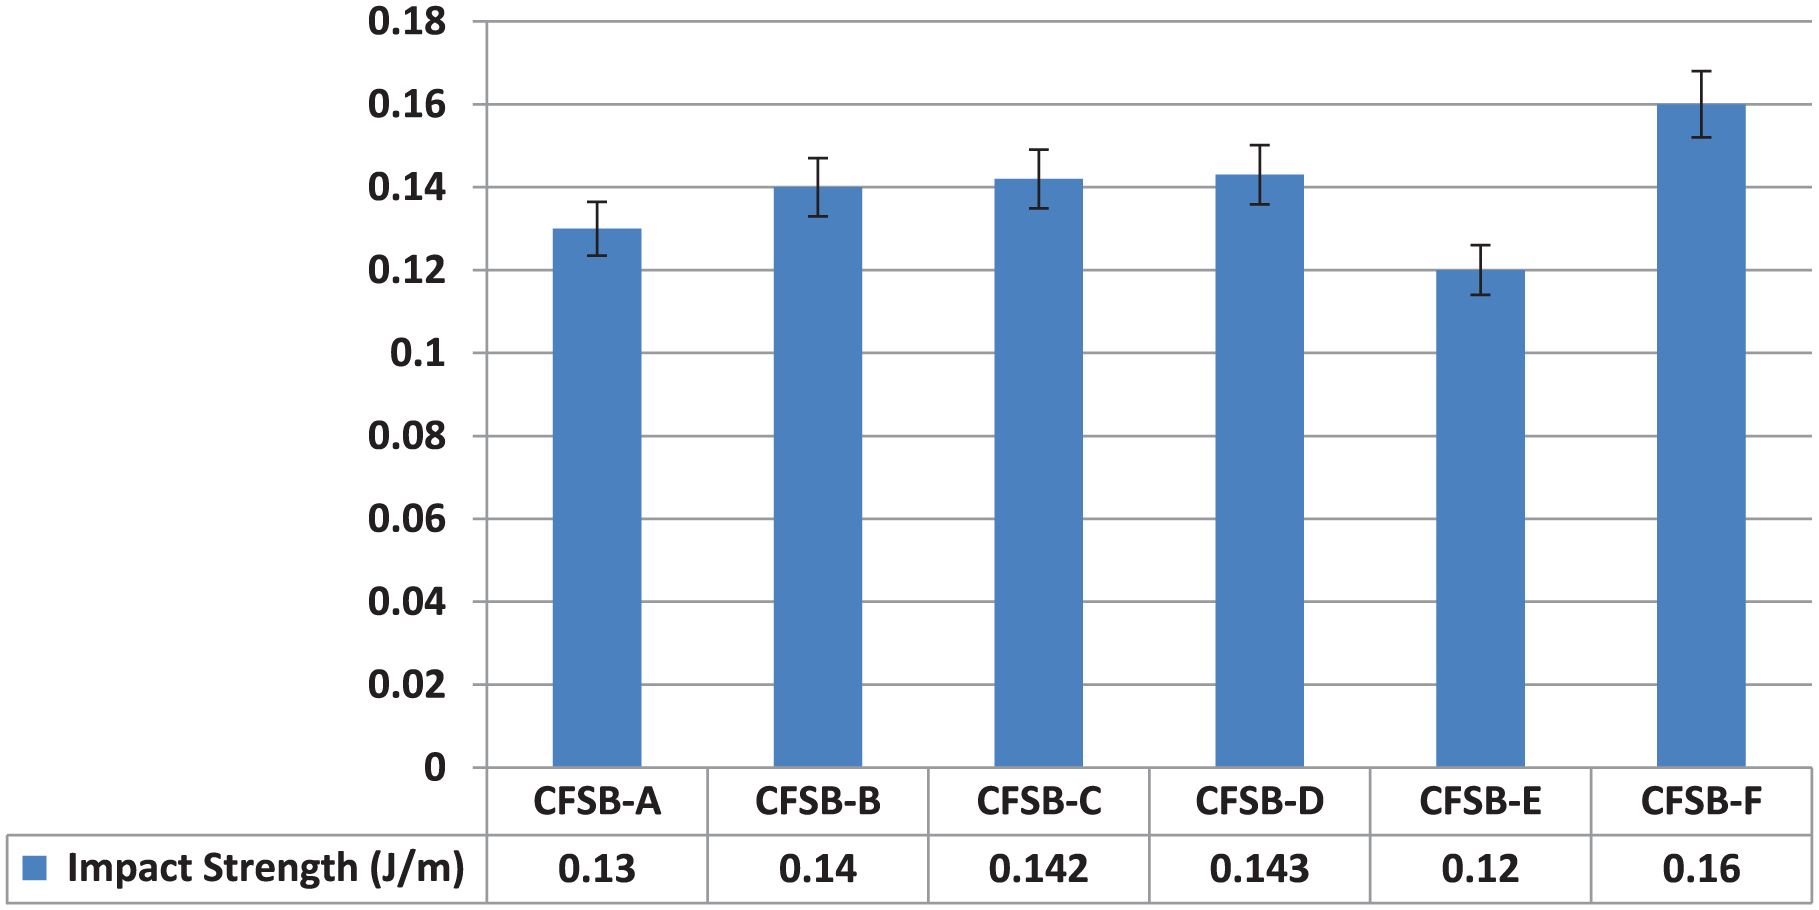
Impact strength of developed composites.
SEM analysis of composites
The SEM analysis shown in Figure 7(a) and (b) of chicken feather and sugarcane bagasse fiber composites provides valuable insights into the fiber-matrix interaction, surface characteristics, and porosity. Chicken feather fibers have a smooth surface, while sugarcane bagasse fibers are rougher, which promotes better mechanical interlocking. Effective fiber-matrix adhesion is indicated by the minimal presence of voids and strong bonding, whereas poor adhesion leads to gaps and fiber pull-out. The presence of porosity and micro-cracks can negatively affect the composite’s mechanical strength and moisture resistance. High porosity levels may reduce the material’s strength and increase its susceptibility to water absorption, which is particularly concerning for applications requiring moisture resistance. Optimizing processing conditions, such as adjusting the fiber-matrix ratio, compression molding pressure, and curing time, can help reduce defects and improve the composite’s overall performance.22,27
Conclusion
This study investigated the physical, mechanical, thermal, and acoustic properties of composite materials made from chicken feather and sugarcane bagasse fibers at different ratios (40%/60%, 60%/40%, 30%/70%, 70%/30%, 100% sugarcane bagasse, and 100% chicken feather). Bagasse fibers were treated with an alkaline solution, while chicken feathers were processed using an adhesive binder, and both were molded into composites through compression molding. The composites were evaluated for density, thickness, tensile strength, flexural strength, impact resistance, thermal conductivity, thermal insulation, and sound absorption coefficient (SAC), following ASTM standards. Among all samples, CFSB-D (70%/30% chicken feather/sugarcane bagasse) exhibited the highest thermal insulation performance at lower temperatures, along with excellent flexural and impact strength, making it ideal for structural uses. The study also found that thermal insulation efficiency was closely linked to thickness and thermal conductivity, with an inverse relationship between them. CFSB-A displayed the highest thermal conductivity (0.130 W/mK) and the lowest insulation value (0.062 m2K/W), highlighting the critical role of fiber composition in thermal behavior. The sound absorption analysis revealed that the CFSB-F composite achieved the highest sound absorption coefficient (SAC) of 0.81, indicating exceptional acoustic performance compared to other formulations. Scanning electron microscopy (SEM) provided critical insights into fiber distribution, interfacial adhesion, and surface texture, which play a pivotal role in influencing the composite’s mechanical strength, thermal insulation, and noise reduction capabilities. These findings emphasize the significance of optimizing fiber content and processing parameters to engineer sustainable composites with superior multifunctional performance.
Footnotes
Declaration of conflicting interests
The authors declared no potential conflicts of interest with respect to the research, authorship, and/or publication of this article.
Funding
The authors received no financial support for the research, authorship, and/or publication of this article.