
Abstract
A patient’s respiratory rate can be measured based on the thoracic excursion during inhalation and exhalation. For this it was implemented a wearable antenna–sensor made of cotton/polyester (polycot) fabric and flexible copper was designed in electromagnetic field simulation software CST Studio Suite to operate at an industrial, scientific, and medical frequency band (ISM) of 2.4 GHz. The measurement protocol used involved conducting a thoracic anamnesis in order to manually measure the expansion of the thoracic cage during the patient’s inhalation and exhalation, as a way to validate the measurements. A wearable patch antenna was used as the thoracic deformation sensor, which allowed for anatomical adjustment to the curvature of the patients’ chests. According to the findings, the variation in the resonant frequency of the antenna–sensor was linear and decreasing in the range of 2.15–2.6 GHz (bandwidth of 450 MHz), allowing for the detection of linear changes in thoracic excursion, with a sensitivity inversely proportional to the applied effort of −2.56 MHz/µ
Keywords
Introduction
Continuous monitoring of physiological variables and vital signs is essential in health and wellness applications. Kinanthropometry encompasses the study of the parts of the human body in terms of physiology and movement (size, shape, proportions, and composition), with the aim of providing scientific information on growth, development, nutrition, exercise, sports, and performance. All research protocols in Kinanthropometry contemplate, to a greater or lesser degree of quantity and complexity, the registration of anthropometric measurements, with the application of different equations or computational calculation programs, partially or totally determine some of the morphological variables of the human structure. 1 One of the most important human physiological variables is respiration 2 ; respiratory rate monitoring is vital in multiple medical fields and can be used to predict potentially serious clinical events. For example, it is crucial during anesthesia; for the diagnosis of disorders such as sleep apnea, asthma, and chronic lung diseases, and for managing the risk of sudden infant death syndrome (SIDS). Moreover, it has been recently proposed to study the relationship between nutritive sucking and breathing in preterm infants, aiming to provide a standardized and reliable measurement. 3 Continuous monitoring of this variable could be beneficial for people suffering from age-related conditions, such as Parkinson’s disease or senile dementia, 4 and for sedentary patients. 5
In addition to its implementation in the assessment of people’s health condition, respiratory monitoring has been employed in different fields such as occupational health and safety, psychology, sports, military applications, emergency situations, and others described in Figure 1. Particularly, respiratory rate monitoring can help to recognize emotions in real time, such as fear, stress, anger, happiness, sadness, or surprise. Therefore, it constitutes an active area of research in various sectors: for example, entertainment, education and e-learning, psychology, and software engineering. 6

Most common fields of application of respiratory monitoring systems.
A patient’s respiratory rate can be measured based on the thoracic excursion, which produces mechanical movements during the inhalation and exhalation processes. It creates a pressure gradient that allows carbon dioxide (CO2) and oxygen (O2). to flow. As a result, the thoracic movement causes a deformation in the skin that allows the intercostal muscles to expand and return to their original position. 7
Electromedicine requires biomedical equipment that is reliable, yet small and portable. However, there are currently no devices that meet these conditions, specifically in the detection of sensitive physiological variables such as those related to respiratory rate and thoracic excursion. 8 Multiple commercial (and typically robust) systems have been designed to monitor changes in respiratory rate based on thoracic excursion. For example, capnometry measures the amount of air inhaled and exhaled (tidal volume) based on chest volume changes, that is, the amount of air breathed in and out. 9 Inductance plethysmography uses piezoelectric, strain, and thoracic impedance sensors to simultaneously measure thoracic and abdominal volumetric changes during inhalation and exhalation.10,11 Esophageal manometry is commonly employed in the routine detection of sleep apnea. 12 Bands allow the amplitude and oscillation of thoracic and abdominal movements to be sensed 13 ; The most common technique, called cross-handed, involves wrapping a tape measure around the chest, ensuring it makes contact with the skin without compressing or deflecting to get a reading.14,15
According to the literature review, various techniques to detect changes in thoracic excursion, the most common being the physical examination called anamnesis, which is done by a clinical expert using a tape measure; however, its main drawback is that it can lead to random or parallax errors or inaccuracies due to incorrect application. With advances in technology and research, different sensing techniques and devices are being designed for this purpose. However, many of these devices are invasive to the patient, show low sensitivity in measurements, and consume a lot of time in collecting and processing patient data.16–18 From the search in specialized literature, no studies were found that used the information collected from the anamnesis to validate the data obtained from the sensors.19–21
Patch antennas, due to their versatility, are attracting interest in civil engineering, telecommunications, electromedicine, and the academic and research world in general.16,22,23 Recent advances in patch design patch antennas have allowed them to be included as sensors in biomedical applications, having the function of monitoring and measuring some physiological variables in real time as part of versatile and complex devices with sampling, transmission, and storage capacity, providing more timely, precise, and reliable data.18–20,24 However, conventional patch antennas manufactured with lamellar dielectric substrates present limitations as physiological sensors due to patient discomfort caused by their rigidity.22,24,25 Although they are small, they do not adapt anatomically to the human body, nor do they allow detecting small changes in the thoracic excursion caused by respiratory movement and limiting their dynamic range.26,27 As shown, lamellar patch antennas are not common for detecting of thoracic excursion, compared to other measurement techniques.24,25,28 As a significant contribution of new textile materials in the design of patch antennas, the weight and rigidity of these are significantly reduced, increasing detection performance, as well as allowing them to be anatomically adjustable to the body, wearable, and usable.22,24,25 Rizwan et al. 29 described the manufacturing and performance of a square, flexible, and stretchable patch antenna on a three-dimensional (3D) printed substrate. Furthermore, by adhering directly to the skin, they present high bioimpedance, which increases attenuation and leads to low sensitivity and loss of data, thus impairing the sensing reliability.18,30 Recent research contributions are venturing into placing tag-type antennas that allow sensing information to be sent wirelessly; for example, in Kim et al. 31 designed a configuration of vector four patch antennas combined with a splitter detect respiratory movement without contacting the patient’s body.
In modern times, textiles have emerged as an effective alternative for designing sensors. 32 The most common ones are made of optical fiber and wearable antennas in VHF (very-high frequency) and UHF (ultra-high frequency). For example, in Elgeziry et al., 16 the authors developed a non-invasive breathing monitoring system by creating a smart mesh using textile optical fiber sensors to detect the respiratory rate of sleeping individuals. At the same time, various designs of textile antennas for biomedical applications have been proposed; for instance, the authors of Hasan et al. 17 manufactured a printed inverted F antenna with conductive ink injection operating at a frequency of 2.45 GHz, functioning as a deformation sensor for different biomedical applications. In Wang et al., 18 silver thread was used on textile to create a spiral antenna for a system that measures heart rate and body temperature. Similarly, in Alzaabi et al., 19 a flexible sinusoidal wave-shaped antenna sensor was presented, which is a modified version of a half-wave dipole and can be used for thoracic deformation detection applications. In Indrawati et al., 20 a textile sensor based on a double-layer flexible magnetic band was developed, exhibiting high sensitivity for monitoring thoracic deformation and detecting airflow during respiration. In Elgeziry et al. 16 a portable respiratory frequency sensor based on a spiral resonator (SR) tag printed on a thin and flexible textile substrate was presented; in the experimental setup, the fabric SR tag is attached to a water-filled bottle to emulate the presence of a patient’s chest. The emulated changes in inhalation and exhalation are transduced with inversely proportional changes in the real impedance of the tag antenna measured for 20 s, centered at 294 MHz with a tolerance of 10 MHz; the corresponding distance to the peak impedance values is found with respect to the extreme positions, which generate the dynamic measurement range. The device presented shows potential for use in continuous monitoring of respiratory frequency in clinical settings. In El Gharbi et al., 32 a sensor antenna is designed using the CST Studio microwave toolbox with a silver-coated nylon thread implanted in the patient’s chest, allowing it to transmit deformation information with respiratory movements using a 2.4 GHz ISM frequency as a tag; the receiver mechanism is based on detecting the received wireless signal strength (RSSI) via Bluetooth, with changes observed during various patient scenarios: between −80 and −72 dBm during normal breathing, −88 to −79 dBm when the speaks, and −85 to −80 dBm changing position while down.
Although all the techniques mentioned in the state of the art of the subject have their own applications and benefits, patch antennas on textile substrates stand out as a versatile, relatively low cost and effective option for the exploration of the rib cage and the detection of respiratory events. Wearable patch antennas used as thoracic deformation sensors have an important advantage over other techniques due to their non-invasive ability to adapt to the curvature of the human body directly or on the patient’s clothing, achieving the necessary sensitivity to capture a greater amount of information within the range of the sensor, providing great performance, reliability, and ease of use in monitoring thoracic excursion18,33–35; This makes them ideal for the detection of respiratory events in clinical and field settings. In addition, new techniques, design tools, and textile materials continue to evolve, allowing continuous improvements in the quality of their instrumental functionalities and the precision in the detection and study of respiratory pathologies.17,29,32
The purpose of this study is to design and implement a wearable patch antenna that serves as an efficient thoracic excursion sensor. To this end, we used professional antenna design software CST that interpolates radiofrequency and mechanical models to create a design methodology based on computational simulations that allowed us to know a priori the behavior of the designed structures and estimate optimal electrical parameters to indirectly measure thoracic excursion with great reliability. According to the results of the computational simulations, we adjusted the antenna–sensor implementation technique to achieve results as close as possible to those proposed. Subsequently, by means of laboratory measurements, we characterized the wearable patch antenna to determine its usability and validity as a thoracic excursion sensor in different clinical scenarios demonstrating its efficiency, sensitivity, and precision for this type of measurements.
This article is structured as follows: Section 2 describes the materials and methods used to design and implement the patch antenna as a mechanical strain sensor; Additionally, the anthropometric method used to measure thoracic excursion in clinical settings is explained. A flowchart of the method applied to measure thoracic excursion using the sensor-antenna is also provided. Section 3 illustrates the responses of the sensor-antenna, and data processing showing changes in resonant frequency associated with respiratory thoracic deformation of three patients: one with sleep apnea, another with asthma, and a high-performance athlete. Finally, the discussion of said results and the respective conclusions are presented in Sections 4 and 5.
Materials and methods
Choice of dielectric and conductive material
Designing patch antennas with dielectric substrates and-textile materials, of rigid circuit boards (such as FR4), allows antennas and small sensors to be easily integrated directly into clothing or the human body, in a comfortable, non-invasive, and safe manner (usability conditions); naturally and compactly adapting to the curvatures of the human body, allowing to withstand normal clothing usage conditions, multiple deformations, even washing, and therefore, their reuse (which reduces clinical costs).12,13
However, fabrics are rough, porous, and heterogeneous, with air between the fibers, making their characterization difficult; the fibers’ ability to absorb moisture must also be considered in the characterization of the dielectric behavior of textiles. Additionally, textile materials are anisotropic, so their characterization also depends on the orientation of the electric field. In turn, the dielectric behavior of textile materials depends on the properties of the fibers and the density of their packing in the fabric weave. In summary, the dielectric properties of the textile material used depend on the operating frequency and temperature, surface roughness, as well as moisture content, purity, and homogeneity.13,14
After a literature search in the state of the art of wearable antennas, 4 textiles were preselected: polycot, a composite material of 60% polyester and 40% cotton; sakura, 100% polyester composite; Memphis, a blend of 90% polyester and 10% elastane; and bell, a blend with 85% polyester and 15% cotton. The choice of a textile that combines polyester and cotton, such as polycot, stands out for its excellent set of mechanical properties. This combination provides notable resistance to wear and abrasion, resulting in a durable fabric that maintains its structural integrity even after extensive use. Additionally, the textile blend offers resistance to shrinking and wrinkles, facilitating maintenance and extending the lifespan of garments. In summary, polycot not only offers excellent strength and durability but also ease of care, making it ideal for a variety of biomedical textile applications.12–17
Furthermore, the choice of textile polycot stands out for its favourable electromagnetic properties, especially in terms of relative permittivity and tangential losses. The presence of polyester in the blend contributes to a lower relative permittivity compared to other textile materials, which can result in reduced electromagnetic interference and improved insulation capacity in applications requiring precise control of electromagnetic signals. Additionally, the combination of polyester and cotton can help reduce tangential losses, resulting in lower absorption of electromagnetic energy and more efficient signal transmission. Flexible copper foil was also used as the conductive material of the patch and ground plane, providing good conductivity and flexibility.14,15,17
Mechanical characterization
In terms of mechanical properties, the Young’s modulus is measure of the stiffness and strength of the material against deformation; a low modulus indicates that it is malleable and has good tensile strength. For patch antennas, it is important that the material used has the ability to maintain its shape structure even when exposed to mechanical stresses and deformations. Polycot has a suitable Young’s modulus that allows patch antennas to maintain their shape and performance even under intensive usage conditions, such as monitoring chest deformation during sleep stages. As for the Po’s ratio, this parameter indicates the relationship between longitudinal and transverse deformation of the material when subjected to a mechanical load; a low Poisson’s ratio means the material has a greater ability to recover after deformation. Polycot has a relatively low Poisson’s ratio, making it resistant to deformations and allowing patch antennas to regain their original shape even after experiencing mechanical stresses under different loading conditions.13–15,17
As the antenna will be subjected to stress, it will linear deformation; turn, the orthogonal deformations in the Poisson’s ratio will be longitudinal and transverse. These two properties will be responsible for generating deformation in the metal patch, causing it to experience elongation (ΔL), which results in a shift in the antenna’s resonance frequency. To carry out the mechanical tests, it is necessary to design specimens with the textile materials that make up the antenna-sensor. ISO standards (13934-2: 1999, ASTM D5034-95, AS 2001.2.3.1-2001, and AS 2001.2.3.2-2001) establish that the textile specimen should have dimensions of 25 mm wide by 150 mm long, adding 50 mm at each end to allow gripping by the grips of the Universal Testing Machine. This imposes a deformation by moving the movable head at a speed of 250 mm/min, so that the load cell connected to the grip delivers a signal representing the applied load in Newtons (N), recording the corresponding position data in mm. After performing the stretching test protocol for the polycot textile, the software of the machine provides a file that is exported to Excel, from which the force and displacement data are taken, plotted in Origin software to obtain the mechanical behavior graph and then estimate the Young’s modulus, as the slope of the most linear region, in this case 147.69 MPa. 36
Electromagnetic characterization
To characterize the polycot, was employed the method presented in Montoya Montoya and Gaviria Gomez
37
that involved constructing a resonant cavity; from the measurements of the return losses of each port
Design and implementation of the patch antenna as a sensor
Taking the previous characterization values, the poly-cotton flexible copper patch antenna illustrated in Figure 2 was designed for a frequency of 2.4 GHz, using the equations presented below. According to Balanis,
40
the patch width (W) has a minor effect on the resonance frequency

Where
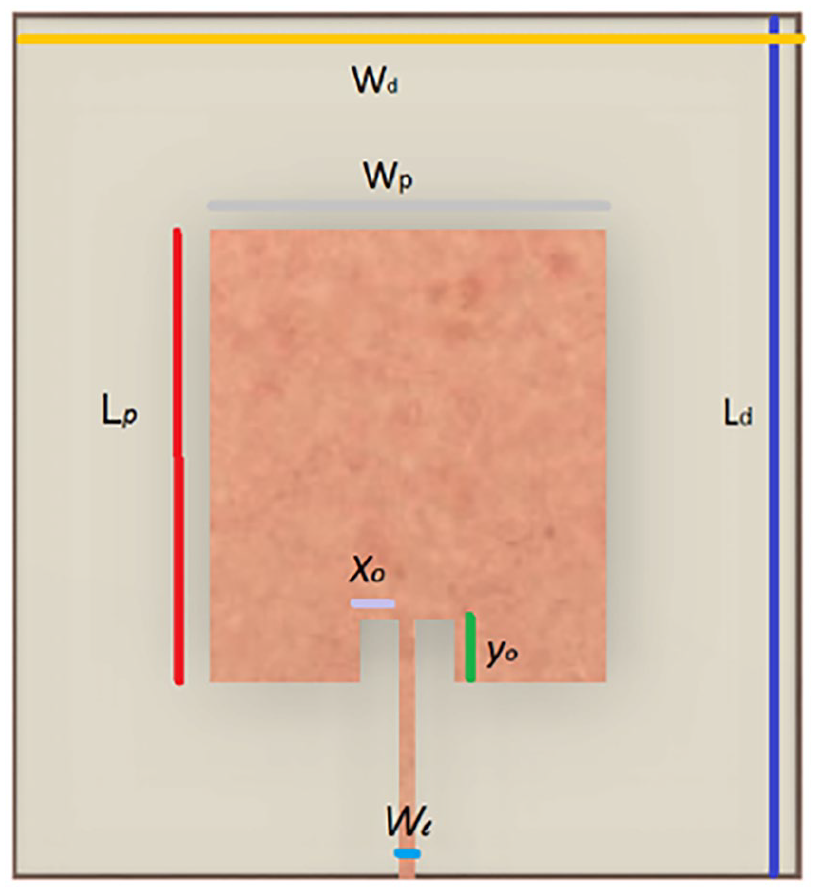
Design parameters.
The physical length of L will be:

The electrical length of the patch

The initial values (at low frequencies) of the effective dielectric constant are known as static values, and are given by equation (4), where h is the thickness of the dielectric:

The actual increase in patch length (

The parameters and dimensions of the designed patch antenna are detailed in Table 1 and Figure 2.
Dimensions of the wearable patch antenna.

As shown in Table 1, in the simulation the dimensions of the antenna are 10.9 cm × 9.12 cm, offering a good coverage of the human rib cage, which, on average, measures 32 cm × 15 cm.33,34 The simulation was carried out using CST Studio Suite: Electromagnetic Field Simulation Software. It resulted in the expected resonant frequency of 2.4 GHz, a return loss of −19 dB, and an impedance matching with the feedline measured on the Smith chart of 48.90 – j5.17 Ω, as detailed in Figure 3(a).

Antenna values obtained in simulation versus implementation. (a) Reflection coefficient
In the practical comparison, it was used a Rohde & Schwarz Vector Network Analyzer (VNA) to obtain the experimental values, Figure 3(a) and (b). The result was a resonant frequency of 2.43 GHz, a return loss of −25.12 dB, and an impedance matching of 52.7 + j0.7 Ω. The difference between these results and those from the simulation is due to the insertion loss of the SMA connector, in addition to other irregularities related to the porosity and high moisture absorption of the textile material.23,35
Validation of the patch antenna as a mechanical strain sensor
For the implementation of the antenna was cut the flexible copper ground plane and plate following a protocol that implements the surface micromachining method with a Computer Numerical Control (CNC) machine. Then, it was cut and sewed manually the textile material using a conventional thread. With the antenna already built, it was conducted a mechanical deformation test employing the Shimadzu universal testing machine of the Polymer Laboratory at Instituto Tecnológico Metropolitano (ITM) in Medellín. The above, considering that the deformation in the tetrahedral mesh of the antenna–sensor leads to shifts in its resonance frequency.36,41,42 In this experimental test, it was defined two points of support at the lateral ends of the antenna (Points 1 and 2 in Figure 4) and a loading nose along the Z axis (Figure 5). A force between 1 and 2.8 N with steps of 0.2 N was applied and a change in force every 5 mm of displacement. For the deformation test, it was added a strain gauge connected to the P-350 Division’s Portable Strain Indicator to measure the changes in units of micro-strain

Experimental setup for the mechanical deformation measurement protocol.

Antenna deformation.
As explained in Wang et al.
41
and Arango Toro et al.,
36
for a positive strain

The experimental results relating force, strain, and resonant frequency are presented in Figure 6 and listed in Table 2.

Frequency shifts of the antenna when it is deformed.
Relationship between force, strain, and resonant frequency.

Figure 6 and Table 2 show that as the force on the loading nose (ASTM D790) universal testing machine increases with constant steps, the antenna–sensor deforms with proportional increments
With the tabulated data, it was proceeded to interpolate the variables to obtain a transduction equation that would allow us to characterize the antenna deformation with the frequency shifts obtained. The graph and equation are illustrated in Figure 7.
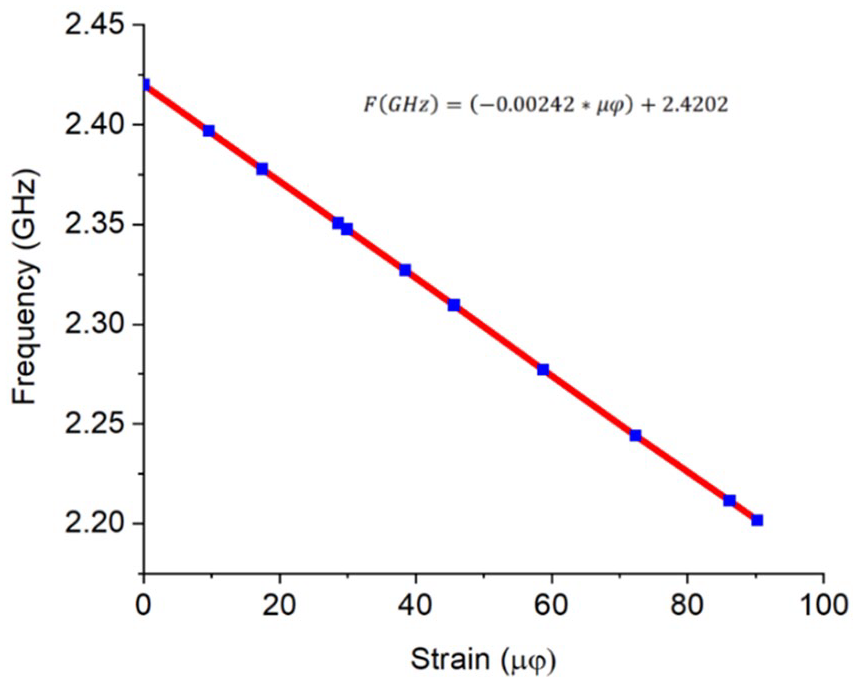
Strain versus Frequency transduction equation and graph.
Based on this graph and its equation it can infer that the antenna operates adequately as a mechanical deformation sensor. It produced a linearly decreasing resonant frequency as the force applied along an axis was increased. This is also explained in Roudjane et al. 43 and Herbko and Lopato. 44
Anthropometric method to measure thoracic excursion in clinical settings
During the monitoring and clinical diagnosis of respiratory diseases, physical examination of the chest and measurement of its excursion are typically performed following manual procedures, such as percussion, palpation, auscultation, and inspection. The measurements obtained by the specialist during the medical assessment require specific skills and expertise; however, they can be complemented with technological tools to ensure increased accuracy and reliability, as suggested in Pasterkamp. 45
To objectively analyze the results of the chest physical examination, it is usually divided into regions, which is very convenient for preliminary studies in the diagnosis of diseases affecting the respiratory system. The definition of the topographic regions and reference lines coincides with the natural anatomical division. Specifically, the thorax is subdivided into three regions: anterior, posterior, and lateral. Chest examination only covers the anterior and lateral regions. The first step is to identify the lines and regions that allow specialist to topographically locate pleuropulmonary alterations in order to follow the orderly sequence of the physical examination. 46 As shown in Figure 8, 47 the midsternal, parasternal, and midclavicular lines are delimited in the anterior region of the thorax. Likewise, Figure 9 shows the lateral region delimited by the anterior, middle, and posterior axillary lines.47,48

Anterior region of the trunk.

Lateral region of the trunk.
Method for measuring thoracic excursion using the antenna–sensor
To automate the physical examination process described above, we here propose a method for measuring thoracic excursion using the antenna–sensor. Figure 10 shows the flowchart of the proposed method.

Flowchart of the proposed method for measuring thoracic excursion.
As shown in the flowchart, the proposed method starts with an anamnesis, which involves an initial interrogation by a health professional to gain information on patients’ physical condition and determine whether they have any respiratory disease. The information gathered from this first step is key for the anthropometric assessment, as it can be used to determine the region where the antenna–sensor should be placed to achieve a more accurate reading. According to different studies in the specialized literature, sensors should be placed on the lateral region of the trunk in patients with obesity and related respiratory disorders and on the anterior region of the trunk in healthy subjects or athletes.33,50 In this study, it was validated such statements by using a measurement protocol to find the best location for the antenna–sensor depending on the type of patient. Also, it was checked if the measurements were affected by the electrical and mechanical properties of the patients’ skin. To do so, it was conducted several experimental tests under four different scenarios: (i) sensor placement on the anterior region of the thorax with shirt on – ARWS, (ii) sensor placement on the anterior region of the thorax with no shirt on – ARWNS, (iii) sensor placement on the lateral region of the thorax with shirt on – LRWS, and (iv) sensor placement on the lateral region of the thorax with no shirt on – LRWNS.
The first step in the measurement protocol was to calibrate the VNA and check its response in the ISM band from 2.4 to 2.485 GHz. In addition, the VNA was set to automatic sweep mode to collect 30 data points with a 2-s interval between each measurement. After that, the antenna–sensor was placed on the patients’ body using stretch film, and patients were asked to naturally and slowly inhale and exhale until reaching a frequency shift that allowed the sensor’s dynamic range and sensitivity to be analyzed. To plot the frequency shifts, the VNA data, which included the phasor diagram of return loss (magnitude and phase angle –
Reliability of the measurements
The purpose of statistical data analysis is to explain a complex real-world phenomenon using partial and uncertain observations. This analysis consists in studying the behavior of two variables to determine whether there is a functional relationship (cause and effect) between them and quantify their degree of correlation. A correlation analysis often starts with a graphical representation of the relationship between pairs of data via a scatter plot. This tool shows a certain geometric trend (generally a linear trend) for a group of data, pairs of data, or observation points while also indicating if the two variables under analysis are correlated. 51 Moreover, the Pearson’s correlation coefficient (r) is used to measure the rate at which the values of two correlated variables change. This coefficient can take values between −1 and 1. A positive correlation indicates that the values of the two variables increase or decrease together, whereas a negative correlation suggests that the value of one variable increases as the value of the other decreases, and vice versa.51,52
Results
Following the characterization and calibration of the antenna–sensor, it was implemented the method shown in Figure 10 to indirectly measure thoracic excursion. Participants in this study included three representative cases: (i) a patient with sleep apnea; (ii) a patient with a respiratory disease (asthma); and (iii) a athlete, which is considered the ideal patient.
Anamnesis of patients
It the physical examination of thoracic cage, which includes percussion, palpation, auscultation, and manual inspection, as a necessary part of the clinical monitoring process for the diagnosis of respiratory pathologies and diseases. Obviously, it requires expertise and sensitivity from the medical specialist, and it is highly appropriate to complement it with instrumentation techniques that provide precision and reliability. In the anamnesis, the thoracic cage should be divided into three regions: anterior, posterior, and two laterals; then, lines and regions are marked on each surface of these regions to allow for the topographic localization of pleuropulmonary alterations, so that following them allows for an orderly sequence of the physical examination of the chest. Depending on the patient’s general condition, the examination can be performed in a standing, sitting, or lying position; however, the ideal position is with the patient comfortably seated, with the back upright and hands resting on both knees.
For this experimental stage, the clinical intervention of a physiotherapist, who conducted the anamnesis for each patient in order to measure their thoracic deformation. Thus, two measurements were taken for patient using a tape on the surface relative to the mid-sternal line (parasternal and midclavicular), and one measurement between the anterior and lateral lines, in order to determine the most sensitive region of the patient from an anthropometric perspective. With this data, the clinical record of the anamnesis for each patient was created, in addition to determining the dynamic range that the sensor should have for each of them.
Patient 1
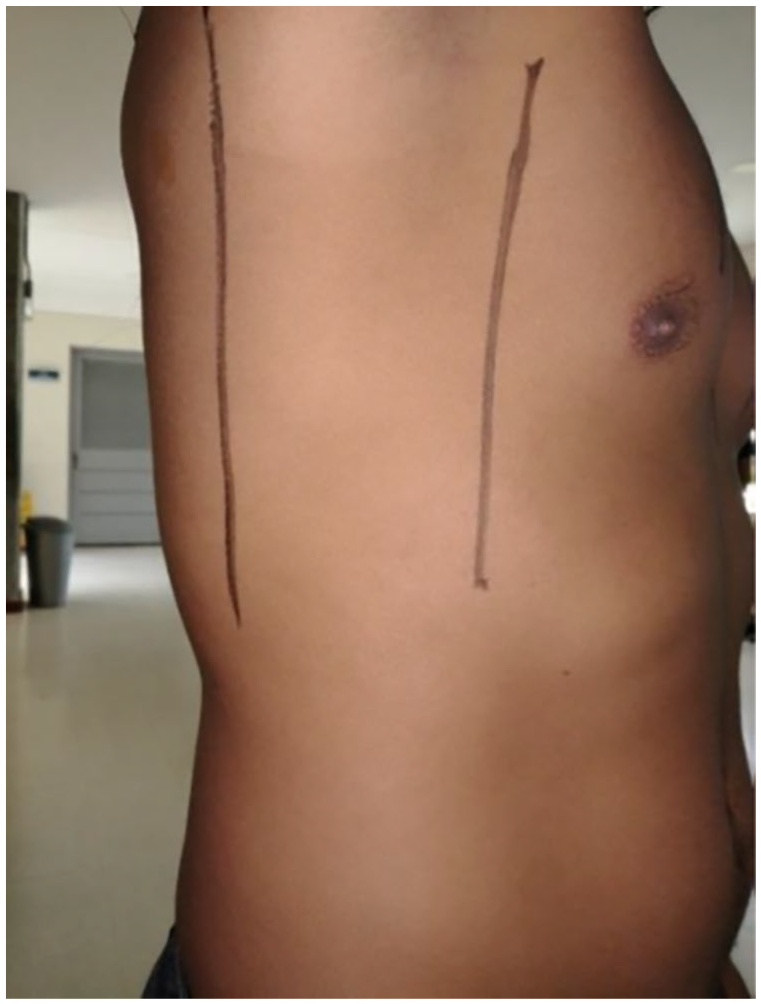
A 57-year-old male patient with sleep apnea and a Body Mass Index (BMI) of 35.32, whose chest examination revealed a barrel-shaped chest, symmetry and elasticity during inhalation and exhalation, and no unusual respiratory movements. At inspiration and expiration, chest expansion in this patient was from 2.3 to 2.4 cm in the midsternal line (see Figure 11), from 6.5 to 6.6 cm in the midclavicular line (see Figure 10), and from 6.7 to 7.1 cm in the anteroposterior axillary line (see Figure 12).

Chest anterior region.
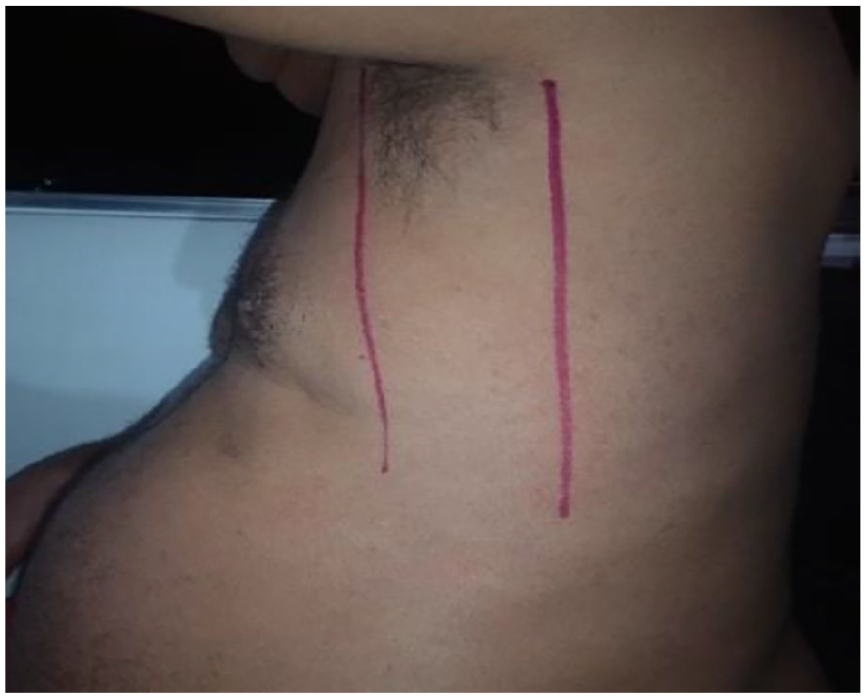
Chest lateral region.
Due to his medical conditions, this patient showed a greater thoracic excursion in the lateral region. This is attributed to an increase in the anteroposterior diameter of the thoracic cavity, which results in increased intrathoracic volume to aid pulmonary ventilation. Considering this, the antenna–sensor was placed on the lateral region of the patient’s trunk. Under basal conditions, obese patients typically exhibit a slow and shallow breathing pattern that reduces their breathing effort. This was considered in the measurement protocol to determine the sample time.
Patient 2
A 44-year-old male patient with asthma, a Body Mass Index (BMI) of 29.7, and overweight, whose chest examination revealed a cylindrical chest, symmetry and elasticity during inhalation and exhalation, and no unusual respiratory movements. At inspiration and expiration, chest expansion in this patient was from 2.3 to 2.4 cm at the midsternal line (see Figure 13), from 6.5 to 6.7 cm at the midclavicular line (see Figure 13), and from 6.7 to 7.2 cm at the midposterior axillary line (see Figure 14).

Chest anterior and region.
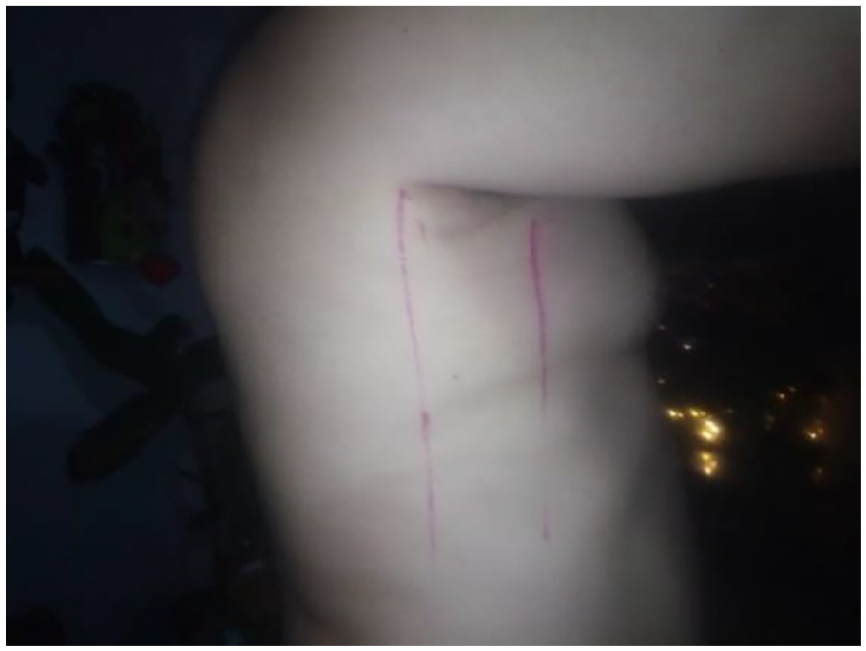
Chest lateral region.
Obesity and some respiratory diseases such as asthma cause mechanical effects on the respiratory system, resulting in a decreased tidal volume and functional residual capacity. As a result, chest expansion leads to decreased diaphragmatic or abdominal breathing and an increased lateral breathing. Considering this, the antenna–sensor was placed on the anterior region of the patient’s trunk.
Patient 3
A 26-year-old male patient, underwater rugby coach with a Body Mass Index (BMI) of 26.64, whose chest examination revealed a conical-shaped chest, symmetry and elasticity in the lateral and anterior regions during inhalation and exhalation, and no unusual respiratory movements. At inspiration and expiration, chest expansion in this patient was from 2.5 to 3 cm at the midsternal line (see Figure 15), from 8.1 to 8.8 cm at the midclavicular line (see Figure 15), and from 9 to 9.2 cm at the anteroposterior axillary line (see Figure 16).

Chest anterior region.
Chest lateral region.
The physical activity (underwater rugby) performed by this subject demands a regulation ability to achieve a controlled breathing pattern at volumes and flow rates significantly higher than the normal ones. The thoracic wall must expand in response to the additional pressure exerted during water immersion. As a result, the resistive load during inspiration and expiration increases and so do the contraction speed of the respiratory muscles and the performance of accessory muscles. Thus, since this subject exhibited a thoraco-abdominal breathing pattern, the sensor was placed on the anterior region of his trunk.
Measurements taken using the antenna–sensor
After the anamnesis and chest examination, the measurements were recorded using the antenna–sensor. As previously stated, although the information gathered from the anamnesis of each patient gave us a hint of the region of the trunk where the antenna sensor should be placed, this suggested location was validated as part of the measurement protocol. Thus, to manually identify the area with the greatest thoracic excursion and where the sensor would be placed, patients were instructed to take a deep breath. The measurements were taken in the abdominal and lateral regions of the trunk, with and with no shirt on, to compare them, and find the optimal measurement scenario. The goal of taking measurements in the anterior and lateral regions of the trunk was to identify the area with the greatest thoracic excursion. Likewise, the purpose of taking measurements with and with no shirt on was to determine whether the relative permittivity of the shirt fabric or the body’s bioimpedance affected the measurements.
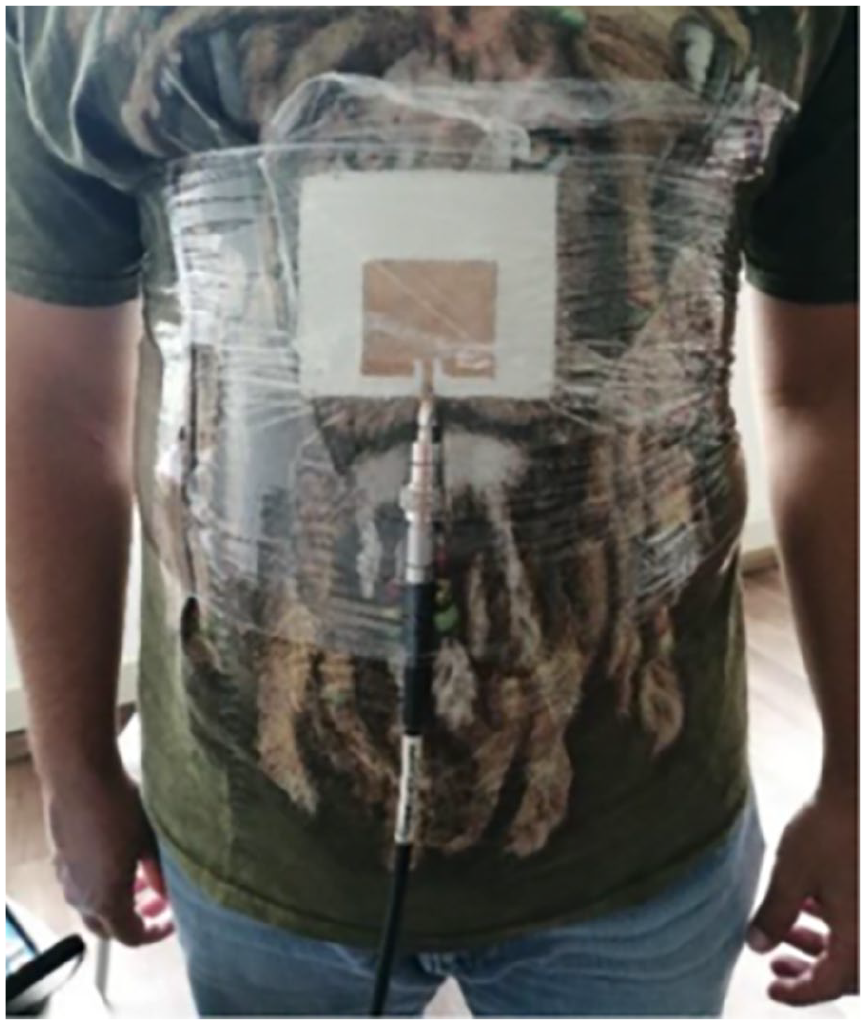
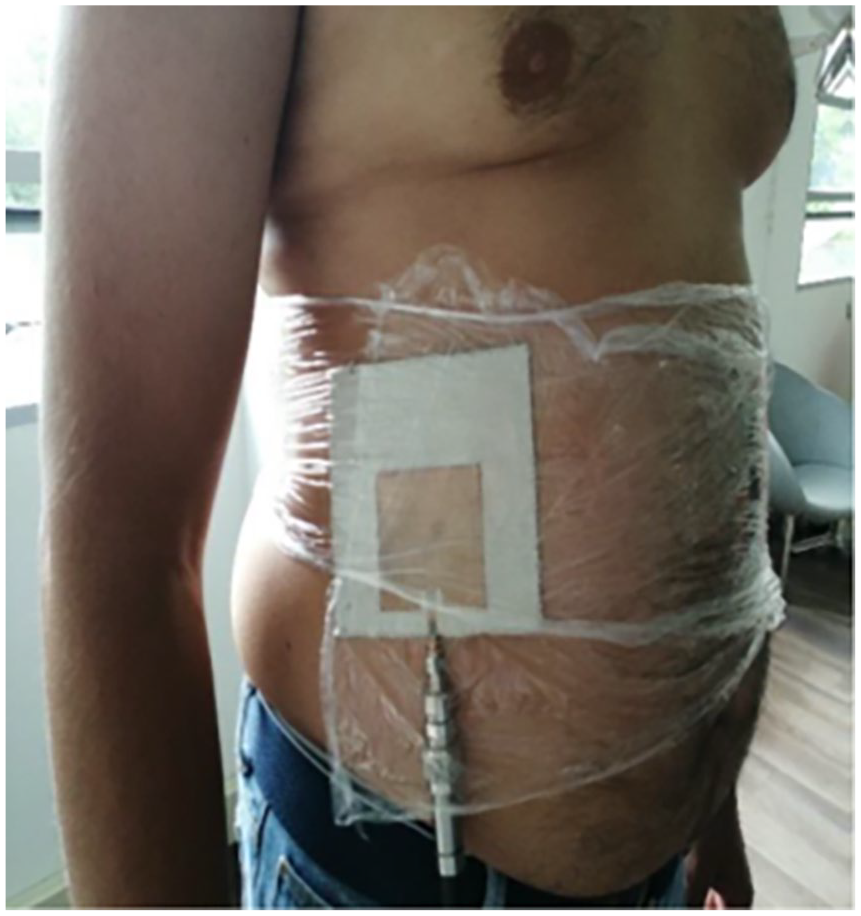
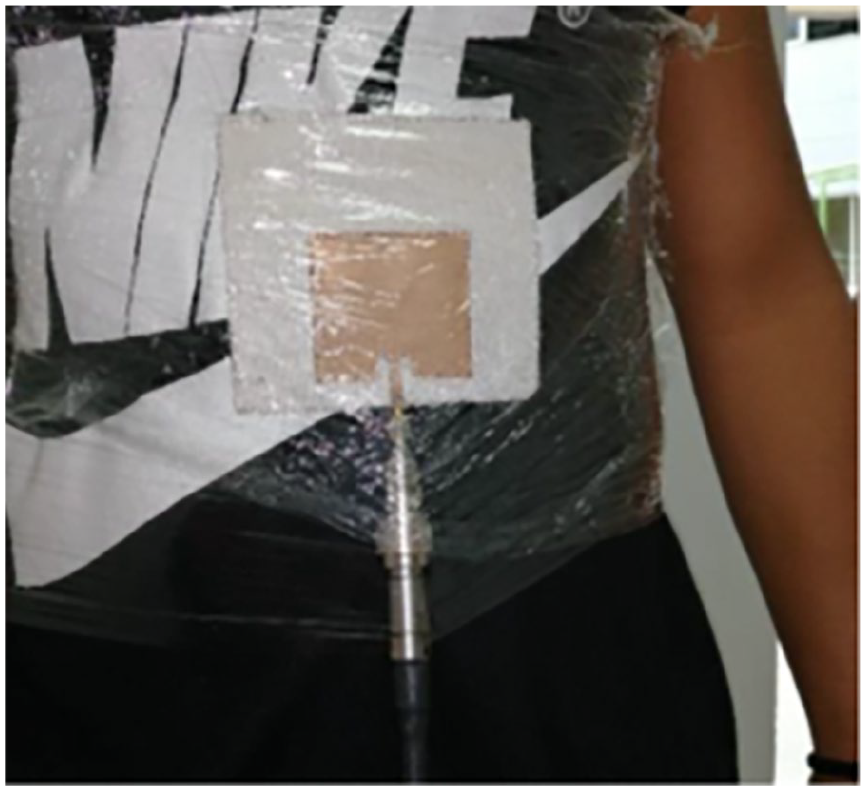
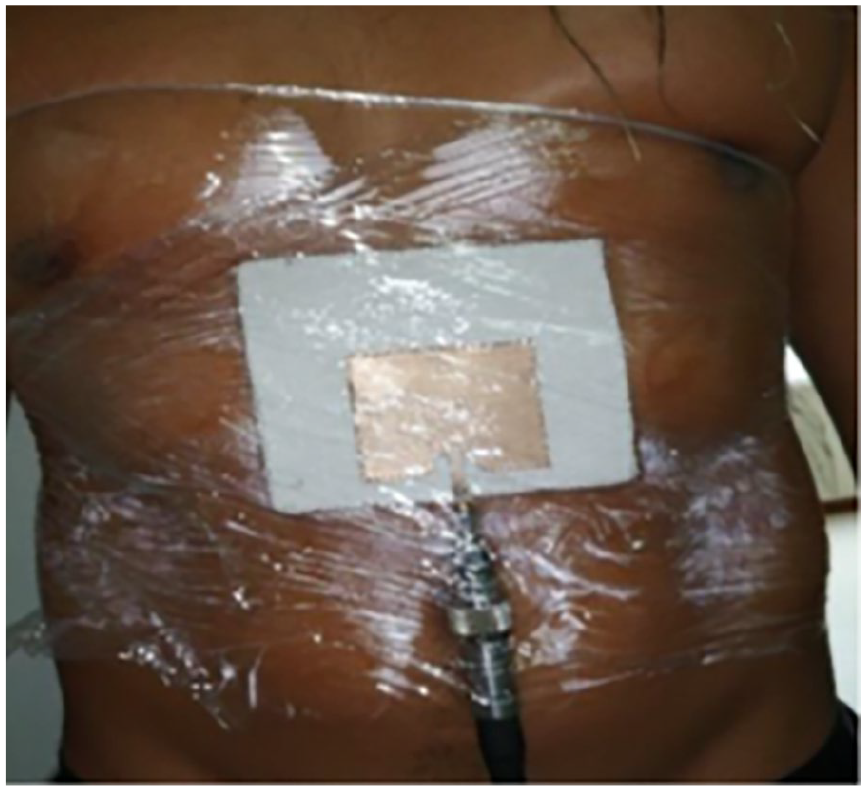
Even though the information obtained from the anamnesis of Patient 1 (who has sleep apnea and class 2 obesity) suggested to place the antenna–sensor on the lateral region of the trunk, we implemented the measurement protocol described above considering the following measurement scenarios: anterior region of the trunk with and with no shirt on (Figures 17 and 18) and lateral region of the trunk with and with no shirt on (Figures 19 and 20).

Anterior region of the trunk with shirt on (ARWS).

Anterior region of the trunk with no shirt on (ARWNS).
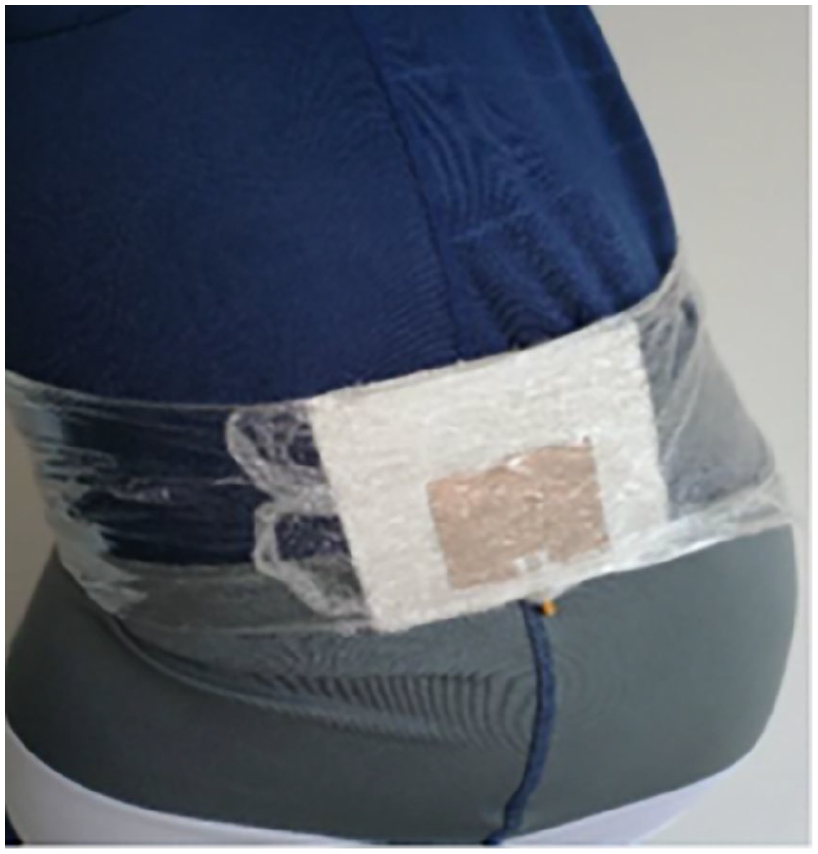
Lateral region of the trunk with shirt on (LRWS).

Lateral region of the trunk with no shirt on (LRWNS).
Figure 21 shows the normalized strain values of the four scenarios mentioned above for Patient 1: anterior region of the trunk with shirt on (ARWS), anterior region of the trunk with no shirt on (ARWNS), lateral region of the trunk with shirt on (LRWS), and lateral region of the trunk with no shirt on (LRWNS).

Normalized measurements in the four scenarios under analysis (Patient 1).
As observed in Figure 21, the sensor showed a sensitivity of −2.41. and −2.31 MHz/
The same measurement protocol was used on Patient 2 (who has asthma and is overweight) to determine the ideal location for the sensor and to compare the data obtained in terms of thoracic excursion with the results of the anamnesis. Four measurements were taken in each region, as shown in Figures 22 to 25.
Anterior region of the trunk with shirt on (ARWS).

Anterior region of the trunk with no shirt on (ARWNS).

Lateral region of the trunk with shirt on (LRWS).
Lateral region of the trunk with no shirt on (LRWNS).
Figure 26 presents the normalized measurements obtained for Patient 2 using the antenna–sensor. As can be seen, the best sensitivity results were achieved for the LRWNS and LRWS scenarios, with a sensitivity of −2.56. and −2.46 MHz/

Normalized measurements in the four scenarios under analysis (Patient 2).
Because this patient’s dynamic lung volumes decreased during the experimental tests, the frequency shifts in the anterior region of the thorax did not exceed 100 MHz. In addition, tidal volume and respiratory rate increased, as did the ratios of inspiratory time to total respiratory cycle time. Due to this patient’s breathing pattern, which is diaphragmatic as a result of air trapping, the rib cage expands more to the sides, which causes measurement sensitivity to be higher in the lateral region of the thorax.
Regarding Patient 3 (underwater rugby coach), he exhibited a thoraco-abdominal breathing pattern. The same measurement protocol used on the two other patients was applied to this subject, and the scenarios considered are presented in Figures 27 to 30.
Anterior region of the trunk with shirt on (ARWS).
Anterior region of the trunk with no shirt on (ARWNS).

Lateral region of the trunk with shirt on (LRWS).

Lateral region of the trunk with no shirt on (LRWNS).
As shown in Figure 31, the sensor’s sensitivity in the ARWS scenario was −2.48 MHz/

Normalized measurements in the four scenarios under analysis (Patient 3).
Figure 32 shows the region where the sensor had the highest sensitivity in each patient, which varied depending on everyone’s cardiopulmonary capacity and body fat percentage. As observed, the highest sensitivity in Patient 1 was obtained in the lateral region of the thorax, with a value of −2.41 MHz/

Region where the sensor showed the highest sensitivity in each patient.
All of the results mentioned above are highly consistent with those of the chest examination during the anamnesis, which revealed a 4 and 5 mm expansion in the lateral region in Patients 1 and 2, respectively, and a 2 mm expansion in the lateral region in Patient 3. This means that expansion in the lateral region in Patients 1 and 2 was higher than in Patient 3. However, in the anterior region, Patient 3 exhibited a 7-mm expansion, whereas Patients 1 and 2 showed a 1 mm expansion. In Patients 1 and 2, the sensor’s sensitivity was affected by the body fat percentage in the abdominal region, which limits the ability of the chest to expand.
Data processing
The measurements were taken using a Rohde & Schwarz VNA, a low-loss cable, and a data cable. The VNA was set up in S11 mode and calibrated at the same frequency range – with a spam of 500 MHz for the entire protocol – to obtain consistent results that favored data comparison. The sensing frequency range was between 2.35 and 2.42 GHz in Patient 1, between 2.4 and 2.56 GHz in Patient 2, and between 2.23 and 2.53 GHz in Patient 3. Ten measurements were recorded using the FSH4 View software, with sampling every 2 s until 30 data points were collected. In addition, we selected ten sites in the critical regions during patients’ inhalation and exhalation.
The data obtained from each frequency point were exported to an Excel table, and the frequency was scaled in GHz. Then, the data were organized in two columns – frequency versus return loss (S11) – and 10 graphs of the frequency shifts caused by the stress applied by the respiratory movements to the conductive material were obtained. The stress applied to cause each frequency shift was estimated using equation (1), and the behavior of the sensor was plotted, revealing a linear equation with a negative slope.
After having the reference point where the antenna–sensor was placed in each patient and the strain versus frequency graphs, we built a scatter plot that produced the linear regression equation. Once the data were organized (x- and y-axes), the correlation between the data and the coefficient of determination were estimated for each patient.
Table 3 shows the chest measurements taken from Patient 1, as well as the associated strain values. In this patient, the measurements were taken in the lateral region of the thorax with no shirt using a tape measure. Before taking the ten measurements, a reference point was marked on the measurement site for manual comparison. Regarding the strain values, they were calculated based on the frequency shifts caused by a change in the electrical length of the patch when subjected to mechanical stress. Thus, the frequency data obtained from the VNA were transformed using Equation (6).
Chest measurements and associated strain (Patient 1).

For error computation, the reference point was compared to the results of the ten measurements. The error was estimated by comparing the frequency shifts that were used to calculate the strain. According to the results, the error rate of the sensor was ±1.3%, with an accuracy of ±0.030 mm. Figure 33 plots the linear regression of the 110 data points obtained from the lateral region of the thorax of Patient 1. Also, this figure shows the correlation and coefficient of determination of the frequency data, as well as the strain values (

Reliability of the data obtained from Patient 1.
According to the equation presented in Figure 33, strain (
Following the same procedure used for Patient 1, Table 4 shows the chest measurements taken from Patient 2, as well as the associated strain values. In this case, the error rate of the sensor was ± 1.8%, with an accuracy of ± 0.042 mm.
Chest measurements and associated strain (Patient 2).

Figure 34 plots the linear regression of the 110 data points obtained from the lateral region of the thorax of Patient 2. Also, this figure shows the correlation and coefficient of determination of the frequency data, as well as the strain values (

Reliability of the data obtained from Patient 2.
As observed in Figure 34, strain (
Finally, the same procedure was repeated for Patient 3. Table 5 shows the chest measurements taken from Patient 3, as well as the associated strain values. In this case, the error rate of the sensor was 2.0%, with an accuracy of ±0.052 mm.
Chest measurements and associated strain (Patient 3).

Figure 35 plots the linear regression of the 110 data points obtained from the lateral region of the thorax of Patient 3. Also, Figure 35 shows the correlation and coefficient of determination of the frequency data, as well as the strain values (

Reliability of the data obtained from patient 3.
As can be seen in Figure 35, strain (
Discussion
In this study, the deformation of the rib cage in patients was measured using a wearable patch antenna made of polycot and a flexible copper laminate, designed for an ISM frequency of 2.4 GHz. An instrumental technique of transduction of the wearable antenna was used, allowing the effort produced by the deformation with the respiratory movements of the rib cage to be converted into changes in the original resonance frequency of the antenna. According to the findings, the variation in the resonant frequency of the antenna–sensor was linear and decreasing in the range of 2.15–2.6 GHz (bandwidth of 450 MHz), allowing for the detection of linear changes in thoracic excursion, with a sensitivity inversely proportional to the applied effort of −2.56 MHz/μ
In this work, no measurements or electromagnetic compatibility (EMC) analysis of the wearable antenna implanted the patients’ bodies were carried out, but in accordance with other research.29,53 Its use as physiological sensors is validated without exceeding the regulated radiation values for the specific absorption rate (SAR) in this type of biomedical applications. Then, wearable patch antennas used as thoracic deformation sensors have a significant advantage over other sensing techniques due to their ergonomic adaptability to the patient’s chest, achieving the necessary sensitivity to capture a large amount of information within the sensor’s dynamic range, providing good performance, reliability, and usability.25,43–45 This makes them a good to be used in diagnostic systems and the study of respiratory pathologies in clinical settings or in the patient’s everyday work environments.34,54
Additionally, the technique used in this work included a testing protocol to find the best placement of the antenna-sensor on the patient’s chest, to compare with clinical theory associated with the medical history; this protocol involved taking measurements on three patients, in the central part of the chest (anterior region – AR), and on the side (lateral region – LR), with the antenna directly on the skin (no shirt – NS) and on top of a thin t-shirt (WS); this allowed for a set of four measurements per patient, from which, based on sensitivity criteria and the range of measurement obtained, the best result and therefore the best placement of the antenna was determined. In patients with respiratory pathology and obesity, it was deduced that the greatest deformation occurred in the lateral region of the chest, consistent with the theory of the medical history which states that in these types of patients there is a greater mass of fat in the lateral walls, confirming that the deformation is due to a change in the elastic characteristics of the rib cage that affects the loss of the ability to generate adequate inspiratory pressure. In healthy individuals with regular physical activity, it was also consistent with the medical history to find that due to having adequate lung capacity, the greatest deflection of the rib cage occurred in the anterior region of the chest. 55
According to the pathology of patient 1, with obesity and apnea, the increase in abdominal fat laterally displaced the diaphragm, reducing the lung capacity to “inflate” in the thoracoabdominal region, leading to greater effort to overcome the resistance to respiratory movement. Consistent with the medical history, it is concluded that the respiratory pattern of patient 1 is diaphragmatic as it expands the rib cage more toward the sides,56–58 resulting in a sensor sensitivity of −2.41 MHz/μ
From the search in the specialized literature, no other studies were found like this one that used the information collected from the medical history to validate the data obtained from the sensors. Additionally, no works with similar detection techniques were found to compare results and findings, although there are other ways to transduce variables associated with respiration, including rib cage deformation, into different intermediate variables; for example, changes in impedance 16 or changes in received signal strength indicator (RSSI). 32 The breathing monitoring technique used in this work has the drawback of using a connection cable from the antenna-sensor to a VNA, which restricts the use of the proposed system; however, other monitoring systems also have this limitation, as presented in previous studies.20,34,63 To improve user comfort,23,64 wearable tag systems using real-time wireless communication at an ISM frequency of 2.4 GHz using WiFi or Bluetooth are shown in other works; however, some studies worked with tag antennas at VHF frequencies. 16
Conclusions
This work presents a novel technique to measure thoracic deformation based on the design of a patch antenna with textile substrates and its implementation as a sensor in patients; emphasis is placed on the measurement protocol since it does not use a new design technique or a new antenna geometry. The experimental tests together with the chest box anamnesis showed that the most sensitive area to deformation changes was the lateral region of the chest for patients with pathologies and a body mass index (BMI) greater than 28 (patients 1 and 2); for the athlete (patient 3), the measurement region was the anterior chest because his BMI is 26.64 and he does not have any respiratory pathology. Regarding the sensor sensitivity, the results varied depending on each patient’s cardiopulmonary capacity and body fat percentage the regions of the thorax where the sensor was placed. Furthermore, it was determined that when the sensor was placed directly on the patients’ skin, it exhibited lower dynamic range and sensitivity, so all measurements were taken with the sensor antenna fixed to the patients’ chest over a thin t-shirt.
Consistent with the research hypothesis and the theory consulted in the state of the art, it is concluded that the variation in the resonance frequency of the antenna was linear and inversely proportional to the effort applied by the changes in thoracic excursion due to the respiratory movements of the patients. The sensor exhibited sensitivity and dynamic characteristics, depending on the physiological and morbidity conditions of each patient; for this, the measurement protocol considered different measurement points and scenarios to contrast with the results obtained from the anamnesis.
As future work it is desired to subject the manufactured sensor antenna to various washing cycles and re-establish the measurement protocol to show possible changes in its electrical behavior at high frequency. In the same way, it is intended to design a lung phantom and characterize it with the anthropometric measurements of each patient, to establish a comparison with the experimental measurements. And, finally, use the sensor antenna as part of a biomedical system that allows monitoring more vital signs of patients for practical purposes of measuring their respiratory rate, lung capacity, performance before different physical efforts (e.g. in high-performance athletes), diagnosis of diseases or other kinds of disorders associated with respiratory problems, among others. This is the initial step toward the automation of the proposed measurement protocol in smart digital devices for respiratory rate monitoring in biomedical applications.
Footnotes
Acknowledgements
To the technical staff and equipment of the “Artificial Vision and Photonics laboratory” and “Polymeric materials laboratory” of the Instituto Tecnologico Metropolitano (ITM), for your valuable help in the experimental process.
Declaration of conflicting interests
The author(s) declared no potential conflicts of interest with respect to the research, authorship, and/or publication of this article.
Funding
The author(s) received no financial support for the research, authorship, and/or publication of this article.