
Abstract
This study aims to develop a process that automatically extracts various flat sketch elements in vector format from clothing images. The approach of this study is to combine state-of-the-art image processing algorithms with the new algorithm devised in this study. First, a convolutional neural network based edge detection model trained with specially prepared fashion image data set was used to convert clothing images into edge maps. Then, a recurrent neural network based vectorization model and a rule-based image correction algorithm were used to convert the edge map into a vector image. Finally, a graph search algorithm was used to extract closed shapes from the vector image. As a result, the accuracy of edge extraction model has been improved by training with the special fashion image data set. The image correction rule was able to refine the vector images generated by the vectorization model. The graph algorithm was able to extract closed shapes from the vector image. This study is the first study to extract vector style flat sketch elements from clothing images using artificial intelligence and conventional computational geometry.
Introduction
Flat sketch, which is also known as technical drawing, is a drawing of clothing to represent its design and sewing information. Flat sketches are especially important for ready-to-wear garments because those garments are usually designed by changing the subtle detail of existing garments while maintaining the original look and feel of them. 1 A flat sketch can provide all the necessary information about a new design even without a concept drawing. However, in the fashion industry, flat sketches are usually drawn by hand, which is inefficient as well as subjective. Sometimes a commercial drawing software such as Adobe Illustrator (Adobe, USA) is used but it is still a time-consuming process. To solve these problems, many studies have been made to automate the flat sketch generation process. Wan et al. 2 tried to deform flat sketches according to the given human body posture. Liu et al. 3 tried to integrate fashion design and pattern design processes by creating garment patterns from flat sketches. Some studies have been made on the automation of the flat sketch design process by constructing a flat sketch element database. Mok et al. 4 implemented a system to create a database with the elements of skirt flat sketches and tried to generate new designs that reflects user preferences using the genetic algorithm. Lee and Kim 5 created a database containing the elements of blouse flat sketches and developed a CAD program to automatically combine them. These studies suggested a good approach to automatically create new designs by assembling the elements of flat sketches. Therefore, if various flat sketch elements from existing garments were loaded into the database, the user would be able to create more new designs by combining them. One way to create such a diverse database would be the automatic extraction of flat sketch elements from clothing images.
Edge detection has been used to extract the outlines of flat sketches. One of the most widely used edge detection method is Canny algorithm. 6 Canny used the value indicated by the maximum gradient magnitude in a Gaussian-smoothed image to detect the edges in it. 7 Recently, with the rapid growth of big data and GPU (Graphics Processing Units) technologies, convolutional neural network (CNN) has been standing out in various tasks 8 and it has shown excellent performance in object recognition and edge detection. 9 CNN-based edge detectors extract target features through layer-by-layer abstraction, fusing features of different scales, resulting in enhanced anti-noise capability and heightened robustness.
The holistically-nested edge detection (HED) model, 10 as a CNN-based early edge detector, generates edges by processing information from each convolutional block and creates a multi-scale learning architecture built upon the backbone of VGG16. 11 Recently, Poma et al. 12 proposed a deep learning-based edge detection algorithm using a HED network and an Xception network. This method was able to generate a uniform and thin edge, and can be used for various kinds of edge detection process without additional training or fine tuning processes. This method is considered an edge detection algorithm suitable for generating flat sketches that require thin line compositions.
The outline of the clothing image should be extracted in vector format for further editing process. Image vectorization is an important research topic in computer graphics. 13 Recently, a learning-based approach has increased. Two main approaches in learning-based vector graphics generation involve data-driven methods and those that operate independently of vector training data. Collecting vector training data is not always an easy task. To avoid this, Huang et al. 14 proposed a model generating vector graphics through the decomposition of the target image into an ordered sequence of strokes, mimicking human painting processes on canvases. Since this model was limited to a small fixed image size, Mo et al. 15 introduced a framework employing a recurrent neural network (RNN) architecture capable of generating vector drawings from images of all resolutions. Additionally, by controlling the simplicity of the output vector line drawings through stroke regularization, they achieved more refined results. It is deemed appropriate for the vectorization of flat sketches, characterized by simple and refined line drawings.
In this paper, to prepare a database of various flat sketch elements, an artificial intelligence-based method has been proposed that can extract flat sketch elements from clothing images. First, a CNN-based edge detection model 12 trained by a special dataset named FFIED (Fashion Flats Images for Edge Detection) was used to convert clothing images into edge maps. Then, the edge map was converted into a vector image (SVG format) using an RNN-based vectorization model. 15 At this stage, a rule-based image analysis algorithm was applied to eliminate broken lines. Finally, a graph search algorithm was applied to find closed shapes, which could be grouped as flat sketch elements.
Methodology
Overview
The overview of flat sketch design element extraction method developed in this study is as shown in Figure 1. As shown in Figure 1(a), an edge detection model based on a convolution neural network was used to convert a clothing image into an edge map. The model was trained with FFIED Dataset specialized for fashion flat sketch to increase the accuracy. A recurrent neural network based vectorization model was used to convert the edge map into a vector image as shown in Figure 1(b) (Mo et al. 15 ). In this step, a rule-based algorithm was applied to remove imperfect segments. Finally, closed shapes were generated by applying a graph algorithm as shown in Figure 1(c).

Overview of image analysis process: (a) edge detection model trained with FFIED Dataset, (b) vectorization model and refinement step, and (c) closed shape formation using graph algorithm.
Generation of edge map from clothing image
Generation of edge map using DexiNed
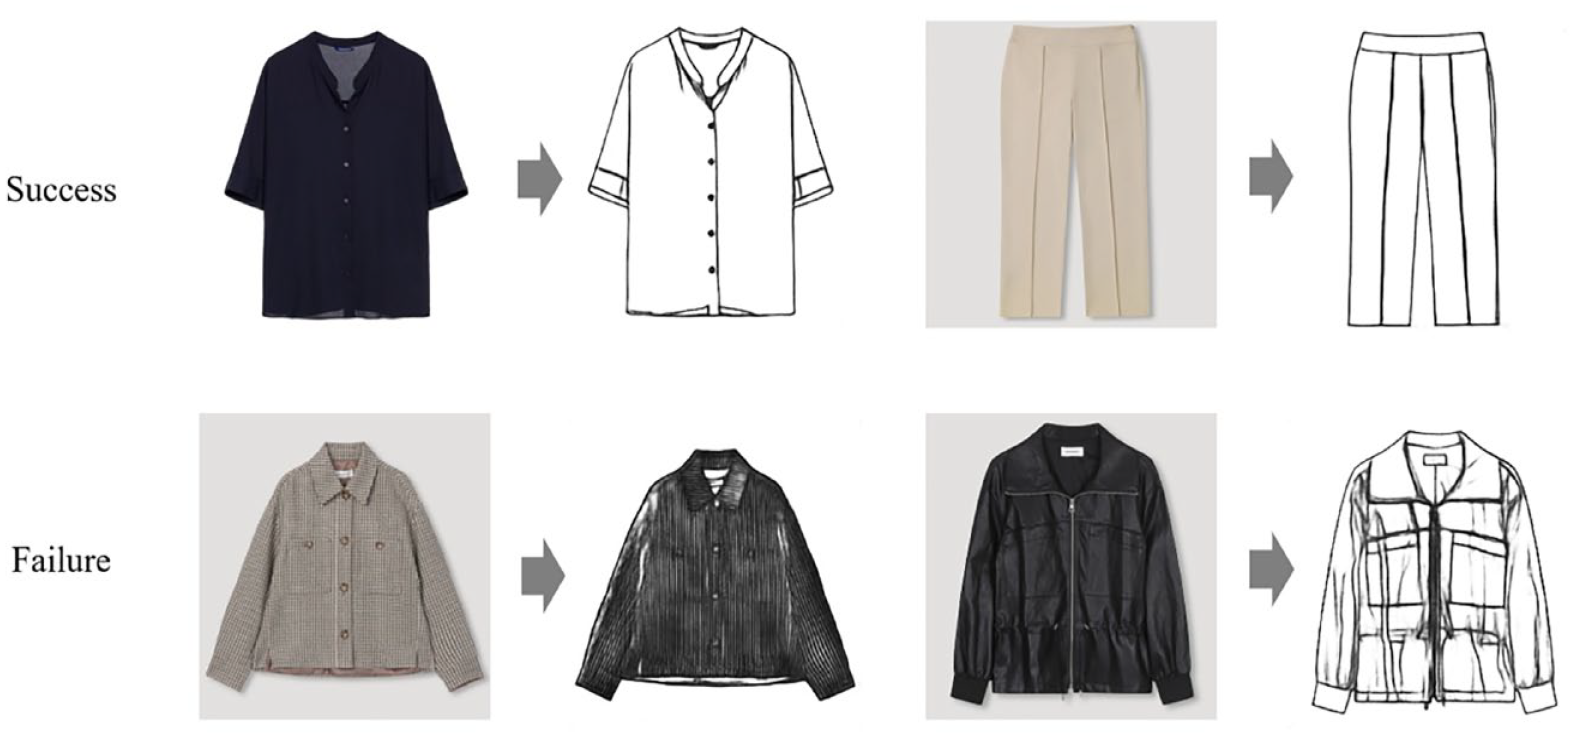
A flat sketch is a two-dimensional drawing of clothing with precise proportions and dimensions. 1 In order to deliver accurate and quantitative information to the production workers, the lines consisting the flat sketch should be clear, smooth, and without any wobbles to express the correct shape of the garments. In this study, the DexiNed (Dense Extreme Inception Network for Edge Detection) model 12 was used to extract lines from clothing image. This model is known to be suitable for producing flat sketches because it has the advantage of generating thin edge maps while minimizing the edge loss. However, the DexiNed network failed to detect edges from the clothing images with printed patterns or wrinkles (Figure 2).
Edge extraction results of DexiNed for clothing images.
This is because the network could not determine whether an edge is important or not. Some lines were discarded which must be preserved such as the armhole line and some lines were broken. Therefore, it was impossible to use the edge map extracted by the DexiNed model directly as a flat sketch. In this study, a fashion-specific dataset has been developed to train the DexiNed model to increase its performance.
Improving the performance of DexiNed model
In this study, a special dataset called FFIED was used for training the DexiNed model to improve its performance. This dataset consists of a total of 250 women’s clothing images, including 110 tops, 35 outers, 35 dresses, 35 skirts, and 35 pants, and the corresponding edge maps. Since the edge maps were drawn by two experts who majored in fashion, they contain not only the boundary lines but also the essential interior lines such as sewing lines. The part of FFIED dataset is as shown in Figure 3.

Part of FFIED (Fashion Flat Images for Edge Detection) dataset.
Two hundred data were randomly selected from FFIED dataset to train the DexiNed model and the remaining 50 data were used for validation. Each image was augmented to 288 images by rotation, mirroring, and gamma correction. Finally, a total of 57,600 data pairs were generated and used for training. The model was implemented with Python 3.7 and Pytorch 1.4. Training was made with the batch size of 8 for 20 epochs and ADAM (Adaptive Moment Estimation) optimizer was used for optimization. After training with the FFIED dataset, the DexiNed model could generate edge maps that can be used as a flat sketch.
Vectorization of edge map
Initial vectorization
Since there is no paired data of raster and vector image to train a neural network in this study, a network model that does not need the training was required. Mo et al. 15 proposed a vectorization model based on a recurrent neural network which predicts vector parameters without the training data and it was used to convert the edge maps into vector images in this study. Converted vector image was saved as SVG (Scalable Vector Graphics) format for further process.
Refinement of vector image
There may still be some broken lines or segments that are too short in the vectorized image. Therefore, some rules have been defined to refine the image as shown in Figure 4.
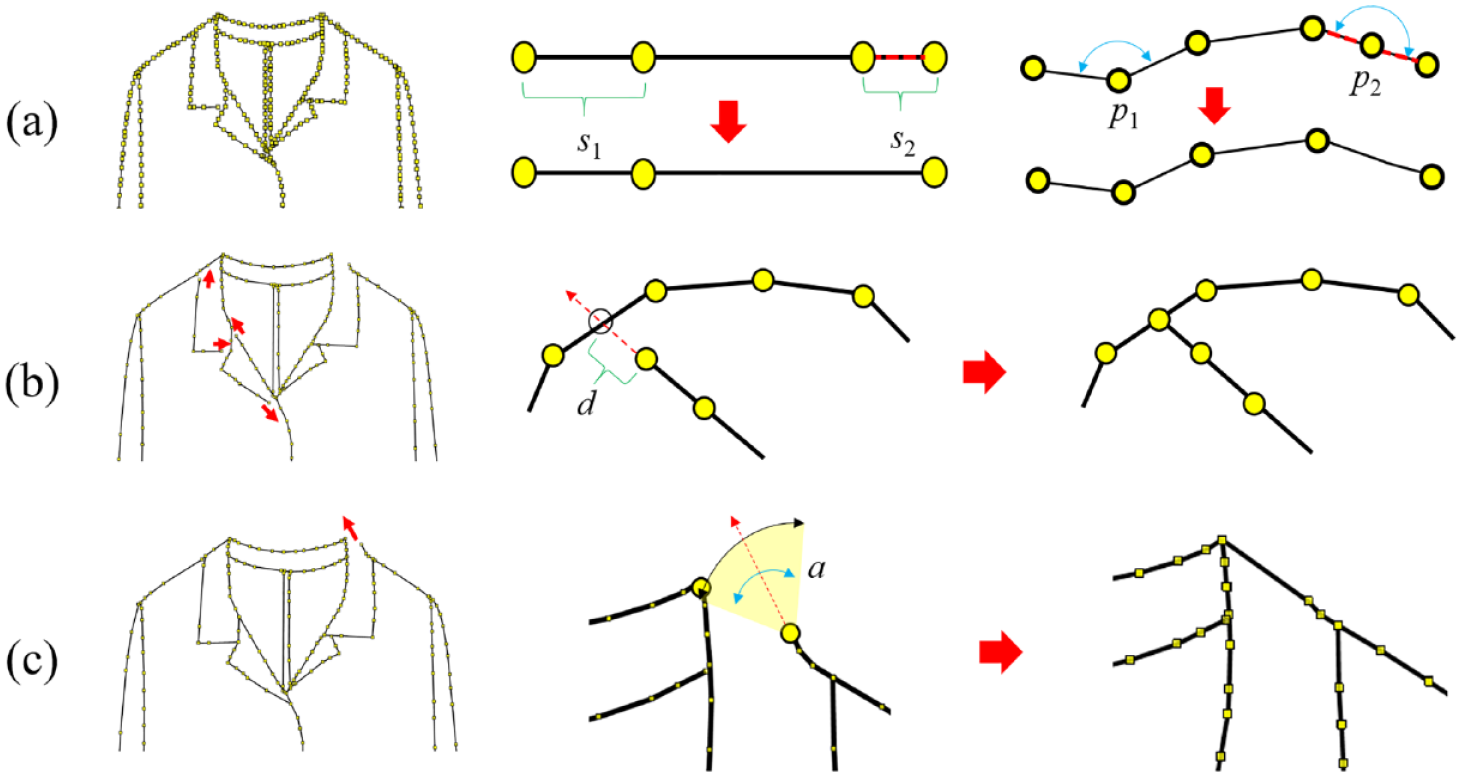
Schematic diagram of vector image refinement: (a) elimination of points, (b) connection of broken line by extension, and (c) connection of broken line by point search.
Figure 4(a) shows the rules for reducing the number of points. When the distance between any two points are smaller than the predefined minimum length, they are merged into one. As can be seen in Figure 4(a), two points on segment s2 are merged. However, a point that forms an angle smaller than the predefined minimum angle will not be deleted to maintain the shape of the line. Therefore, point p1 has not been deleted as shown in Figure 4(a). Figure 4(b) shows the rule for broken lines. When an open end of a line does not have any close neighboring point, the line is extended to find an intersecting point with other lines that are closer than the predefined proximity d. Figure 4(c) shows the rule for the lines that has not been connected to any other line in the previous steps. In this rule, a close point is searched by extending the line within the predefined angle range of a.
Formation of closed shapes using graph algorithm
The vectorized image needs to be subdivided into closed shapes for flat sketch element generation. In this study, a graph search algorithm has been developed to solve this problem as shown in Figure 5.

Schematic diagram of graph search algorithm: (a) principles of the graph search algorithm and (b) closed shapes found by the algorithm.
First, the points with the same coordinates are merged into one so that the entire image forms a fully connected graph as shown in Figure 5(a). Next, a random point with three or more neighbors is selected (α in this example). Then the next point is selected among its neighboring points (O1 in this example). If there is only one neighboring point other than the previous point, the search continues in that direction. In this method, the rule for selecting the next point of the point with three or more neighboring points (β in this example) are important because the rotating direction of closed line needs to be counterclockwise. Assuming that direction vector from the previous starting point toward β is v and the unit vectors of point 1 and 2 from β are p1 and p2 respectively, the signed areas of the two triangles formed by those three points can be calculated using equation (1):

where, xn and yn are the coordinate of three points forming a triangle
Among the neighboring points of β, the one with the largest area value is chosen for the next point in order to keep the counterclockwise rotating direction. A closed shape can be defined when the next point reaches the starting point. By applying this algorithm to all the points with more than 3 neighboring points, all closed shapes can be found as shown in Figure 5(b). However, if the search direction of the first point were incorrect (O2 in this example), the rotating direction of the shape would be clockwise. The rotating direction of a shape can be determined using equation (2):

where, xn and yn are the coordinates of the points on a shape
i + 1 = 0 when i = n because it is a closed shape
When the rotating direction of a shape is clockwise, S becomes negative and it can be ignored.
Results and discussion
Training result of edge detection model
Qualitative results
The edge maps generated by the DexiNed model was qualitatively compared with existing DexiNed model without training to evaluate the effect of FFIED dataset.
Figure 6(a) shows the edge extraction results of solid color garments. From left to right, the first column shows the input clothing images. The second column shows the manually drawn ground truth edge images. The third column shows the edge maps generated by untrained DexiNed model. The last column shows the edge maps generated by the DexiNed model trained with FFIED dataset. The untrained DexiNed model missed some seam lines and maintained unnecessary wrinkles. The DexiNed model trained with FFIED dataset produced the results closest to the ground truth. It successfully extracted the outline of a garment as a single continuous line and ignored the undesirable wrinkles.

Results of qualitative evaluation of edge detection model: (a) edge detection result of solid color garments and (b) edge detection result of garments with patterned fabric.
Figure 6(b) shows the edge extraction results of various algorithms for garment with patterns. The model after the training with FFIED dataset showed much improved performance on garments made of fabrics with patterns or complex woven structures. The pattern or woven structure of fabric should not be included in a flat sketch while important lines such as sewing lines should be included. In addition, details such as buttons and collars should also be recognized. In the case of skirts and dresses, it is important to accurately capture the various cutting lines because they are essential design features in such type of clothing. The trained model successfully extracted seam lines and various cutting lines. Through this test, the validity of the dataset developed in this study was verified. In addition, the importance of developing a fashion-specific dataset has been proved by the improved performance of a conventional CNN model.
Quantitative results
One of the ways to quantitatively evaluate an edge detection algorithm is a confusion matrix that compares the edge detected by the algorithm with the ground truth containing the targeted edge. 13 The true positive (TP) is when it is defined as an edge in both the algorithm and the ground truth. The true negative (TN) is defined as a non-edge pixel in both the algorithm and ground truth. The false negative (FN) is when the ground truth defined it as an edge but the algorithm identified it as a non-edge pixel. It is defined as a non-edge pixel in ground truth, but when the algorithm judges it as an edge, it means the false positive (FP). In previous studies, precision, recall, F1-score, and p-value were calculated to evaluate various edge detection algorithms using those confusion matrix.16 –19 Precision is the ratio of true edge to pixels predicted as edge, which can be calculated using equation (3):

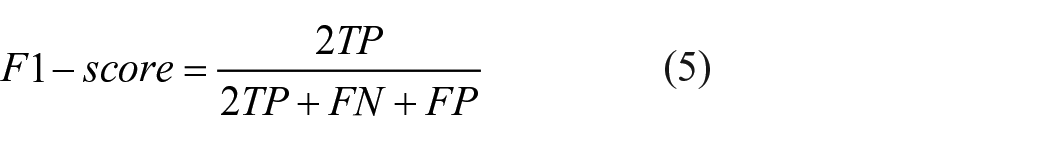
Recall is the ratio of correctly edge pixels to all the true edge pixels in the data, which can be calculated using equation (4):
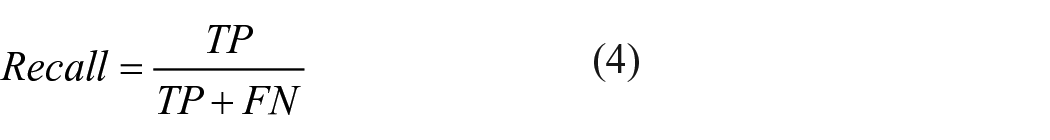
The model with good performance has the high values of both precision and recall. The F1-score is the harmonic mean of precision and recall that combines them into single statistics as shown in equation (5):
The p-value approaches zero closely with an increasing number of falsely detected or missed edge pixels, as defined by equation (6):

Table 1 presents a comparison of 10 representative results from confusion matrices before and after FFIED training. Those cells in bold are the higher measured values. Overall, the model trained with FFIED showed higher values, confirming that it can detect edges more accurately. In particular, the measurement before FFIED training showed very poor results in the case of clothes with patterned fabric. This is because the original model misrecognized fabric clothing patterns that should be ignored and missed the important lines that should be included in flat sketches. On the other hand, the evaluation results from No. 6 to 9 showed a significant improvement after training, which showed that the algorithm was able to distinguish seam lines from fabric patterns through training. Meanwhile, for Recall, most of the measured values were higher before training, which showed that the number of true positives increased because the model before training detected edges positively more often, apart from the performance of the model. However, for precision, all results were improved after training, even in the images with high recall before training. The effect of FFIED training was verified by these evaluation results. However, although the values increased slightly after training in image No.10, it seemed to be insignificant. This is one of the limitations of the model, which means that it cannot detect edges reliably when the fabric patterns are difficult to be distinguished even with the human eye or the patterns are new to the model. To quantitatively compare the performance of the model proposed in this study with commercial programs and existing edge detection models, an experiment was conducted to evaluate the outputs of this study, the DexiNed model, Photoshop, and HED models. Within Photoshop, “Smart Blur” effect with “Edge only” mods in “Filters” menu was utilized for extraction of edge maps. To apply the HED algorithm, clothing images were fed into the model pre-trained with BSDS500 datasets. Figure 7 displays confusion matrices that illustrate the experimental outcomes of four algorithms across 50 test images. The output from the HED model, which often loses edges within the contour, and the output from Photoshop, which tend to identify excessive noise as edges, generally had poor values. In comparison, both the DexiNed model and the model trained with FFIED exhibited notably superior performance by detecting significant internal edges without introducing noise. While some images still showed poor values, but this was attributed to intricate print patterns that the model had never encountered. Overall, the approach of this study, trained on the FFIED dataset, demonstrates quantitatively better robustness than the untrained DexiNed model, reaffirming the effectiveness of training with the fashion-specific dataset.
Quantitative evaluation result of the performance of edge detection models.


Quantitative evaluation result of the performance of edge detection models: (a) precision, (b) recall, (c) f1-score, and (d) p-value.
Result of Vectorization
The extracted edge image was put into a vectorization network to be converted into a vector image. Then it was corrected using the algorithm devised in this study. To evaluate the performance of this step, vector images of jackets, blouses, skirts, and pants were randomly selected for each type of clothing. After correcting the selected vector images, the number of points, segments, objects and the longest segment length were counted for comparison. The results are shown in Figure 8.

Result of vector image correction: (a) jacket, (b) blouse, (c) skirt, and (d) pants.
For all types of clothing, the number of points, objects, and segments was reduced and the longest segment length was increased. This showed that undesirable short segments were effectively deleted. In addition, the number of points and segments has been reduced to appropriate values for easy modification. Some examples of corrected vector images are as shown in Figure 9. For each pair of images, the left one is the result of initial vectorization that contains too many points and short segments. The right one is the result of image correction process. As can be seen in the images, short segments and unnecessary points were removed.

Examples of corrected vector images.
Generation of flat sketch elements
Figure 10 shows the overall process of flat sketch element generation.

Overview of design creation and modification process using the combination of flat sketch elements.
As shown in Figure 10, four images of clothes were converted into vector images. Then each image was divided into multiple closed shapes by using the graph search algorithm. Then the flat sketch elements such as collar, bodice, sleeve, and so on can be defined and added to the database by grouping appropriate shapes together. Finally, users can create a new flat sketch by simply combining the elements from the database. As this flat sketch is in vector format, users can easily edit it into the desired shape.
Table 2 shows the results of comparing the functions of the proposed method with related works. Each functions are explained as follows: “Flat sketch database” refers to the availability of a database containing flat sketches. “Image to flat sketch” represents a function that capable of converting a clothing image into a flat sketch. “Vector graphic format” indicates the provision of the method’s flat sketch as vector graphics, allowing modifications in size or shape “Editability of a flat sketch” signifies the capability to edit and transform the points within a flat sketch. “Combination of flat sketch element” refers to the potential to create a new design by dividing the given flat sketch into elements and combining them. As a result of comparing these functions, it was revealed that only the method proposed in this study encompasses all of them. Specifically, the ability to convert clothing images into flat sketches and freely adjust them was confirmed as a function exclusive to this study.
Comparison of the proposed method and the related works.

Conclusion
In this study, an automated process has been developed that converts clothing images into vector images and generate flat sketch elements using artificial intelligence and graph algorithm. The outline of clothing was extracted as an edge map by using a CNN-based edges detection model trained by specially data set of FFIED developed in this study. Then, an RNN-based vectorization model was used to convert the raster edge map image into a vector drawing. Finally, by using a graph algorithm developed in this study, the vector drawing was subdivided into multiple closed shapes. Flat sketch elements can be made and added to the database by grouping appropriate shapes. The performance of each processing step was evaluated both qualitatively and quantitatively, which showed desirable results. By utilizing the method developed in this study, it would be possible to quickly and easily extract flat sketch elements from various clothing images to make a database. And it is expected that the design and management of flat sketches will become easier by the use of that database.
Footnotes
Acknowledgements
I would like to express my sincere gratitude to INDONG FN SHESMISS IDF MALL for generously granting permission to use product images in my research.
Correction (April 2024):
Article updated to add Acknowledgements section.
Declaration of conflicting interests
The author(s) declared no potential conflicts of interest with respect to the research, authorship, and/or publication of this article.
Funding
The author(s) disclosed receipt of the following financial support for the research, authorship, and/or publication of this article: This research was supported by SNU-Hojeon Garment Smart Factory Research Consortium Project (No. 0423-20190066)