
Abstract
There are invalid and redundant features in the texture feature extraction method of cashmere and wool fibers, which leads to the low recognition accuracy. In this paper, a novel texture feature selection method based on local binary pattern, the gray level co-occurrence matrix algorithm and chi-square test was proposed to sufficiently extract the effective features of these two fibers. Firstly, the collected images of cashmere and wool fibers are processed to obtain the clear texture images with background removed by pre-processing algorithm and local binary pattern. Then, the texture features are calculated by the gray level co-occurrence matrix, and the optimal 5-dimensional features are extracted by chi-square test to represent the texture information of cashmere and wool. Finally, the two fibers are automatically classified and recognized based on the support vector machine. The experimental results show that the proposed method obtained a high recognition accuracy with the percent of 94.39. It verifies that the method based on texture feature selection is effective to identify cashmere and wool fibers.
Keywords
Introduction
Cashmere fiber, slender and uniform, smooth and elastic, has always been a valuable raw material in the textile industry.1,2 Due to the rising demand for cashmere in the market, the limited annual output of cashmere led to the increase of the cashmere and wool blended products. Besides, some traders have exploited the similarity between cashmere and wool fiber to falsely mark the cashmere content of textiles, undermining the market order.3,4 The traditional method of identifying wool and cashmere is mainly artificial observation by optical microscope, which is simple and easy to operate. Whereas, it still remains several disadvantages such as less reliable identification parameters, the high requirements of experienced experts. 5 Therefore, the identification of cashmere wool has become a troublesome problem in the textile field.
Recently, with the rapid development of computer technology, a large number of researchers have applied computer digital image processing technology to the detection of cashmere and wool. This method collects the sample images through optical microscope or scanning electron microscope, then extract the features of the sample for machine learning algorithm through image processing technology, and finally select the appropriate classifier for recognition. In the method of cashmere and wool recognition based on different geometric features of fibers,6 –9 Shang et al. 6 studied the four kinds of cashmere and wool, six characteristics of fiber including diameter, the diameter of high ratio, scale height, scale projection width, scale thickness at right angles and scales diameter difference, and then got the distribution of these six characteristics, identified it by using Bayesian model finally. Huang et al. 7 extracted diameter, surface scale height and scale thickness by image processing algorithms to analyze and detect the fibers. Zhu et al. 8 extracted the diameter of cashmere and wool based on a level set of central axis method for identification. Xing et al. 9 extracted three morphological features including scale height, fiber diameter and their ratio by the self-defined vertical line rotation analysis method, and established a Bayesian classification model for identifying wool and cashmere fibers.
Sometimes, it is difficult to measure the geometric characteristics of fibers, the scholars extract the texture information or combine with several geometric features of the fiber image to identify the two fibers.10 –14 Yuan et al. 10 used the improved Tamura texture feature to analyze the final image, obtained the texture parameters of the fiber, the neural network was constructed as a classifier to identify the animal fibers. Lu et al. 11 used bag-of-words and spatial pyramid matching to regard each fiber image as a collection of feature vector. The extracted vectors were fed into support vector machine for supervised classification. Xing et al. 12 extracted four texture features and the diameter of fibers. The k-means algorithm was applied to analyze these five features. Meanwhile, Xing et al. 13 analyzed the four sub-images of wavelet decomposition through Gaussian Markov random field model to generate 8-dimensional texture features, and reported the classification results by support vector machine. Sun et al. 14 extracted the LBP features of fibers and realized the classification of cashmere and wool with sparse coding and dictionary.
Deep learning technology has received great attention for its good adaptability in different classification tasks today.15 –19 Wang and Jin 15 proposed a low-dimensional strategy of using part-level features to enhance object-level features based on CNN to classify wool and cashmere images. Gao et al. 16 proposed a vision-based measurement (VBM) framework of fiber recognition based on image segmentation and deep convolutional neural networks, and evaluated the performance differences between the four network architectures. Yildiz 17 analyzed two identification methods of mohair and wool, which were the algorithm based on CNN model and the nearest neighbor with an input is LBP texture features. Luo et al. 18 proposed a residual net-based method for the identification of cashmere and sheep wool fibers. The comparison showed that the proposed residual net model with 18 weight layers had the highest accuracy. Zang et al. 19 proposed a fiber recognition algorithm based on multiscale geometric analysis, and utilized the Alexnet neural network to carry out the training for feature vectors. However, the deep learning system relies on a large number of sample data to train the network model, which cannot achieve good performance in the small number of sample images.
From the perspective of most related researches based on fiber feature, the features for identification are simply extracted, and the importance of features to sample is less discussed, leading to the unclear classification and the low accuracy. Therefore, the novel recognition method based on texture feature selection by gray level co-occurrence matrix and chi-square-test is presented in this paper. By calculating the correlation between features and categories to select the representative features of fibers, which can improve the recognition rate and robustness.
Research methods
In this study, the proposed method consists of four steps, as shown in Figure 1. In the first step, the collected fiber images are preprocessed to remove the background. In the second step, the texture features are extracted by local binary pattern (LBP) and gray level co-occurrence matrix (GLCM). The third step is to use the chi-square-test to calculate the correlation between features and categories for selecting effective features. In the fourth step, the support vector machine (SVM) with the RBF kernel is used to classify the fiber images.

Flow chart of the research method of this paper.
Image preprocessing
There are some interference factors of impurities, noise and so on, which affects the accuracy of the subsequent extracted features in the collected images, the preprocessing of the captured image is needed to remove the background and noise. First, the captured fiber images may have shortcomings such as fuzzy or low contrast, the contrast stretching algorithm 20 is used to obtain clear scale texture. Next, the canny edge detection 21 is employed to get the edge for obtaining the skeleton outline of the fiber. Then, the morphological filling is applied and after that we remove the noise area. In the last step of the preprocessing, the filled-fiber image is used as a template to remove the background, and we can obtain the final sample image for feature extraction.
Optimal parameter selection in feature extraction
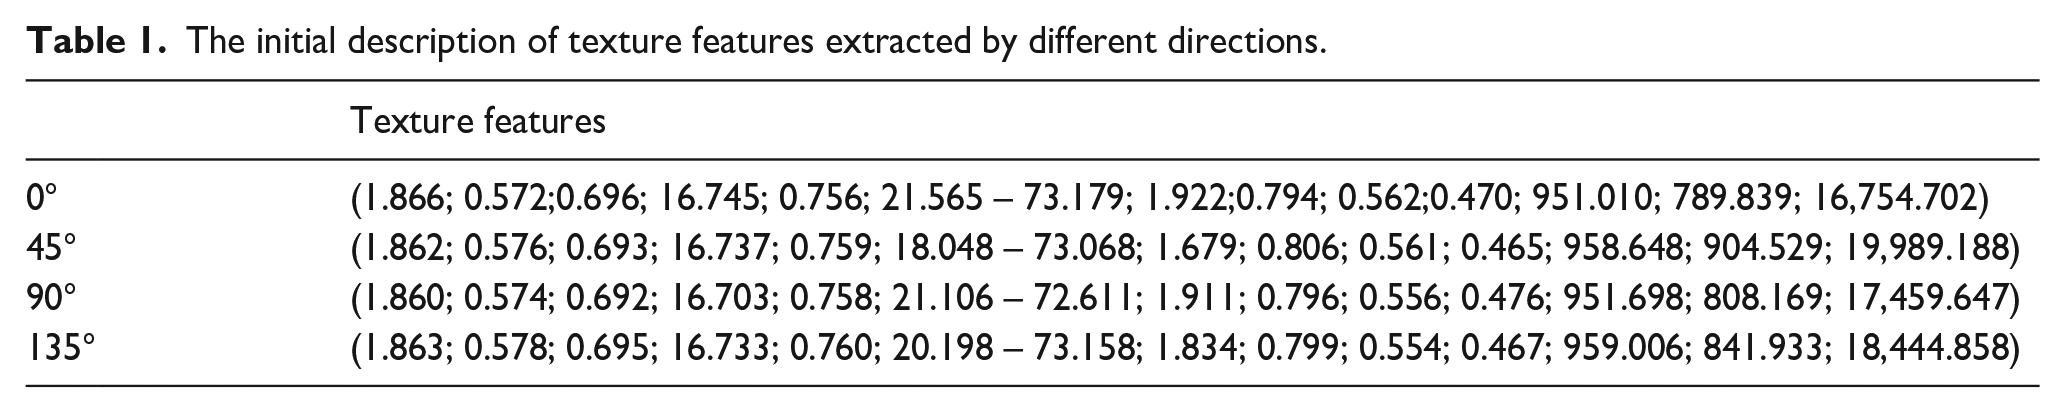
The methods of texture feature description mainly consist of statistical method, geometric method, model method, signal processing method and structural method.22 –24 The method in this paper adopts the statistical-based methods, and employs the LBP operator and GLCM to extract the texture features of fibers. In order to fully represent the texture information of image, we construct the new image by the LBP operator with optimal parameters and extract its texture features by calculating the statistics of GLCM in four different directions in which a total of 56 features are used as the initial description of the original sample image, the features of cashmere are shown in Table 1. The GLCM features are as follows25,26: mean, angular second moment, entropy, variance, energy, contrast, correlation, dissimilarity, homogeneity, sum entropy, difference entropy, inertia, cluster shade and cluster prominence, and these features are calculated with the angle of 0°, 45°, 90°, and 135° respectively.
The initial description of texture features extracted by different directions.
The LBP algorithm was proposed to extract features by Ojala et al.
27
as early as 1996. It compares the value of sampled neighborhood pixels with those of sampled pixels, the image pixels are re-encoded to obtain a new image. In order to adapt the different scales and achieve the requirements of grayscale and rotation invariant, the circular LBP operator is used to reconstruct the image in this paper. The implementation process of circular LBP is shown in Figure 2. The optimal LBP parameter is the most important factor to improve the recognition ability of the fiber texture features, we encode the image with different number of sample points P on the circle of different radius R, and take the P = 6, 8, 10, 12, and 14, the R = 1, 2, and 3 respectively. The GLCM is used to analyze the texture features of images recoded by different LBP parameter combinations, it represents the number of times that the pixel pairs

Where L*L is the size of the image. In this paper, because the best texture representation is obtained when the circle of radius is 1 in the experiment, the distance is set to 1 at different angles to extract features.
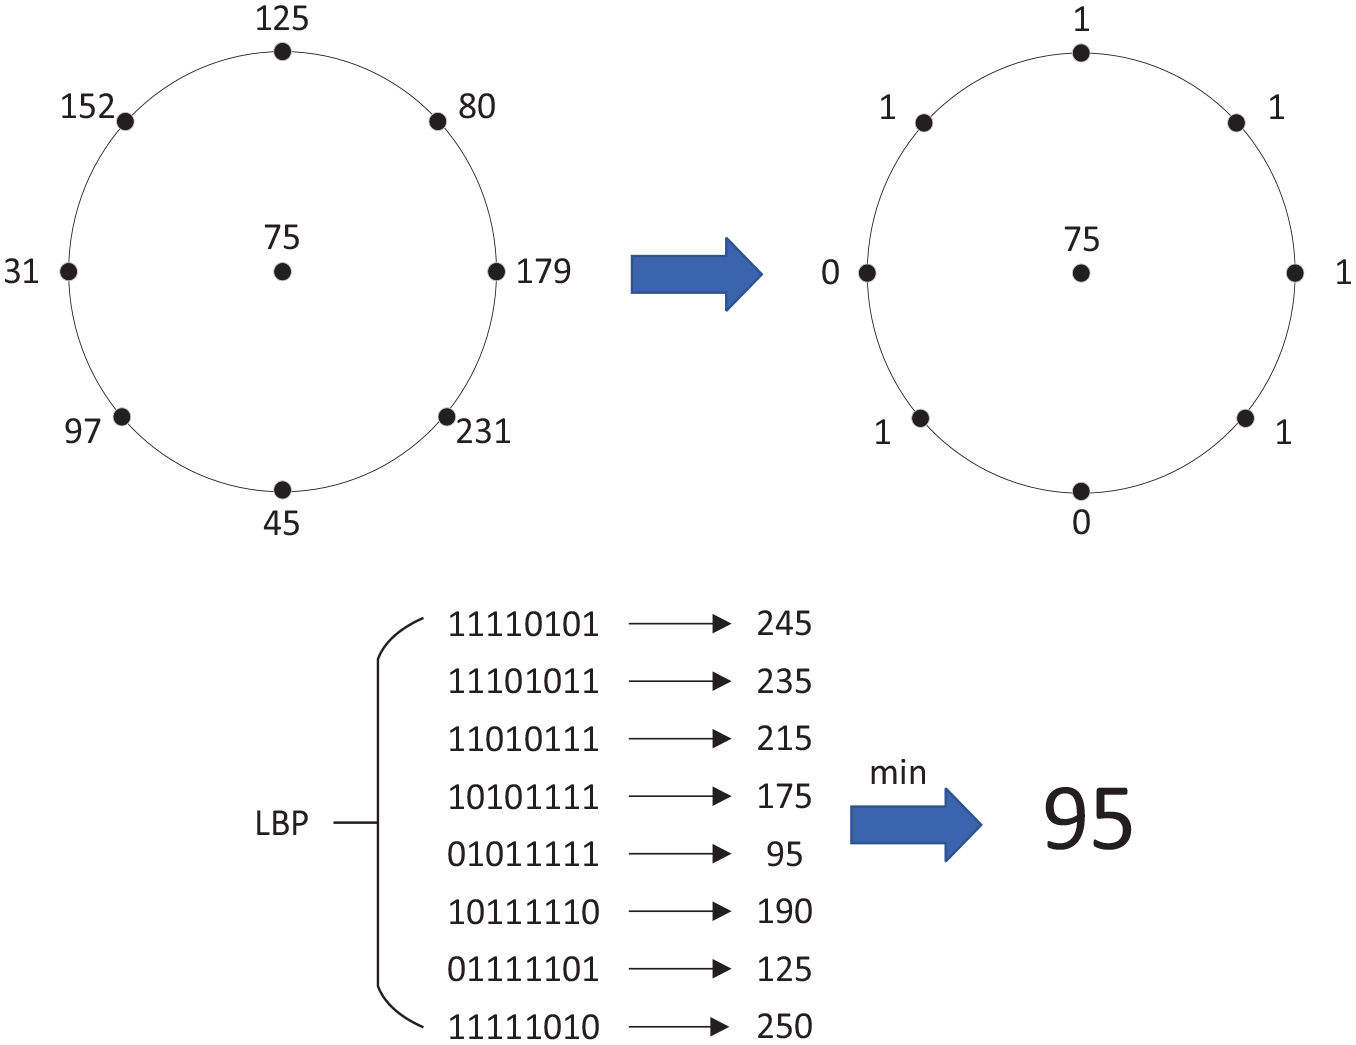
Schematic diagram of circular LBP operator.
The optimal method of feature extraction is determined by obtaining the highest recognition accuracy. In this paper, different values of the two LBP parameters are selected in turn. First, the number of sample points P is determined, 50 samples of cashmere and wool are randomly selected. Assuming radius R = 1 and setting the sample points respectively as 6, 8, 10, 12, and 14. The maximum chi-square statistical value determines the optimal number of sample points by calculating and comparing the chi-square values of each feature of GLCM. Then select the radius R, the number of sample points P is set to 12 according to the optimal number of sample points obtained in the previous step, select different sample radius R = 1, 2, 3, the gray level co-occurrence matrix eigenvalue of LBP image is calculated separately. The chi-square value is used to represent the correlation to determine the sampling radius. Therefore, R = 1 and P = 12 are set as the appropriate parameters of circular LBP to obtain the optimal image required in the experiment.
Feature selection based on chi-square-test
Feature selection methods mainly include: filtering, wrapping, and embedded methods. Among many feature selection algorithms, the chi-square test method is simple in calculation and implementation, it has a low model complexity. The chi-square-test can be employed to measure the correlation and dependence between two types of variables.29,30 The evaluation metrics can be directly calculated from the extracted features without feedback from the predictor, the optimal feature subset can be selected to reduce the number of features. In order to make full use of the extracted features to effectively represent the image information, we extract the multi-dimensional features of the image transformed by LBP, the chi-square-test method are used to discriminate the features that can be used to effectively identify fibers, in which the chi-square value is regarded as a correlation measure. The chi-squared-test statistic can be expressed by the following formula:

Where


In the formula above,
The implementation process of the entire feature selection method is as follows: first, the mean value of each feature in the training set is obtained, and this feature of each sample is compared with its mean value. After that, according to the comparison the sample features with different categories and their mean, the sample frequency contingency table is obtained, and the chi-square statistics of this feature are calculated according to the formula. In the end, the above operation is repeated for each feature to obtain and sort the chi-square values, and the feature obtained the optimal recognition effect is selected according to the comparison.
Classification
SVM is a supervised learning method to classify data, it has been widely applicated in the fields of face recognition, text classification, medical diagnosis and so on, 31 which is more suitable for the situation of small data sets. It creates a hyperplane as the decision boundary between the two classes for the implementation of classification. The kernel function is used to map the data from low dimension space to the high dimension space and made the non-separable data separability through nonlinear mapping. By training the known sample data, we can predict the unknown samples. The decision function used by SVM is:

where N is the sample number,

The Naive Bayes classification algorithm is based on Bayesian decision theory and the attribute conditional independence assumption. 32 The joint probability distribution is learned from input to output with the assumption that each feature is independent. The output is obtained with the condition of the maximum posterior probability for the unknown input data category.
The KNN classification algorithm uses all samples of known categories as reference to determine the category of unknown samples, it calculates the distance between the unknown samples and all known samples and selects the k known samples with the closest distance to the unknown samples. 33 According to the majority-voting rule, the unknown sample is grouped into the same category with the larger proportion of the K nearest samples.
Experimental results and analysis
The images of the experimental samples were obtained by the scanning electron microscope that magnified the original samples to 1000 times. Because the texture features of fiber scales are irrelevant with the size of the collected images, we crop and save the images to 275 × 275 pixels in the computer to facilitate subsequent preprocessing, as shown in Figure 3. A data set containing 1000 images of the fibers is prepared in which cashmere and wool were taken 500 respectively. The image preprocessing of cashmere and wool fibers is shown in Figures 4 and 5.

(a) Wool and (b) cashmere.
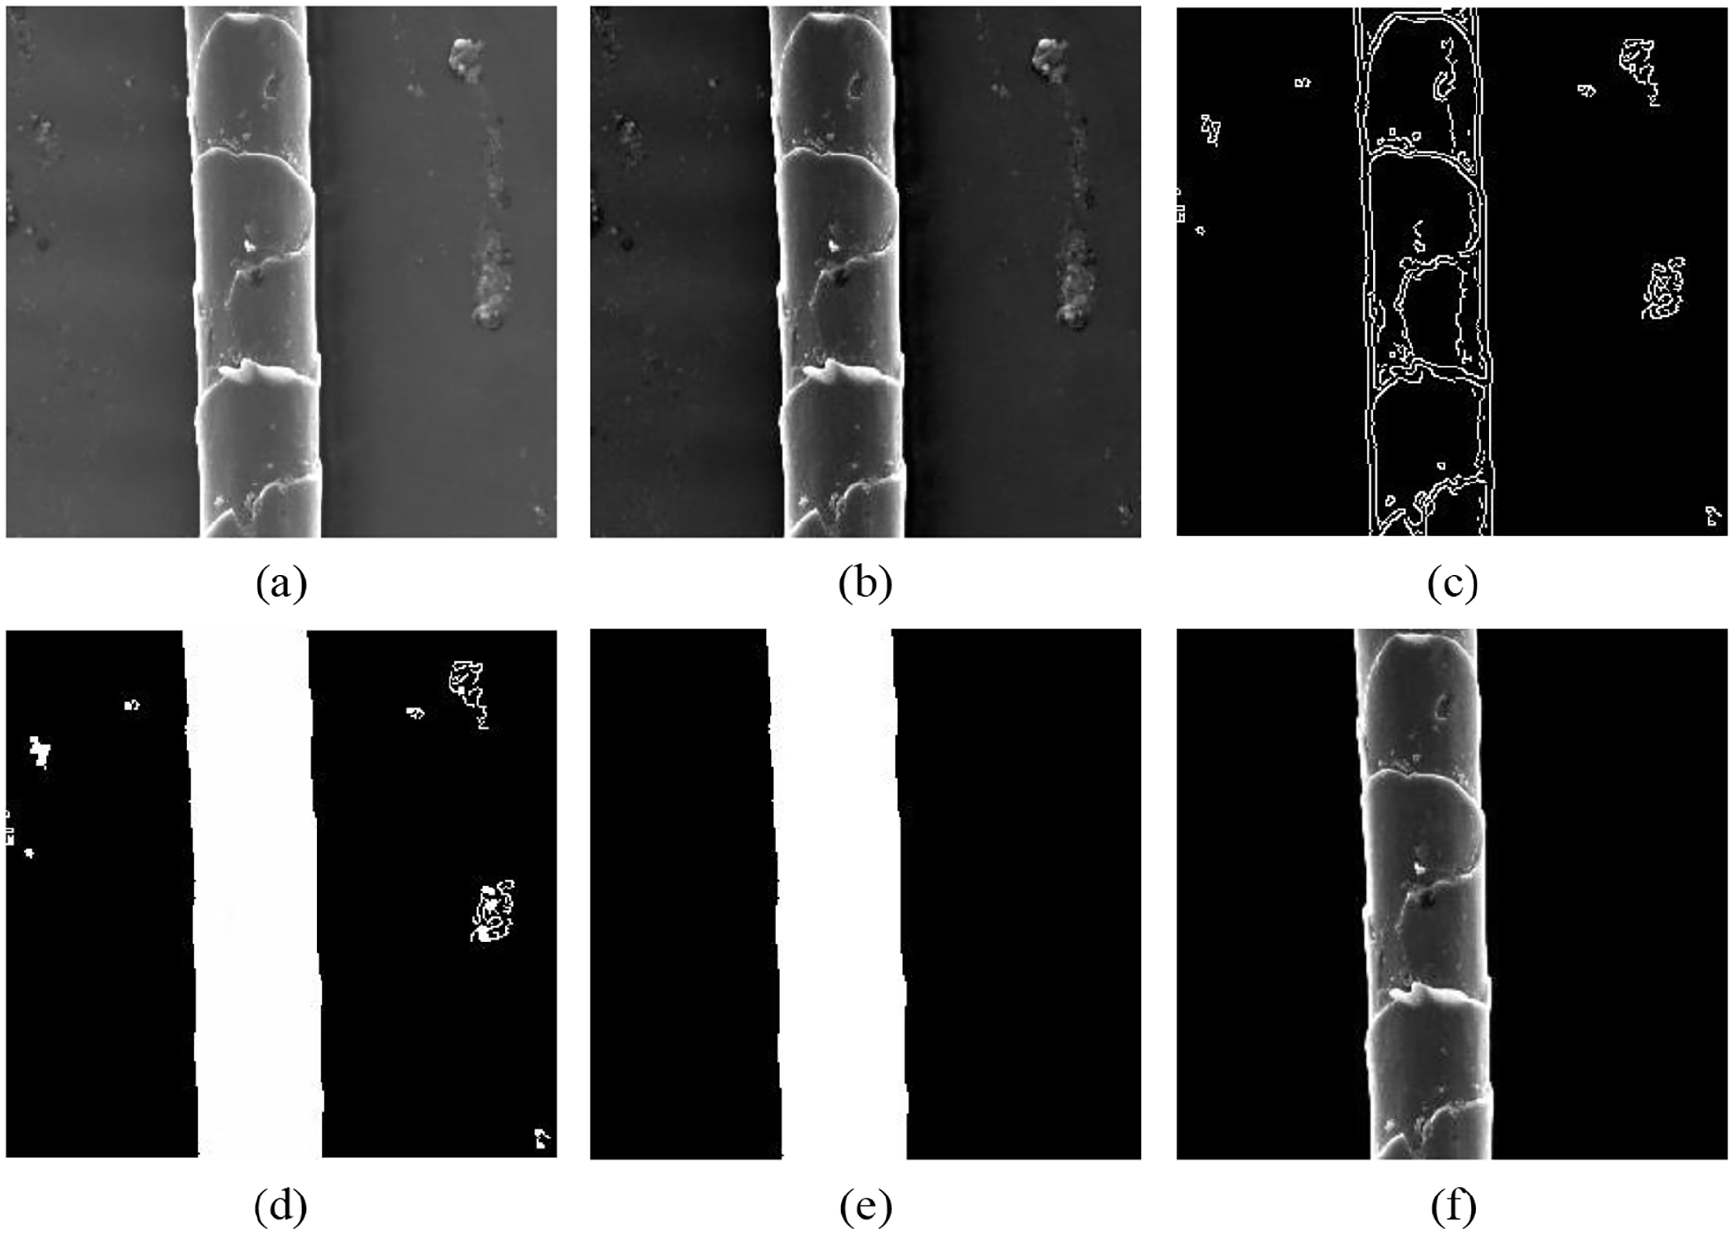
Cashmere image preprocessing: (a) original image, (b) image enhancement, (c) edge detection, (d) filling margin, (e) noise elimination, and (f) removal of background.

Wool image preprocessing: (a) original image, (b) image enhancement, (c) edge detection, (d) filling margin, (e) noise elimination, and (f) removal of background.
Considering the clarity of texture and local feature information, the selection of the number of sampling points P and the sampling radius R is studied in this paper. We compare the recognition accuracy of the proposed method when taking different P and R. In this experiment, there are 15 different combinations of P and R, P is set to 6, 8, 10, 12, and 14, R is set to 1, 2, and 3. Figure 6 shows the LBP images using different parameters (taking cashmere images as an example). The graphs b, c, d, e, and f show the texture of the images with unchanged R and changed P, the graphs e, g, h show the unchanged P and the increased R.

Cashmere image processed by different LBP operators: (a) removed background image, (b) R = 1, P = 6, (c) R = 1, P = 8, (d) R = 1, P = 10, (e) R = 1, P = 12, (f) R = 1, P = 14, (g) R = 2, P = 12, and (h) R = 3, P = 12.
The classification results of cashmere and wool images with different LBP parameters are shown in Table 2. The selection of P and R in LBP image is very important to the recognition accuracy. When P is taken very small, the identification accuracy is low, which indicates that when a small number of pixels around the original pixel are used to characterize it, the texture information cannot be fully represented. With the number of sampling points P increases, the accuracy improves. When P is set to 12, the highest recognition accuracy is achieved. When P increases continuously, the accuracy decreases gradually. The possible reason is that too many sampling points lead to the instability of representation texture and the increase of interference information. When R is set to a small value, a high recognition rate can be achieved. With the increase of R, the recognition accuracy decreases, which indicates that when sampling on a larger radius may causes the weak information correlation between texture pixels and inaccurate characterization. Therefore, taking the consideration of the feature dimension and recognition accuracy, in the subsequent experiments, the parameter P of LBP is set to 12 and R is set to 1.
Identification accuracy of different R and P.

In order to obtain the representative characteristics of cashmere and wool fibers, the correlation between different characteristics and categories is studied, as shown in Figure 7. The data set of this experiment contains 500 cashmere and 500 wool fiber images. We set the ratio of training set, verification set and test set to 6:2:2, the training set contains 600 sample images, the verification set contains 200, and the test set contains 200. The implementation of data split is shown in Figure 8. Figure 9 shows the recognition accuracy of different dimensional GLCM features sorted through the chi square value in the background removed and the LBP encoded image. The results show that with the increase of feature dimension, the recognition accuracy increases gradually, when the feature dimension is greater than five, the accuracy tends to be constant or decrease, because redundant and invalid features affect the results of classification. Based on the above discussion, this paper selects effective 5-Dimensional features to characterize the fiber.

The chi-square statistics between features and categories.

The split of data set.
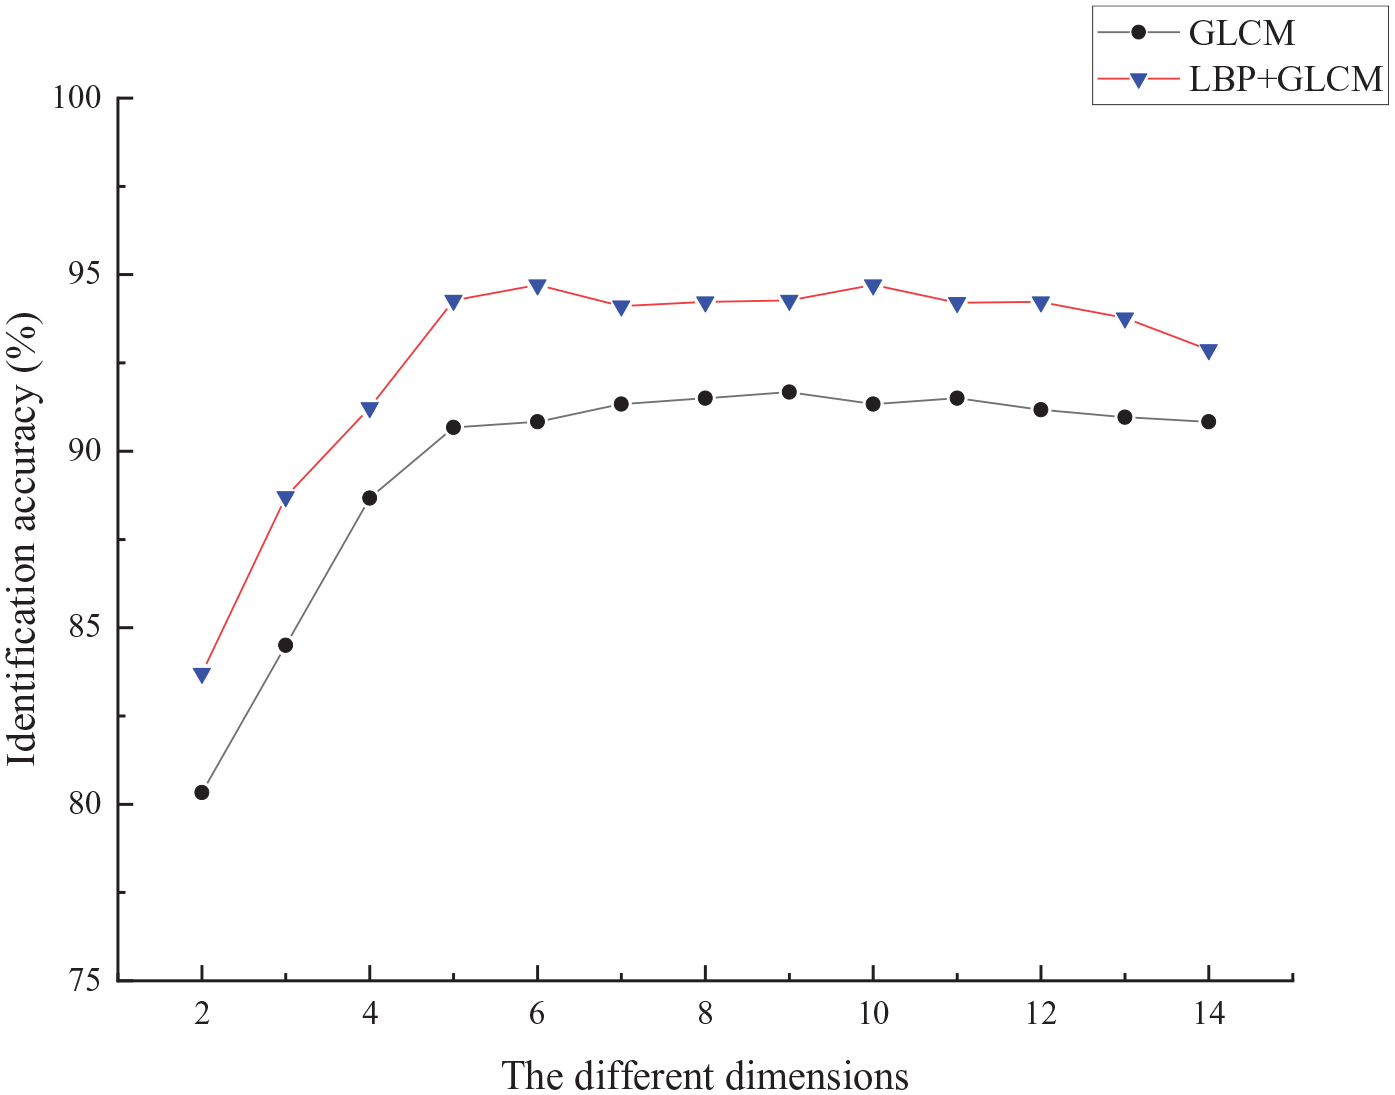
Recognition rate of different dimensions.
In this paper, SVM with RBF kernel function is used for classification. The classifier is trained through the training set, and the Grid Search method is used to adjust the parameters c and g, which are set from 0.01 to 100 respectively. c is the penalty parameter, which represents the tolerance for errors. The higher the value of c is, the more error is unacceptable and the model is prone to overfitting. On the contrary, the smaller the value of c is, the more error is tolerated, which may lead to the inability to distinguish data and underfitting. The parameter of g is the inverse of the standard deviation of the RBF kernel and adjusts the curvature of the decision boundary. The appropriate value of the model parameters is determined by obtaining the best accuracy in the verification, then new classifier model is trained by using the best c and g. Finally, the test set is sent to the rebuild model to evaluated the performance. In this paper, through experiment and analysis with the split dataset, the best c is 10.32 and the best g is 36.18.
We compare the recognition effect of this method with several other classical classifiers, the evaluate performance of accuracy, precision, recall, and F1-score is compared, 34 as shown in Table 3, it can be seen that the features extracted in this paper have the highest recognition rate in the SVM classifier, which is 94.39%, the classification performance of Naive Bayes is the lowest, probably because this algorithm is based on the premise that the various features of the input are independent of each other, and it is often difficult to achieve this requirement in practical applications. The KNN algorithm has a high cost of nearby neighbors for iterating to find samples, and it is suitable for the classification of data with small samples and low dimensions. Therefore, in this paper, the idea of using SVM classification is simple and easy, which can solve the classification problem of cashmere and wool.
The performance of different classifiers.

In Table 4, the different fiber mixing ratios are used to evaluate the method in this paper. The recognition accuracy is achieved the highest when the number of cashmere and wool samples is the largest and the ratio is 1:1. The reason is that the more samples can describe the feature of different fiber sufficiently, the method proposed in this paper maintains the accuracy about 94% and shows the stable performance in different cashmere and wool mixing ratios.
Identification accuracy of different number of samples.

Compared with other existing literatures on animal fiber recognition in the introduction, the fiber recognition accuracy of this method is significantly improved, as shown in Figure 10. The comparison of the recognition rate is the best reported results with their own sets of data. This method considers the optimal texture image and the selection of effective features of the fiber, it can fully extract the texture features of the fiber as much as possible, the texture information can be characterized more accurately. Therefore, the method based on feature selection is a reliable and effective method to identify cashmere and wool fibers.

Compared with different methods.
Conclusion
In this paper, a novel recognition method based on the feature selection is proposed to identify the fibers of cashmere and wool. This method processed the removal background images by local binary pattern to get the clear texture of fibers, then texture features are extracted and analyzed by gray level co-occurrence matrix and chi-square-test algorithm, and SVM is used to train and classify these features. In the experiment, the importance of features to sample is analyzed for obtaining the effective features to describe the difference between fibers, and we evaluate the proposed method in different fiber blending ratios. The results show that the identification rate of the selected features is higher compared with the existed methods using self data sets. The proposed method is stable and effective to identify cashmere and wool fibers. In the future, more diverse samples will be collected for testing and evaluation to extract the features between similar animal fibers in different methods like model-based and signal processing. Deep learning method will be considered and tried to explore better models to improve the research of fiber recognition.
Footnotes
Declaration of conflicting interests
The author(s) declared no potential conflicts of interest with respect to the research, authorship, and/or publication of this article.
Funding
The author(s) disclosed receipt of the following financial support for the research, authorship, and/or publication of this article: This work was support by the natural science basic research key program funded by Shaanxi Provincial Science and Technology Department (No. 2022JZ-35 and No. 2023-JC-ZD-33), the key research program industrial textiles Collaborative Innovation Center Project of Shaanxi Provincial Department of education (No. 20JY026) and Science and Technology plan project of Yulin City (No.CXY-2020-052).