
Abstract
In the process of high strength steel turning, tool wear will reduce the surface quality of the workpiece and increase cutting force and cutting temperature. To obtain the fine surface quality and avoid unnecessary loss, it is necessary to monitor the state of tool wear in the dry turning. In this article, the cutting force, vibration signal and surface texture of the machined surface were collected by tool condition monitoring system and signal processing techniques are being used for extracting the time-domain, frequency-domain and time-frequency features of cutting force and vibration. The gray level processing technique is used to extract the features of the gray co-occurrence matrix of the surface texture and found that these features changed simultaneously when the cutting tool broke. After this, an intelligent prediction model of tool wear was built using the support vector regression (SVR) whose kernel function parameters were optimized by the grid search algorithm (GS), the genetic algorithm (GA) and the particle swarm optimization algorithm respectively. The features extracted from the signals and surface texture are used to train the prediction model in MATLAB. It was found that after the surface texture features were fused using the intelligent prediction model on the basis of the features of cutting force and vibration, prediction accuracy of the proposed method is found as 97.32% and 96.72% respectively under the two prediction models of GA-SVR and GS-SVR. Moreover, the intelligent prediction model can not only predict the tool wear under different cutting conditions, but also the different wear stages in a single wear cycle and the absolute error between the predicted value and the actual value is less than 10 μm, the confidence coefficient of prediction curve is around 0.99.
Introduction
During the cutting process, tool wear will lead to the decrease of machining precision and the increase of surface roughness and the failure of the tool will directly affect the machining efficiency. The tool wear is the result of the comprehensive effect of the heat and force in the cutting process influenced by many factors. It is difficult to realize the accurate prediction with the traditional mathematical model. Therefore, in order to solve these problems fundamentally and realize production automation, it is necessary to monitor the status of the tool. It is very important to improve production efficiency, reduce production cost and ensure product quality. 1
Tool status monitoring has two types of methods: direct and indirect. Direct method directly measures the tool wear value, such as optical method, radioactive method, resistance method and computer vision method based on machine vision technology. The indirect method realizes online real-time monitoring by detecting the cutting physical signals associated with tool wear. With the development of information technology and artificial intelligence technology, tool condition monitoring (TCM) has made great progress in monitoring the tool wear value. When the wear reaches the severe wear stage, it will prompt the staff to change the tool in time to avoid the failure of the parts, machining stagnation and long working period due to tool failure. It has been reported that TCM technology can save up to 40% of production costs and cutting speed can increase 10%∼50% with appropriate TCM techniques.2,3
When building the TCM system, it is essential to carry out the fusion of multiple signals.4,5 At present, sensors such as force sensors, vibration sensors, acoustic emission sensors, temperature sensors and spindle power have been used in tool wear monitoring system. Li and Elbestawi 6 have conducted research in this area. They comprehensively classified different sensors for monitoring different output process parameters, then used multiple principal component fuzzy neural network for classification different tool wear conditions in turning and drilling process by using force, vibration and power signals.
In the tool condition monitoring, after the multi-sensor signal fusion is completed, it is necessary to consider how to detect the wear state of the tool. With the development of artificial intelligence, the artificial intelligence algorithm has laid a foundation for realizing the intelligent prediction of tool wear.7–9 A lot of research has been conducted by many scholars. Nebort and Subiron 4 proposed a generic methodology combining design of experiment (DoE) and artificial neural network (ANN) for improved process modeling and prediction. Roth et al. 10 emphasized wireless, integrated and embedded low cost sensors. Wavelet, time-frequency and time scale analysis are used as signal processing methods and the hidden Markov model and recurrent neural network are used to predict the process of turning, milling, drilling and grinding. In addition, some scholars also studied how to use surface texture signals to reflect cutting conditions.11–15 Dutta and colleagues16,17 have studied the relationship between surface texture characteristics and tool wear. The surface texture feature can characterize the amount of tool wear according to the research results. The results show that if the surface texture feature is used to predict the tool wear, the prediction accuracy can reach more than 92%. However, there are few researches on the relationship between surface texture and tool wear and whether the tool is damaged based on the features of the surface texture. Although there are many researches on machine vision and multi-sensor fusion technology, there are few studies that combine these two aspects.
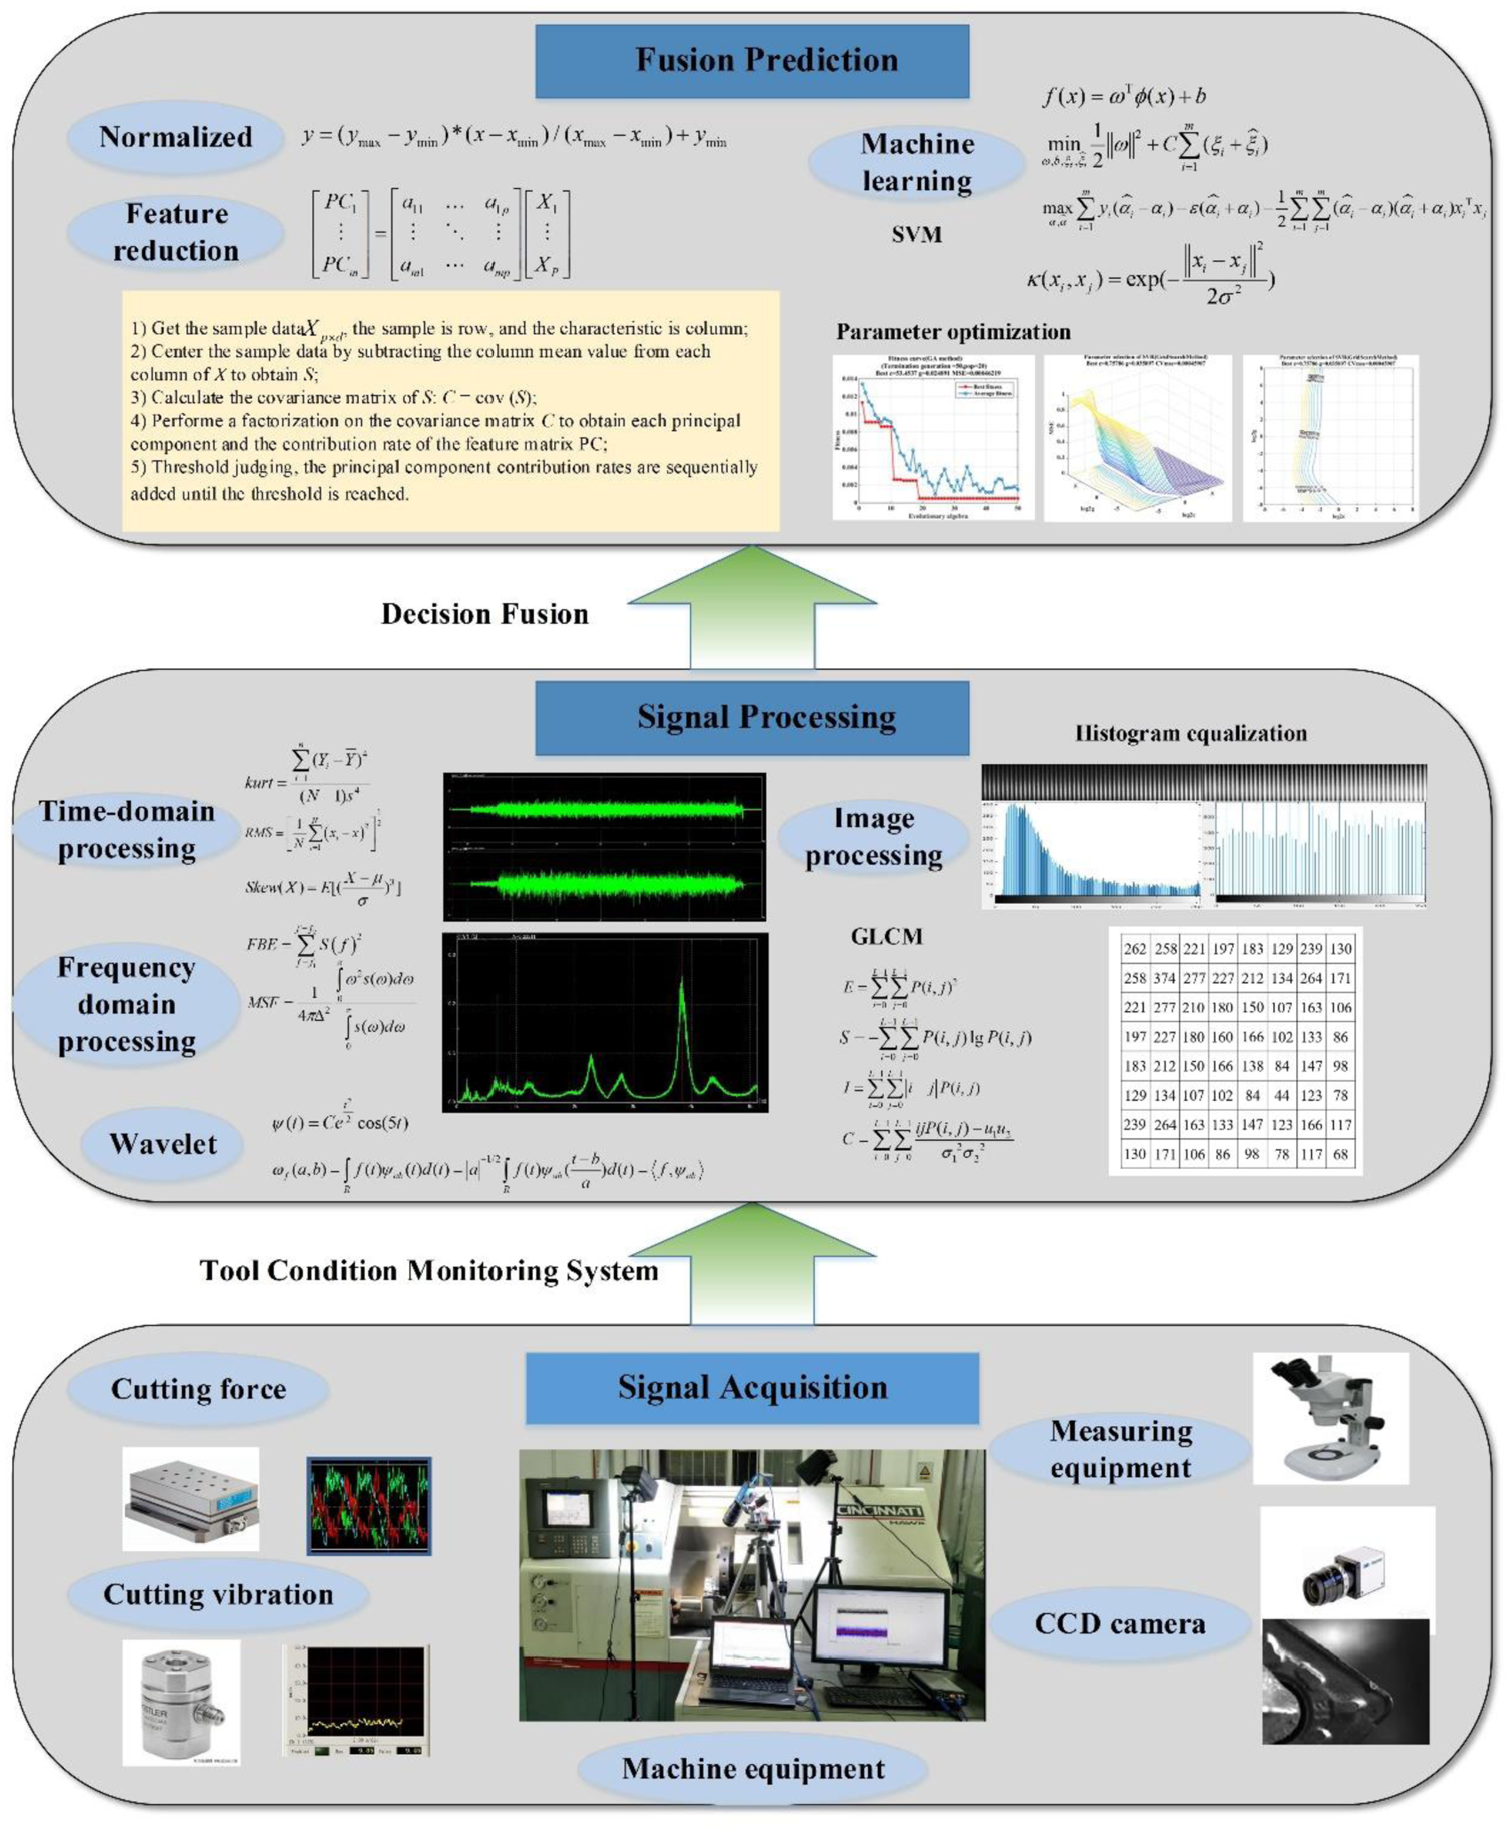
During the machining process, the cutting tool generally has three failure modes: damage, wear and chipping. This article mainly studies the normal wear process of the tool under the premise of correct selection of cutting tools and cutting parameters. Then force sensor, vibration sensor and CCD camera were used to build the TCM system, which was used to collect the cutting force, vibration signal and surface texture. The time-domain and frequency-domain features of the cutting force and vibration signal are extracted and the time-frequency domain feature is carried out by wavelet analysis. The surface texture is grayed out and preprocessed by histogram equalization and the corresponding features of the gray co-occurrence matrix of surface texture were extracted. Finally, the intelligent prediction model of tool wear is established using the optimized support vector regression (SVR) whose kernel parameters were optimized using the GS, GA and PSO algorithms.
Experimental setup
TCM system
The high hardness of high strength steel results in serious tool wear during the cutting process. Tool wear will increase cutting force and vibration and the surface texture will become disarrayed. Therefore, in this study, cutting force sensor, vibration sensor and CCD camera which was used to collect the surface texture were fused to set up the TCM system to monitor the state of cutting tool. The cutting force was measured by the Kistler dynamometer, which can measure the force in three directions. The vibration signal was measured by DASP acquisition instrument to collect two directions of vibration (the feed and depth direction) and the surface texture was collected by the CCD camera. Based on the above measuring instruments, the TCM system is shown in Figure 1.
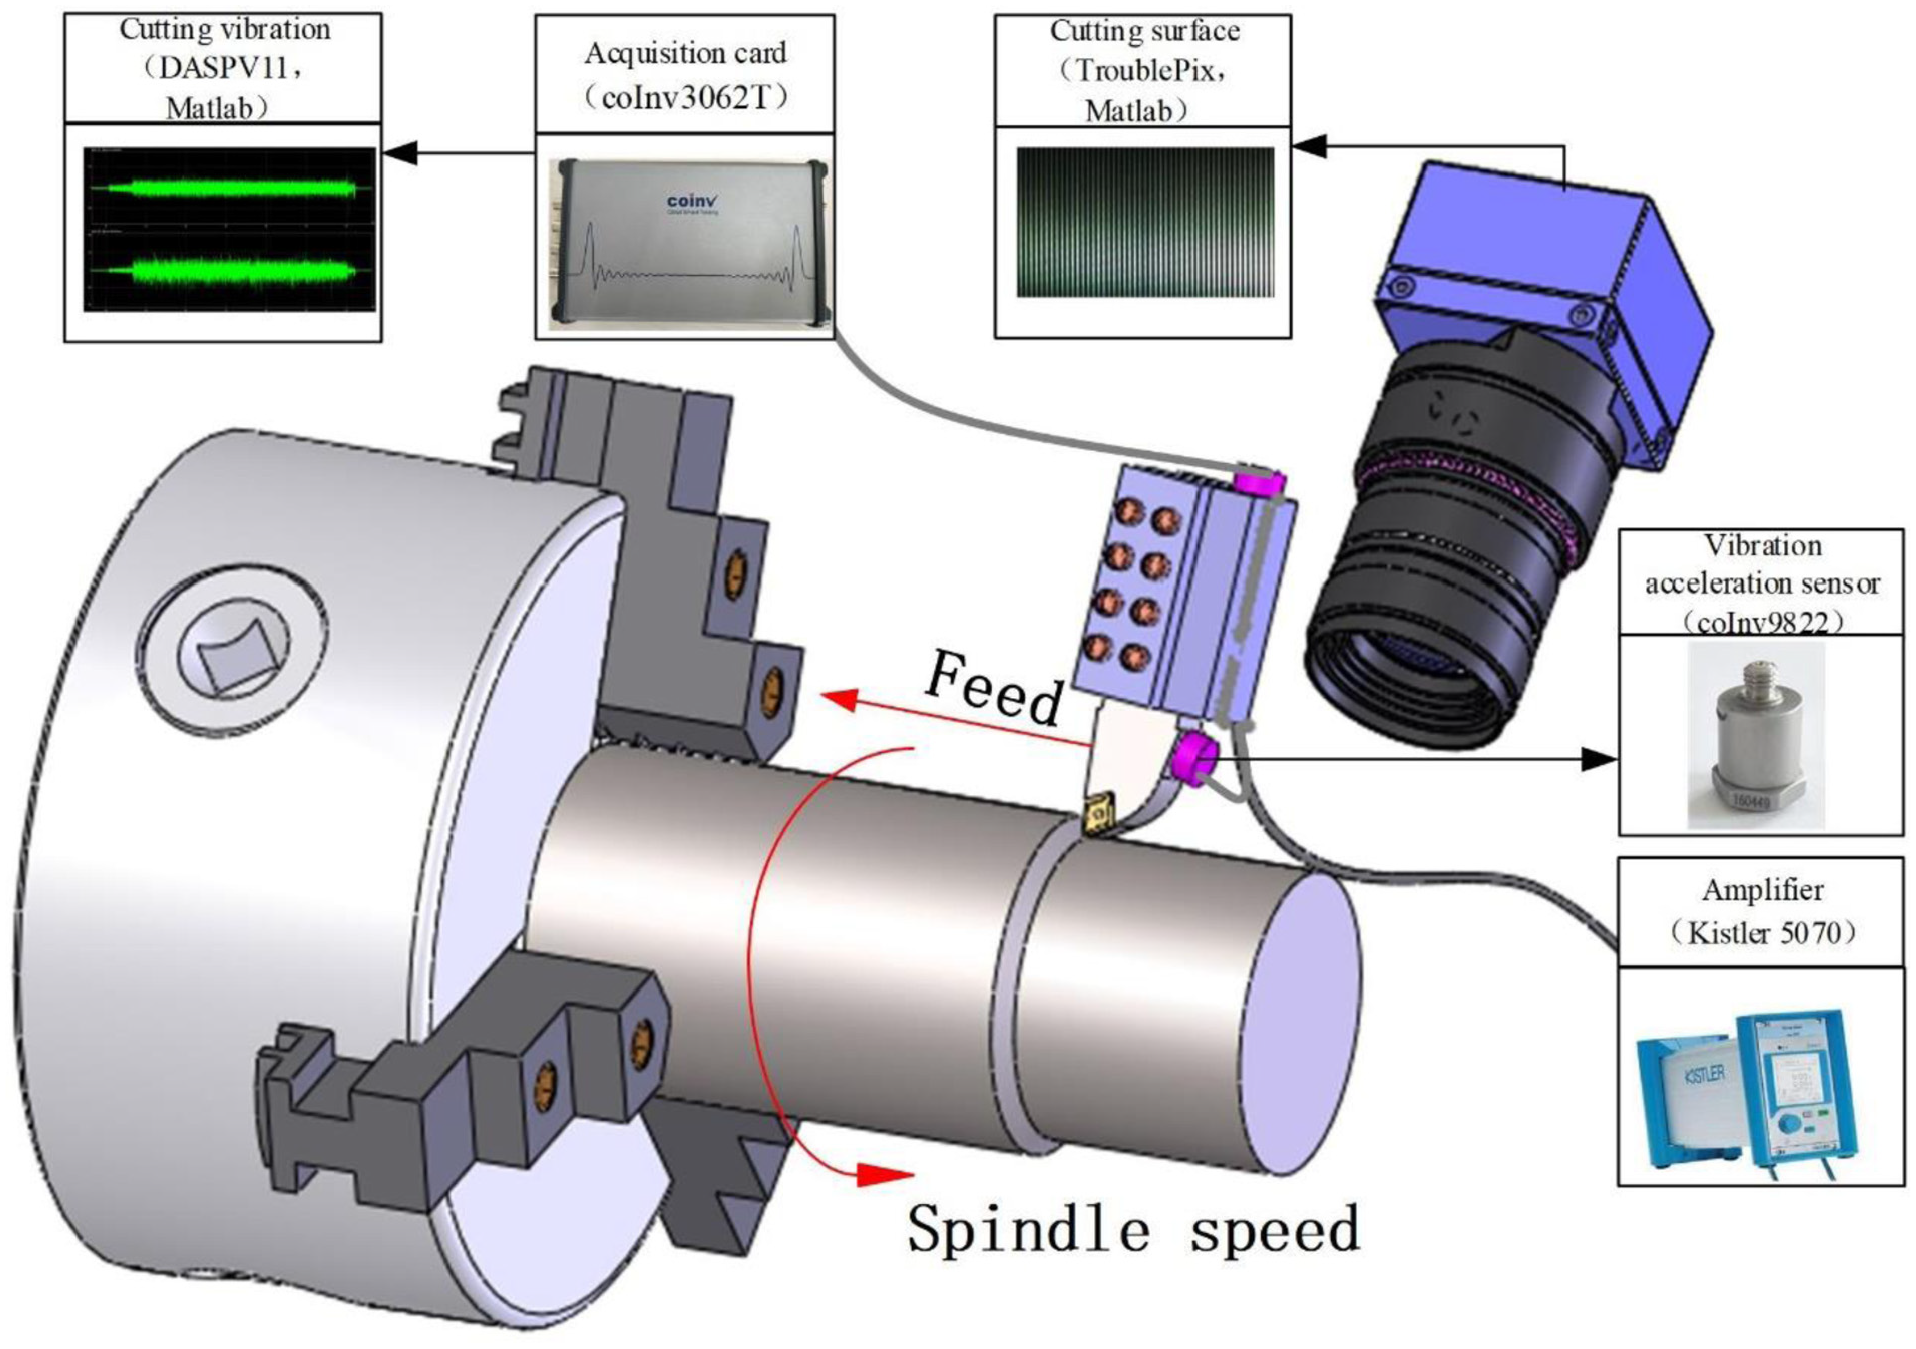
Tool condition monitoring system.
Experiment
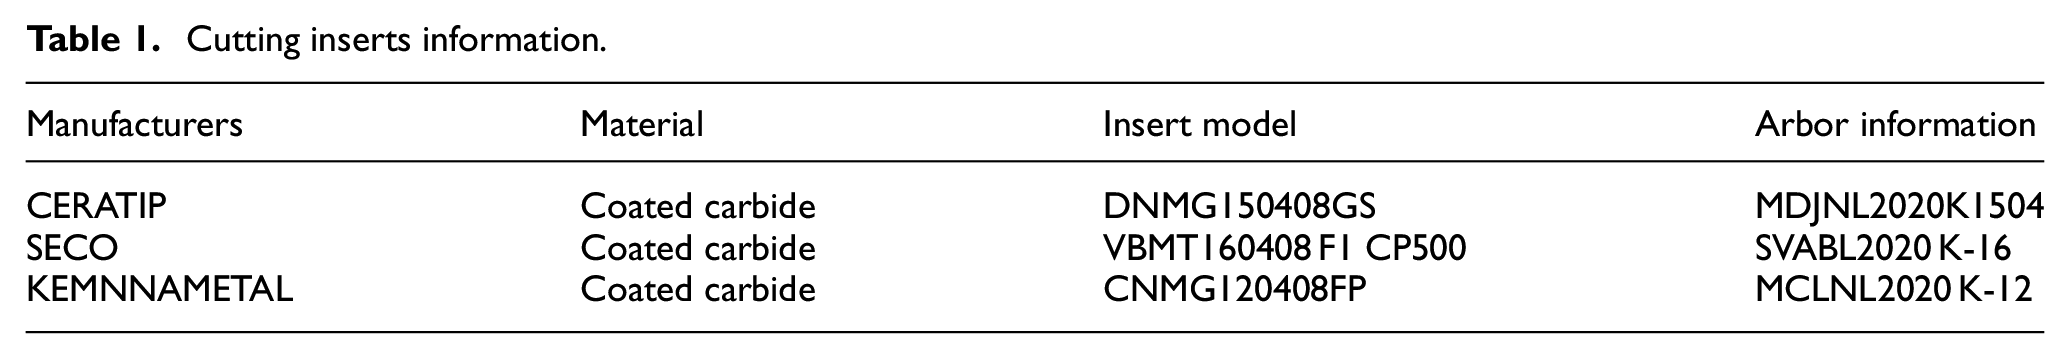
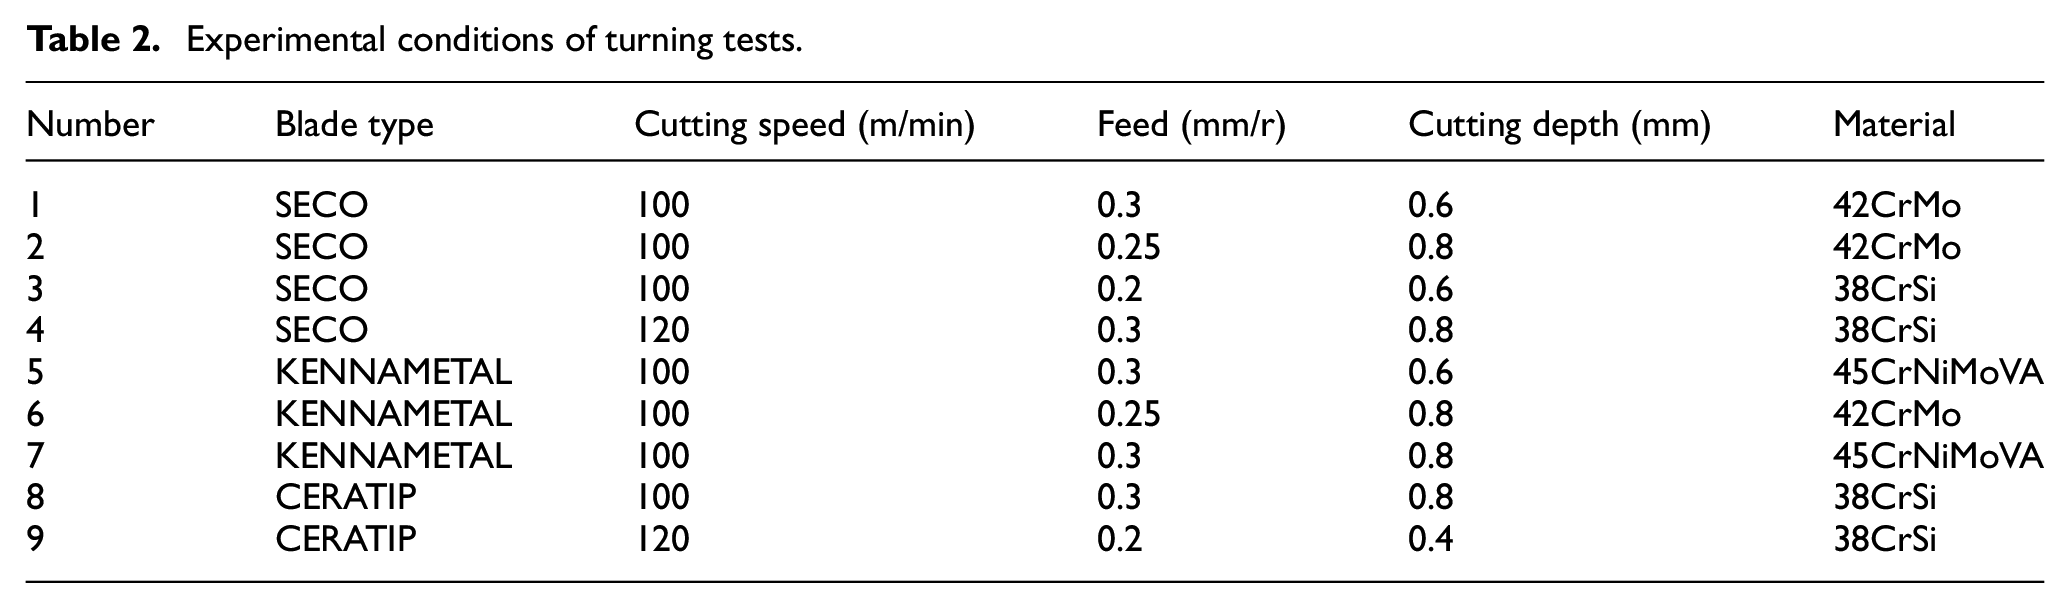
In this study, different tools, workpiece materials and cutting parameters were used in the turning experiment of high strength steel. Experimental machine is the TC-HAWK150 CNC lathe and the workpiece materials are high strength steel 42CrMo, 38CrSi and 45CrNiMoVA with high strength, toughness and hardness. The experimental inserts are Kyocera, KEMNNAMETAL and SECO coated carbide inserts. The information of cutting inserts and experimental conditions of turning are shown in Tables 1 and 2 respectively.
Cutting inserts information.
Experimental conditions of turning tests.
The wear edge height VB measured on the flank face is used as the tool blunt standard according to ISO and the wear amount of the tool flank face is easy to measure. Therefore, the VB value of the tool flank face measured by laser scanning confocal microscope of Keyence is used as the tool wear amount in the article. In order to study the relationship between cutting force, vibration, surface texture and tool wear of the cutting process, the tool wear process of the experiment 6 was analyzed. In the process of machining, when the tool wears, the contact mode between the tool and the workpiece changes from the theoretical line contact to the surface contact, so that the friction between the tool flank and the workpiece increases. 18 On the other hand, tool wear increases the contact length between the tool and the workpiece.19,20 Therefore, it can be seen from Figure 2(a) that the cutting force (especially the radial thrust force) gradually becomes larger. It can also be seen from Figure 2(b) that as the tool wear becomes more and more severe, the vibration gradually becomes larger. The reason for the analysis is that the wear of the tool will cause the instability of the process system and the increase of the cutting force, resulting in the generation of vibration. 21 Figure 2(c) represents the grayscale histogram. From Figure 2(c), it can be seen intuitively that as the tool wear gradually increases, the surface texture gradually becomes disorganized. When the tool is broken, the radial thrust force is greater than the main cutting force and the vibration in the direction of cutting depth is severe. Therefore, cutting force, cutting vibration and surface texture can reflect the tool wear process. In the following sections, the cutting force, vibration and surface texture features are extracted.
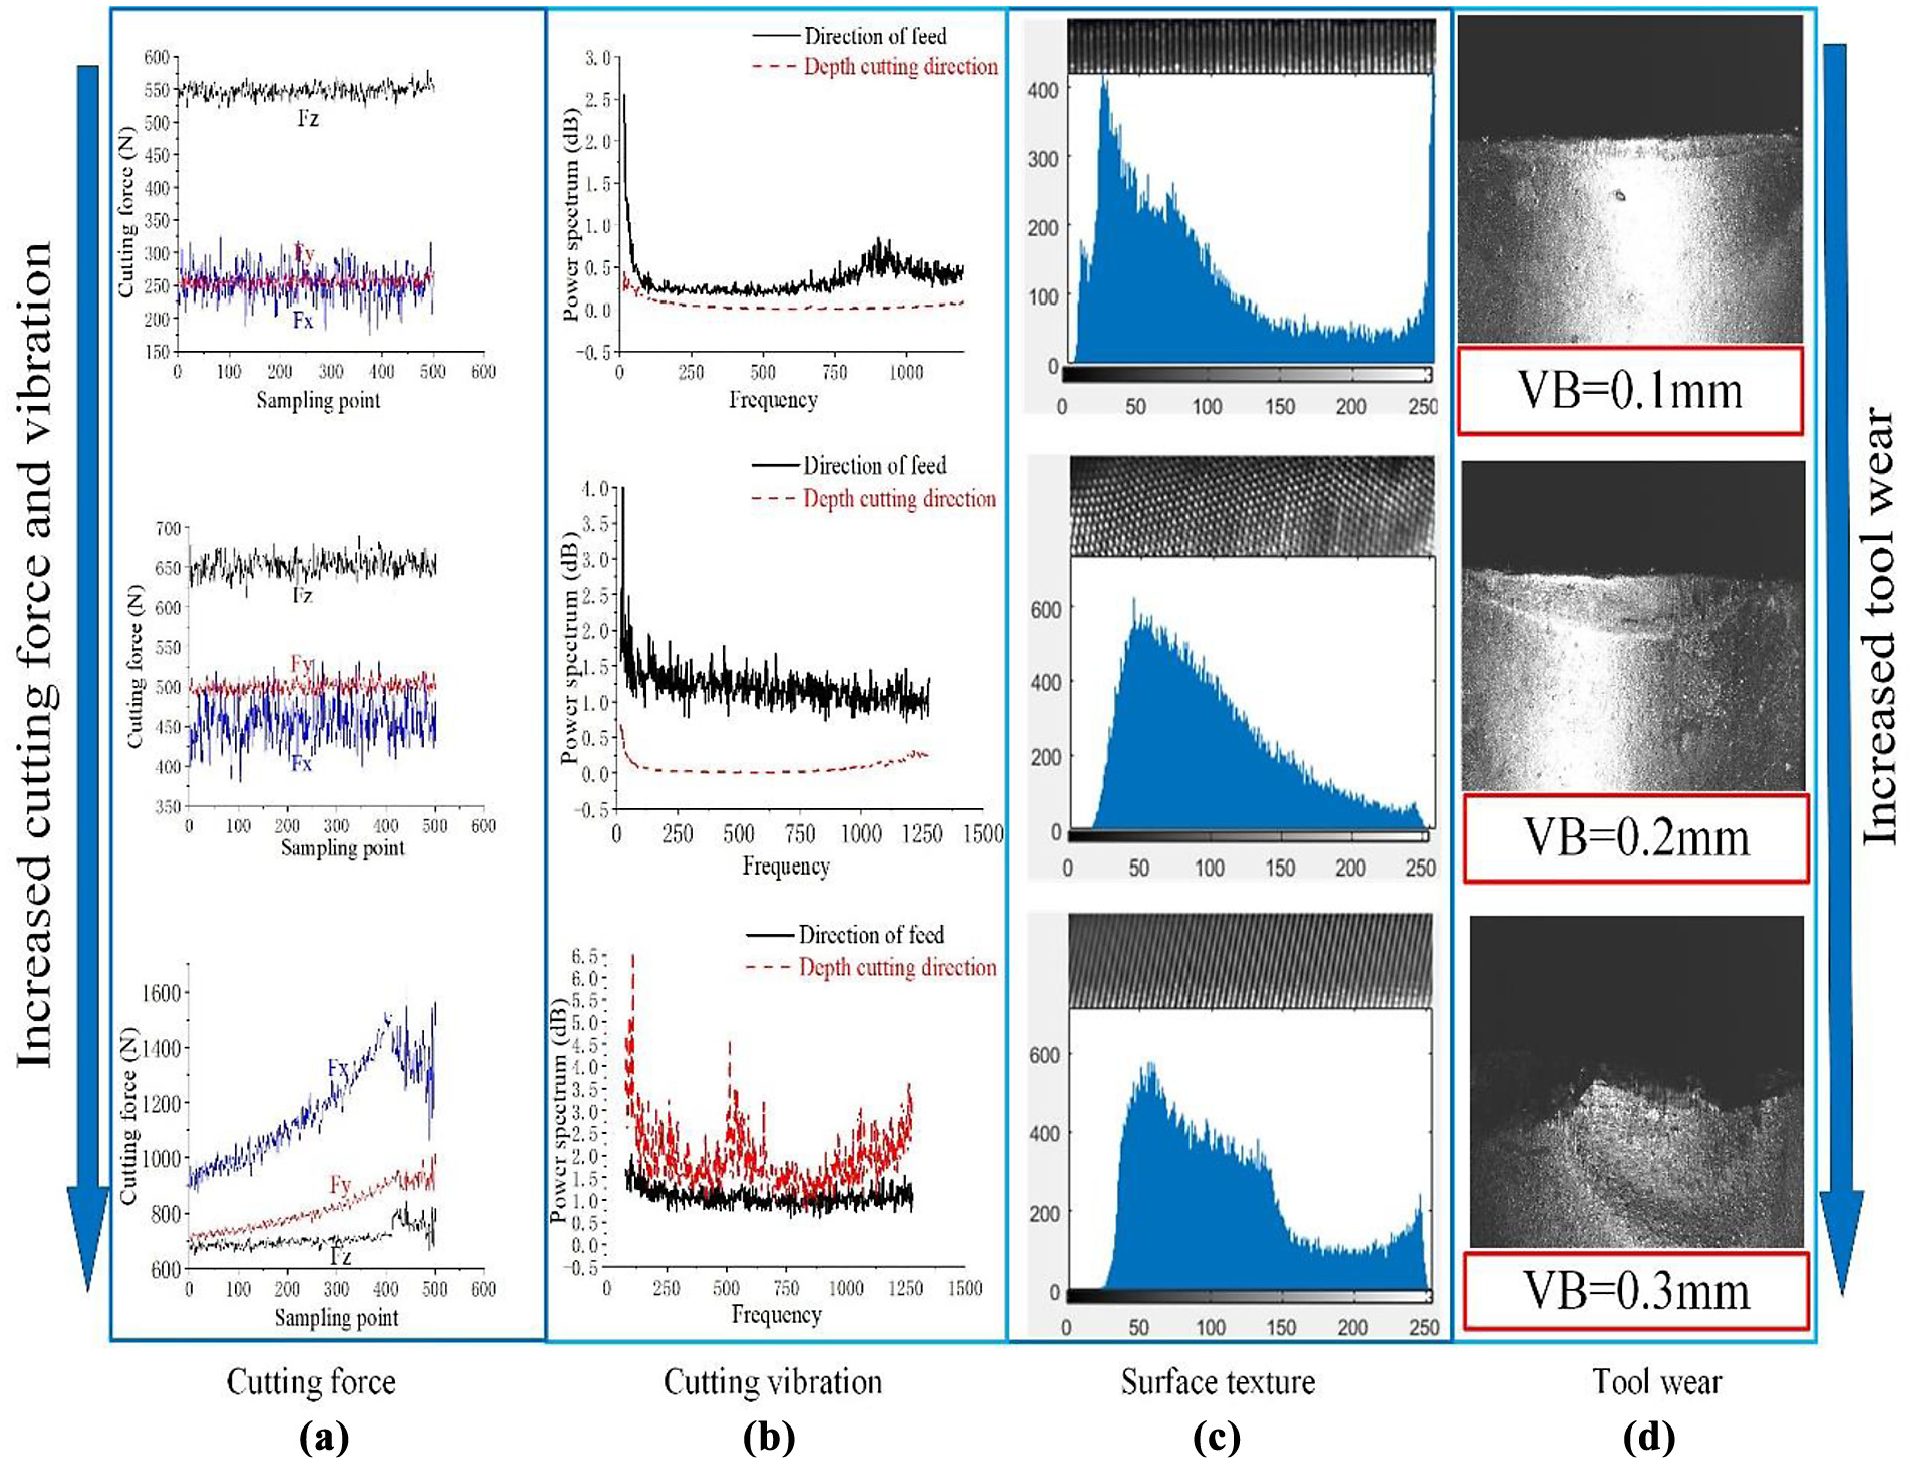
The analysis of tool wear process when machining 38CrSi.
In Figure 2(a), Fx represents the radial thrust force, Fy represents the axial thrust force and Fz represents the main cutting force. VB in Figure 2(d) represents the amount of flank wear.
In addition, during the machining process, the cutting tool may be accompanied by the formation of build-up edge. Previous scholars have also carried out many similar studies.22,23 Due to the cutting speed is approximate to or belongs to the range of high-speed cutting in this article, there is very little built-up edge during the processing, so the influence of built-up edge is not studied in this article. Therefore, the prediction of the amount of flank wear on the tool will be highlighted in the next section.
Feature extraction and intelligent algorithm
The cutting experiments were carried out under different cutting blades, workpiece materials and cutting parameters, and the cutting force, vibration signals and surface texture were gathered by TCM system. In the process of analysis, the initial data collected often can’t accurately reflect the effect on tool wear. In order to accurately predict the wear process of the tool, the corresponding features were extracted by different methods. Finally, the intelligent prediction of tool wear is carried out with machine learning algorithm. The flowchart of tool wear intelligent prediction model is shown in Figure 3.
Intelligent prediction model of the tool wear.
Multi-source heterogeneous data feature extraction
Generalized feature extraction refers to mapping the original features into fewer features. Images and datasets are the most redundant and comprehensive mode of information. In this article, the time-domain and frequency-domain features of the cutting force and vibration signal are extracted and the time-frequency domain features extraction is carried out by wavelet analysis. The surface texture is grayed out and preprocessed by histogram equalization. Gray co-occurrence matrix of surface texture is calculated to extract the corresponding features.
Feature extraction of the one-dimensional data
The cutting force signal and vibration signal collected during the cutting process belong to one-dimensional data. The time-domain and frequency-domain features were extracted from the cutting force and vibration, because the time-domain features can accurately and intuitively reflect the changes of various momentary signals in the cutting process. In addition, the cutting force and vibration signals obtained during the cutting process not only change with time but also relate to information such as frequency and phase, which require further analysis of the frequency structure of the signal and description of the signal in the frequency domain. In addition, the cutting process is a dynamic and non-stationary process, so the conjoint analysis in time-frequency domain is needed. Wavelet analysis is a mathematical tool for multiresolution analysis in breaking through abrupt signals and non-stationary signals with its unique advantages. 24 The extracted time-domain, frequency-domain and wavelet-domain features are shown in Table 3.
Mathematical equations of the extracted signal features.
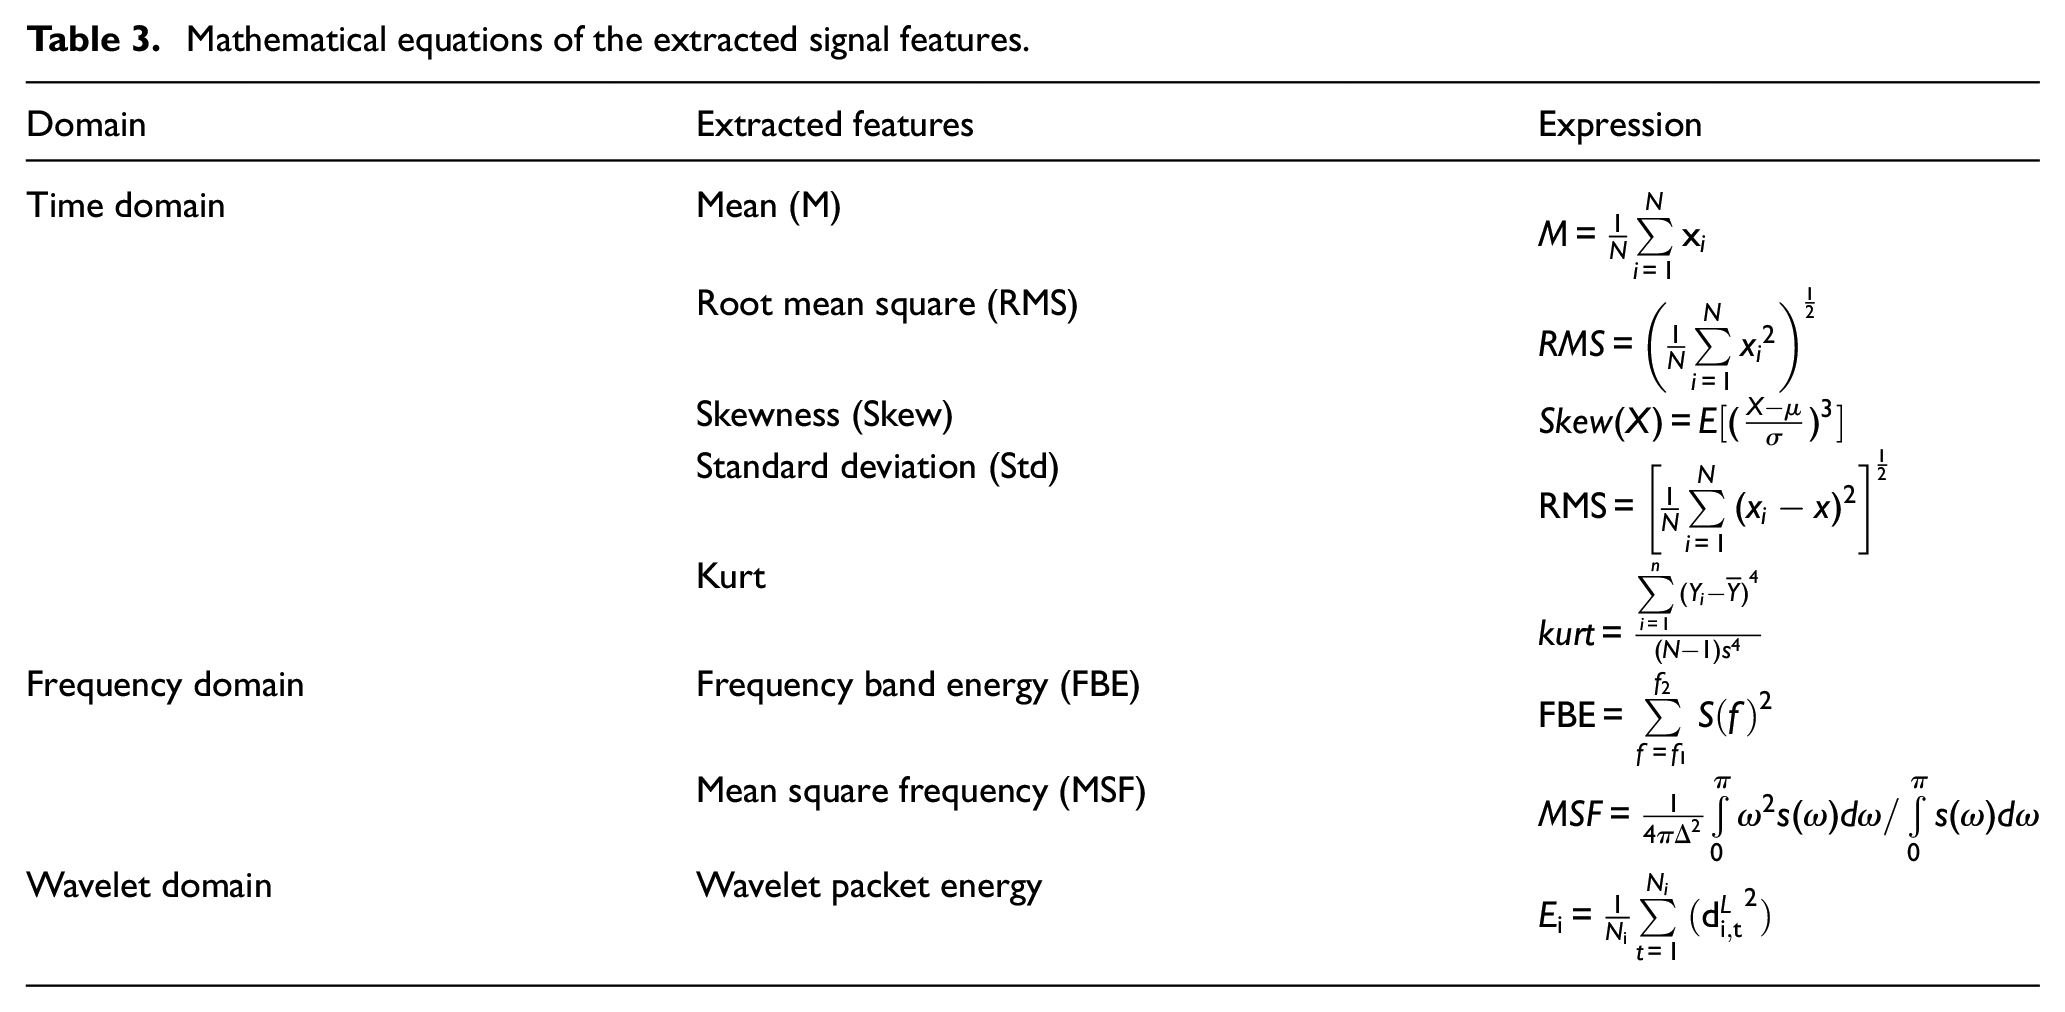
Table 3 lists the main features. In the time domain, five types of statistical features are extracted. Mean values are often used to characterize the central trend of the TCM signal and reflect the static cutting force during the cutting process. Root mean square (RMS) represents the average energy of a signal within a given time interval. Skewness (Skew) represents the degree of asymmetry of the probability distribution density curve relative to the mean value. The standard deviation (Std) is often used to characterize the degree of fluctuation of the signal reflecting the dynamic cutting force during cutting and kurt reflects the state of tool wear changed. In the frequency domain, two features that quantify the frequency property of a signal are extracted. f is the frequency spectrum converted from the time-domain signal by using the Fast Fourier Transform (FFT) and
The relationship between the features of cutting force and vibration in feed direction and tool wear of experimental 8 is shown in Figure 4. It can be seen that the RMS and FBE of cutting force increase with the tool wear and the RMS and FBE of cutting vibration decrease with the tool wear, because tool wear will cause intense growth of cutting force and unstable vibration in the dynamic system. Therefore, the time and frequency domain features of cutting force and vibration can effectively predict the tool wear. The meaning of RMS and FBE in Figure 4 refer to Table 3. F and a indicate cutting force and vibration respectively and VB represents the tool wear value.
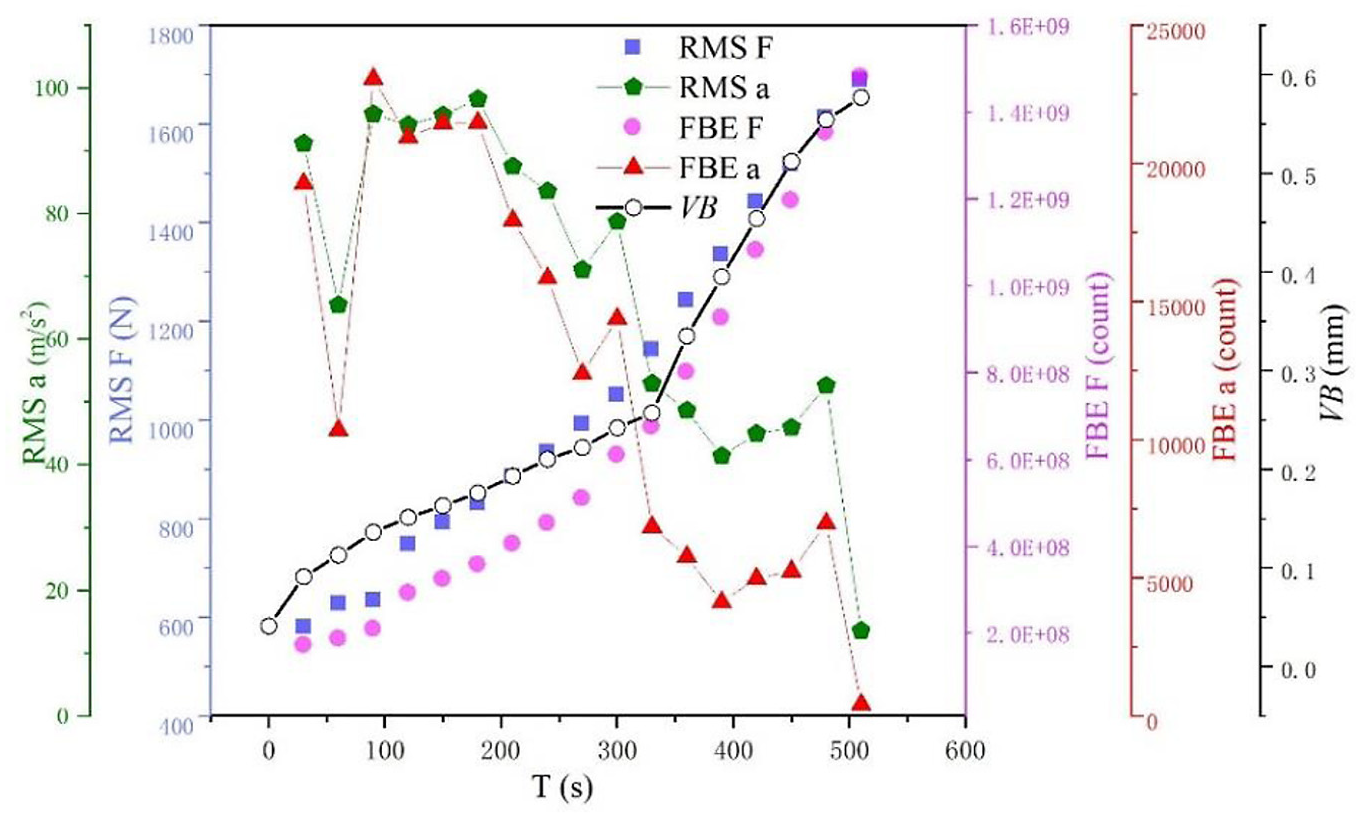
Relationship between features of cutting force and vibration and tool wear.
Feature extraction of the two-dimensional data
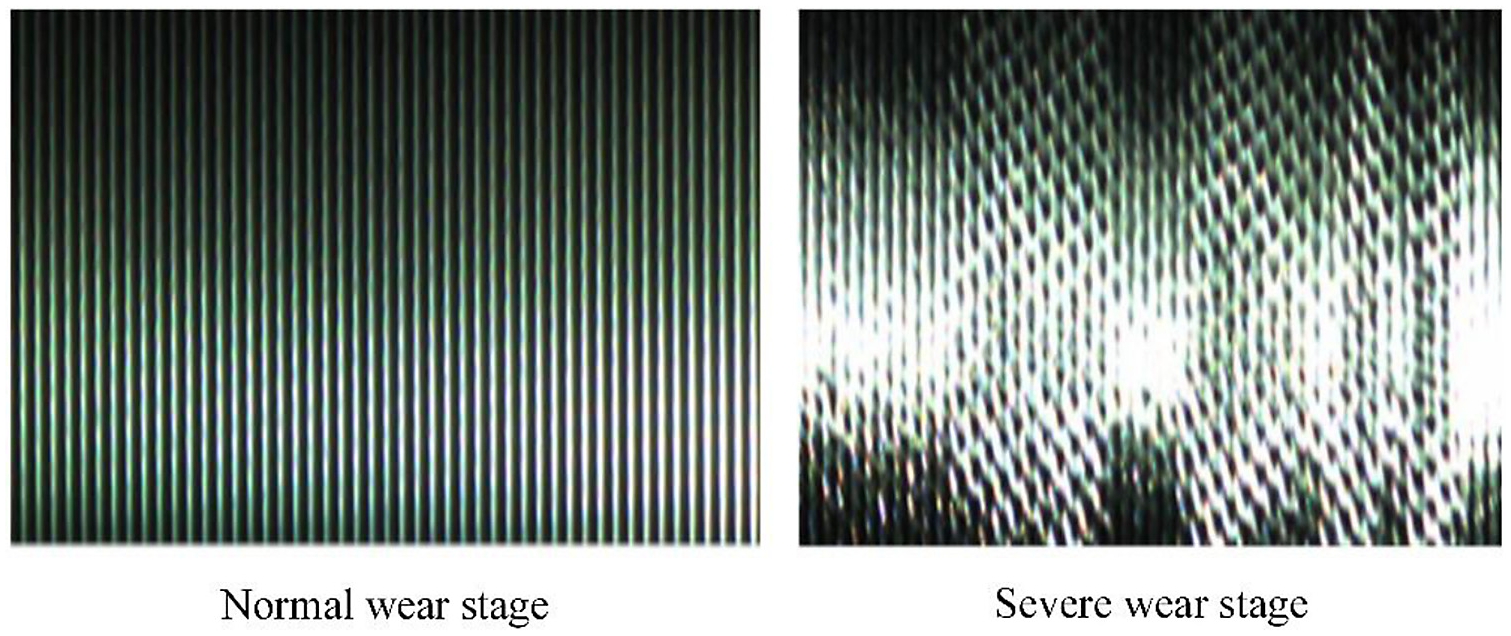
The surface texture belongs to two-dimensional data. During the cutting process, the surface texture of the machined surface was photographed using the CCD camera. When the feed rate is fixed, the cutting surface texture will change irregularly as the tool wear changes. In the normal wear stage, the surface texture is clear, evenly distributed and regular; when the tool is severe wore, the vibration during the cutting process became stronger and the disordered surface texture was produced as shown in Figure 5.
The surface texture of different wear stages.
Therefore, the surface texture can reflect tool wear. However, the surface texture acquired during the cutting process is colored and cannot reflect the morphological characteristics of the surface texture. Therefore, the surface texture need to be grayed. As shown in Figure 6, the surface texture was gray-scaled and then the error caused by uneven light intensity was eliminated. 25 Finally, the features of the Gray Level Co-occurrence Matrix of surface texture mainly including energy, entropy, inertia moment and correlation are extracted.
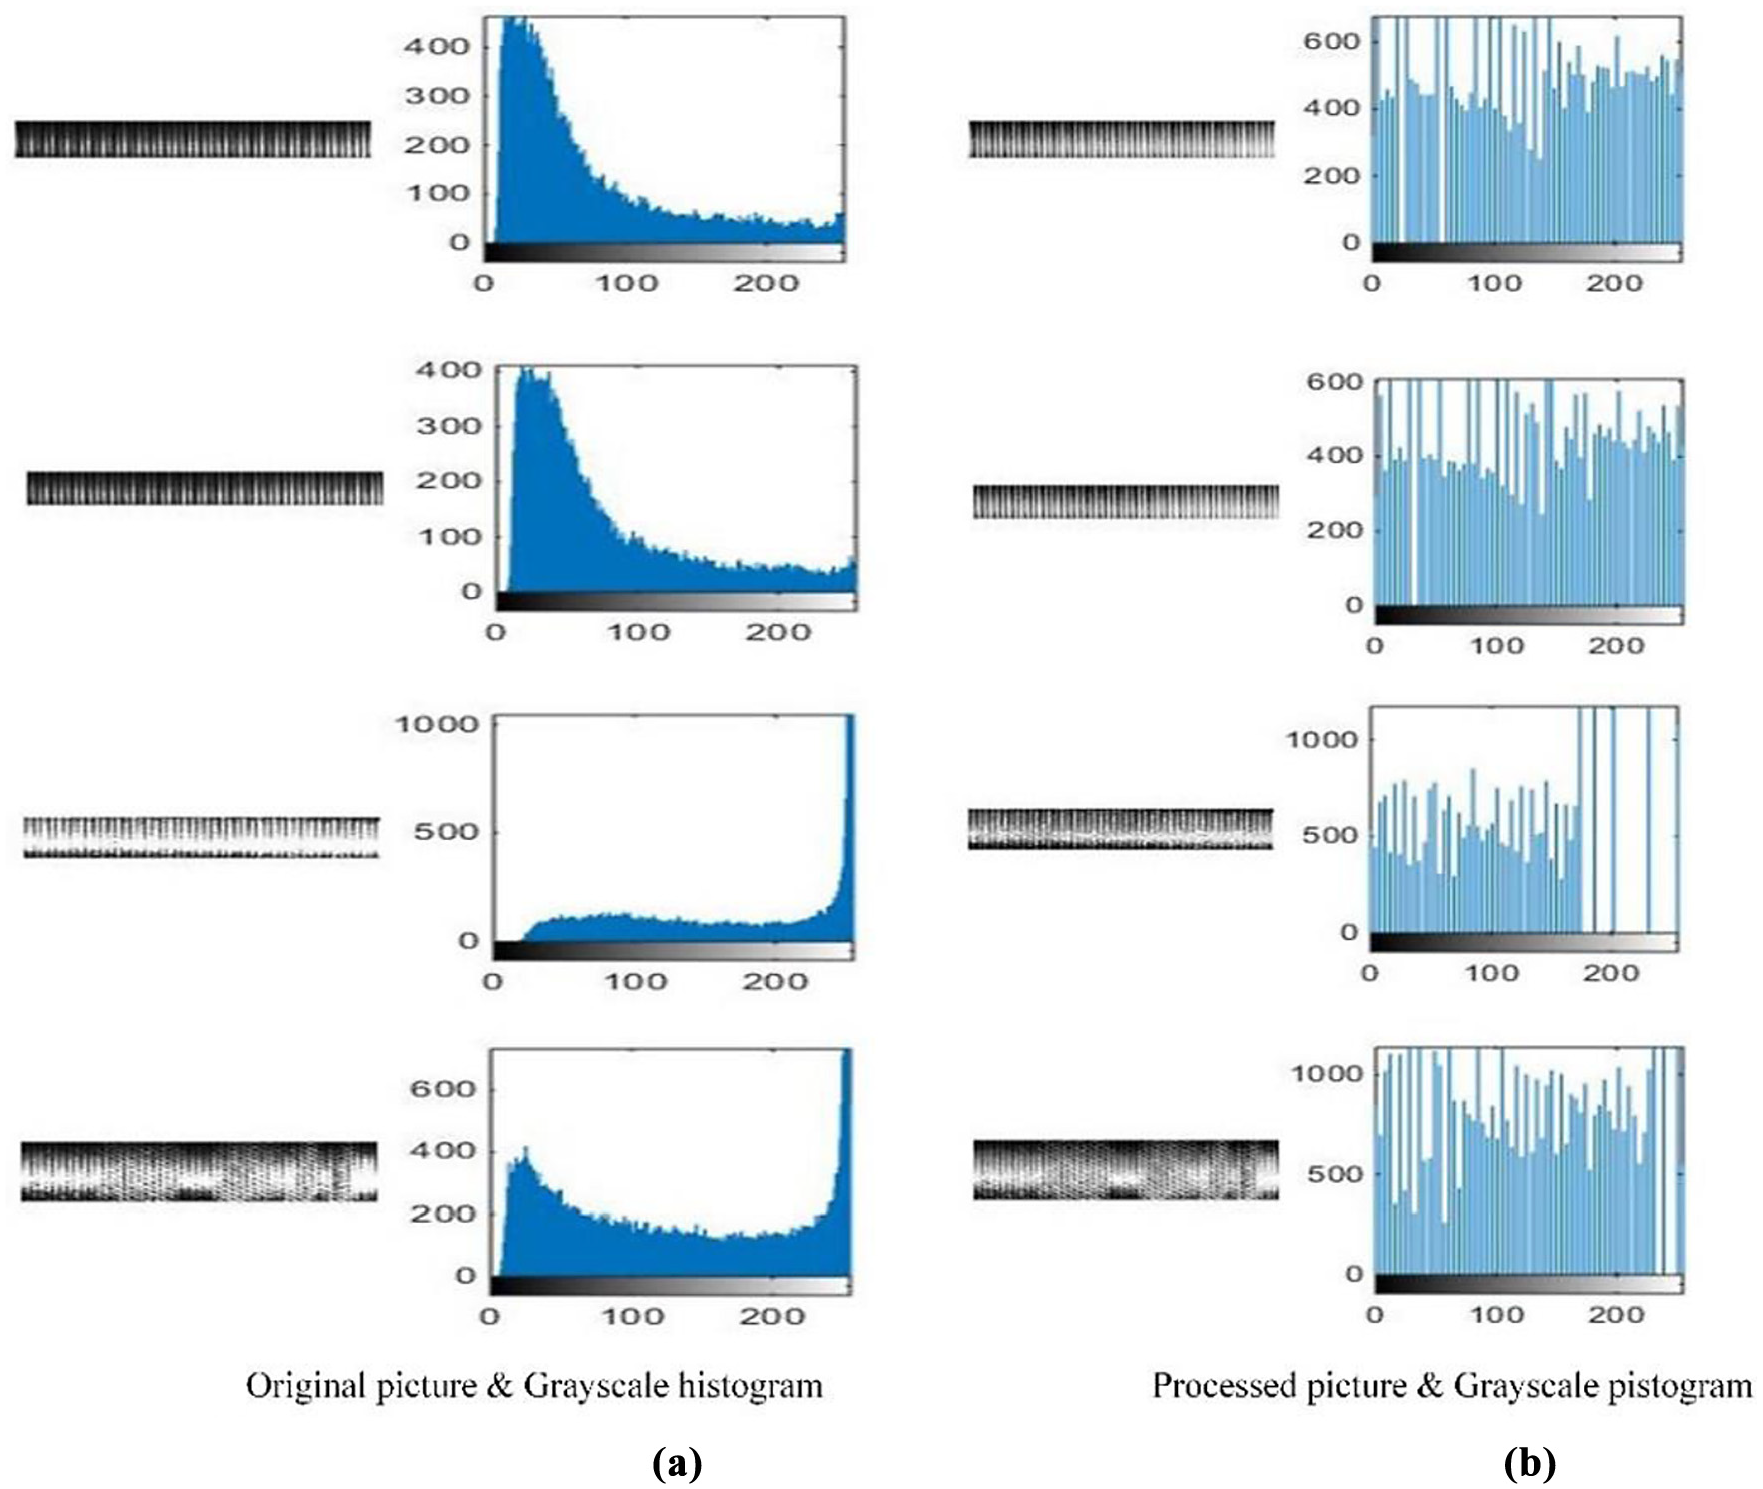
Histogram equalization results of 38CrSi.
It can be seen from Figure 6(a) that the original surface texture is quite different, because of the influence of light, angle of view, orientation and noise. After the surface texture is processed and the distribution of gray level is polarized and non-homogeneous, so the gray level surface texture must be processed based on histogram equalization to convert the original histogram into a uniform distribution form. The dynamic range of the pixel gray value is increased and the contrast of the overall surface texture is shown in Figure 6(b).
The texture is formed by the repeated alternation of the gray level distribution in the spatial position, and gray level surface texture has spatial correlation properties. GLCM is a matrix that consists of joint probability density P (i, j, d, θ) between the gray levels of the surface texture. 16 The expression is defined as
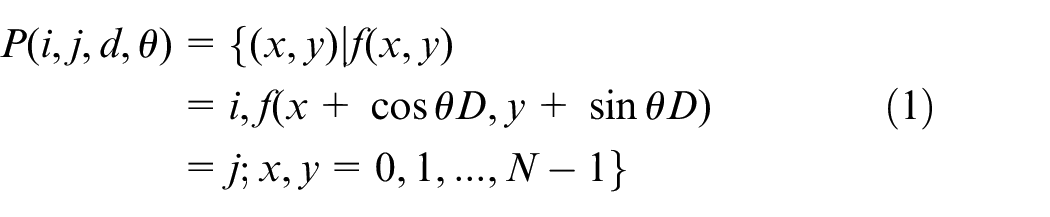
where d represents distance space and θ is direction.
There are four kinds of common spatial position relations mainly including horizontal, vertical, positive and negative 45 degrees, as shown in the Figure 7(a). When the distance and the location of space are determined, the corresponding gray level co-occurrence matrix can be obtained. Figure 7(b) shows the 8-order gray level co-occurrence matrix of the different direction.
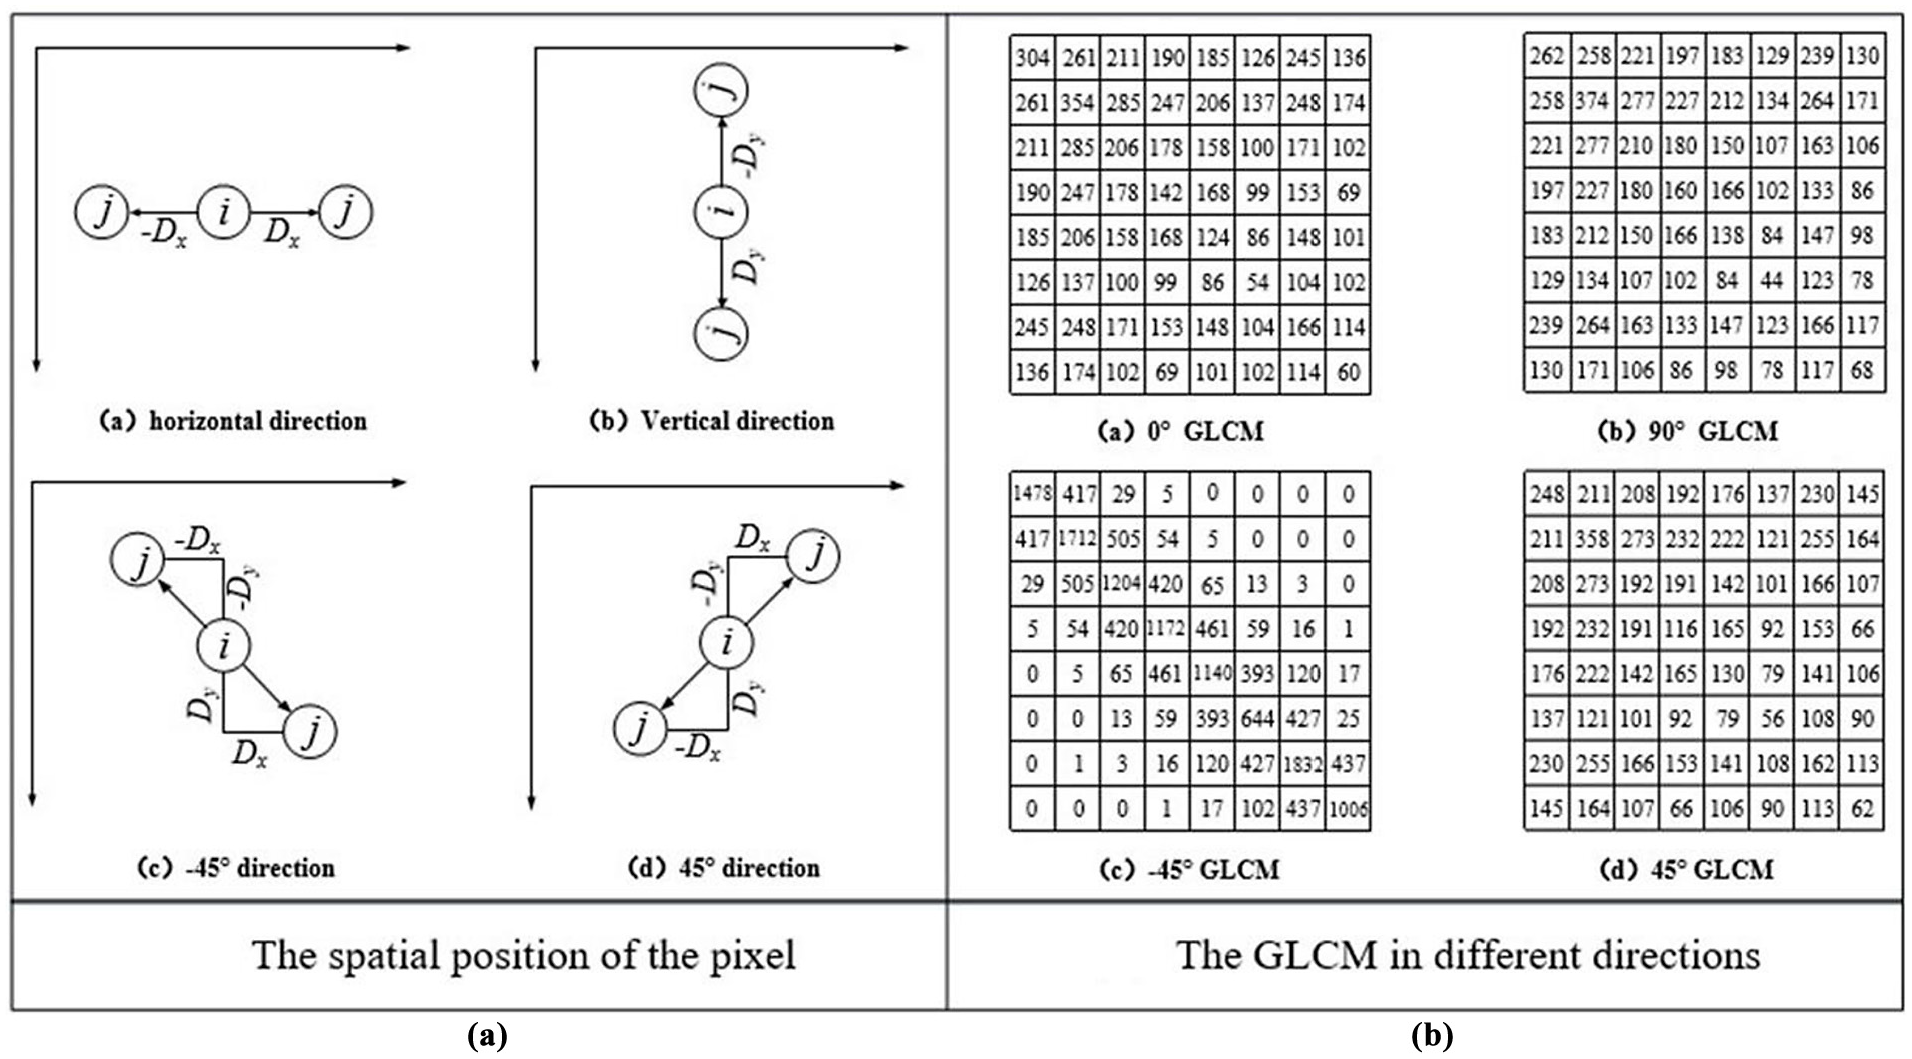
The pixel spatial position of 38CrSi machined surface and corresponding GLCM.
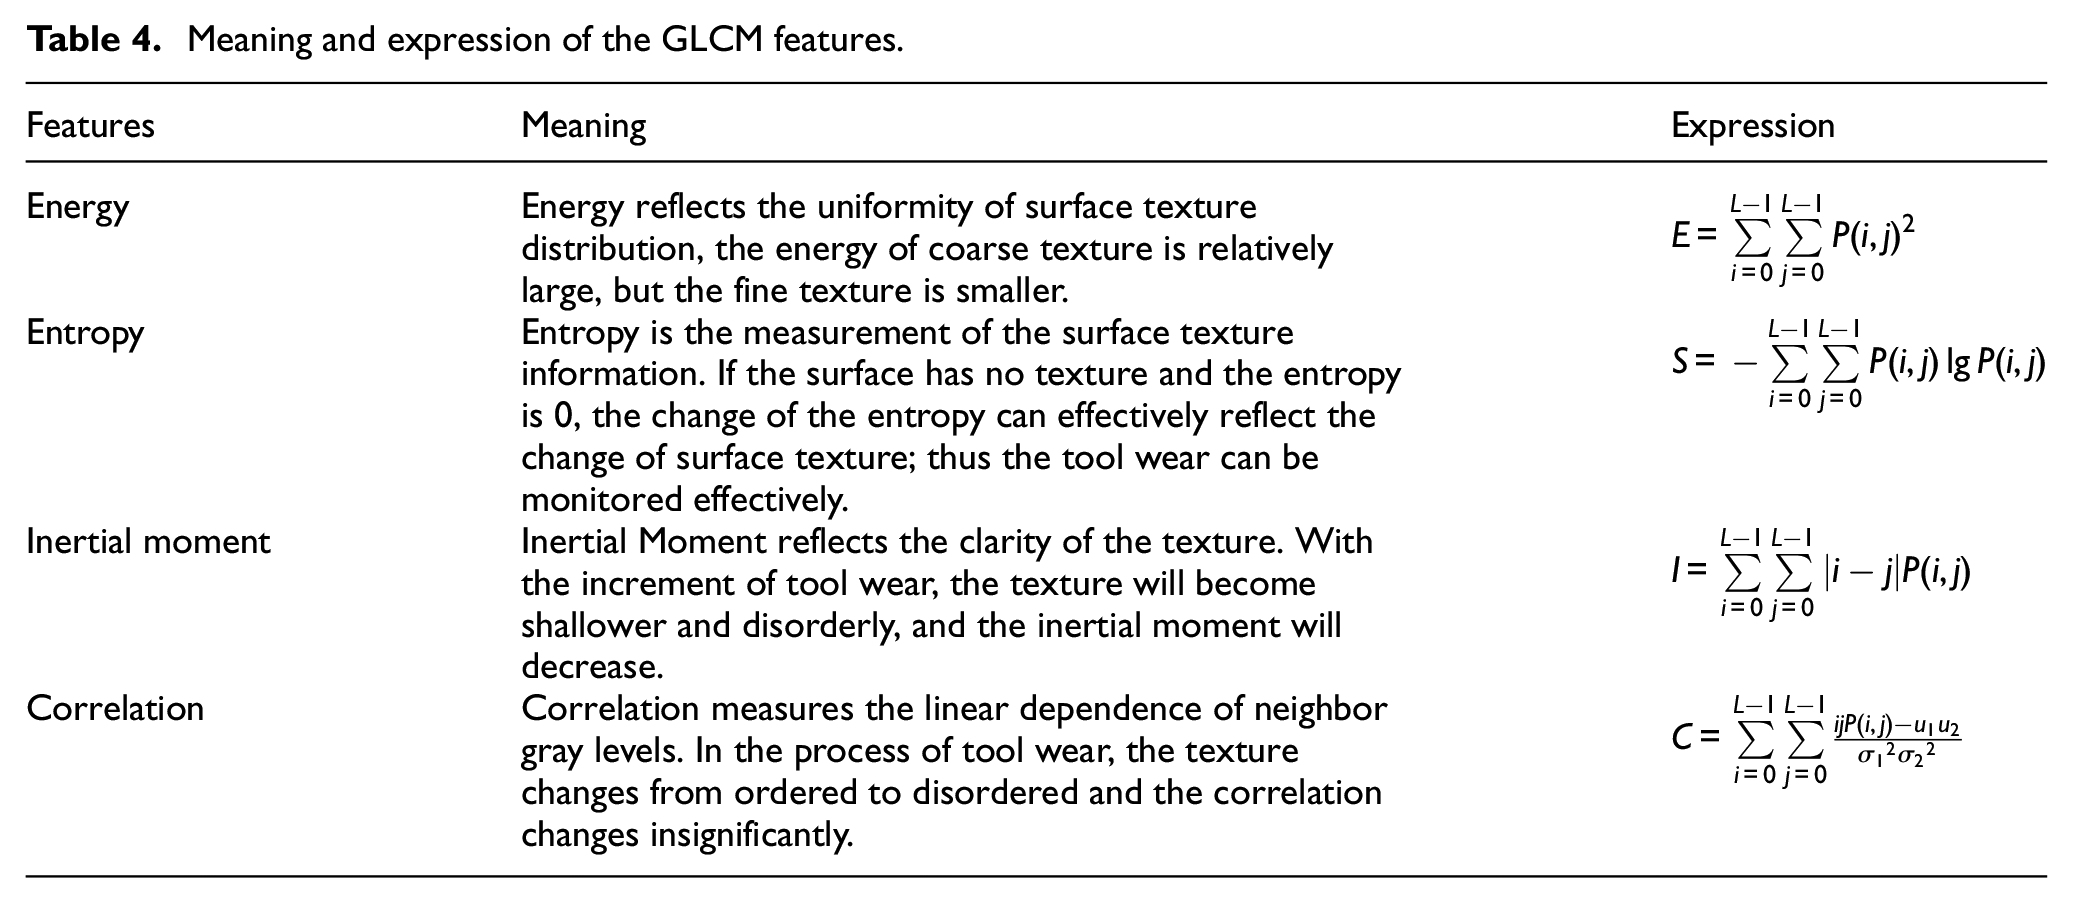
The features of the GLCM of the surface texture were extracted, which are closely related to the tool wear. The meaning and expression of the features are shown in Table 4.
Meaning and expression of the GLCM features.
As described earlier in Figure 5, the surface texture can reflect whether the tool has broken. Therefore, the feature quantity representing the surface texture can reflect whether the tool has been broken. As shown in Figure 8, the relationship between the inertial moment and tool wear is illustrated.
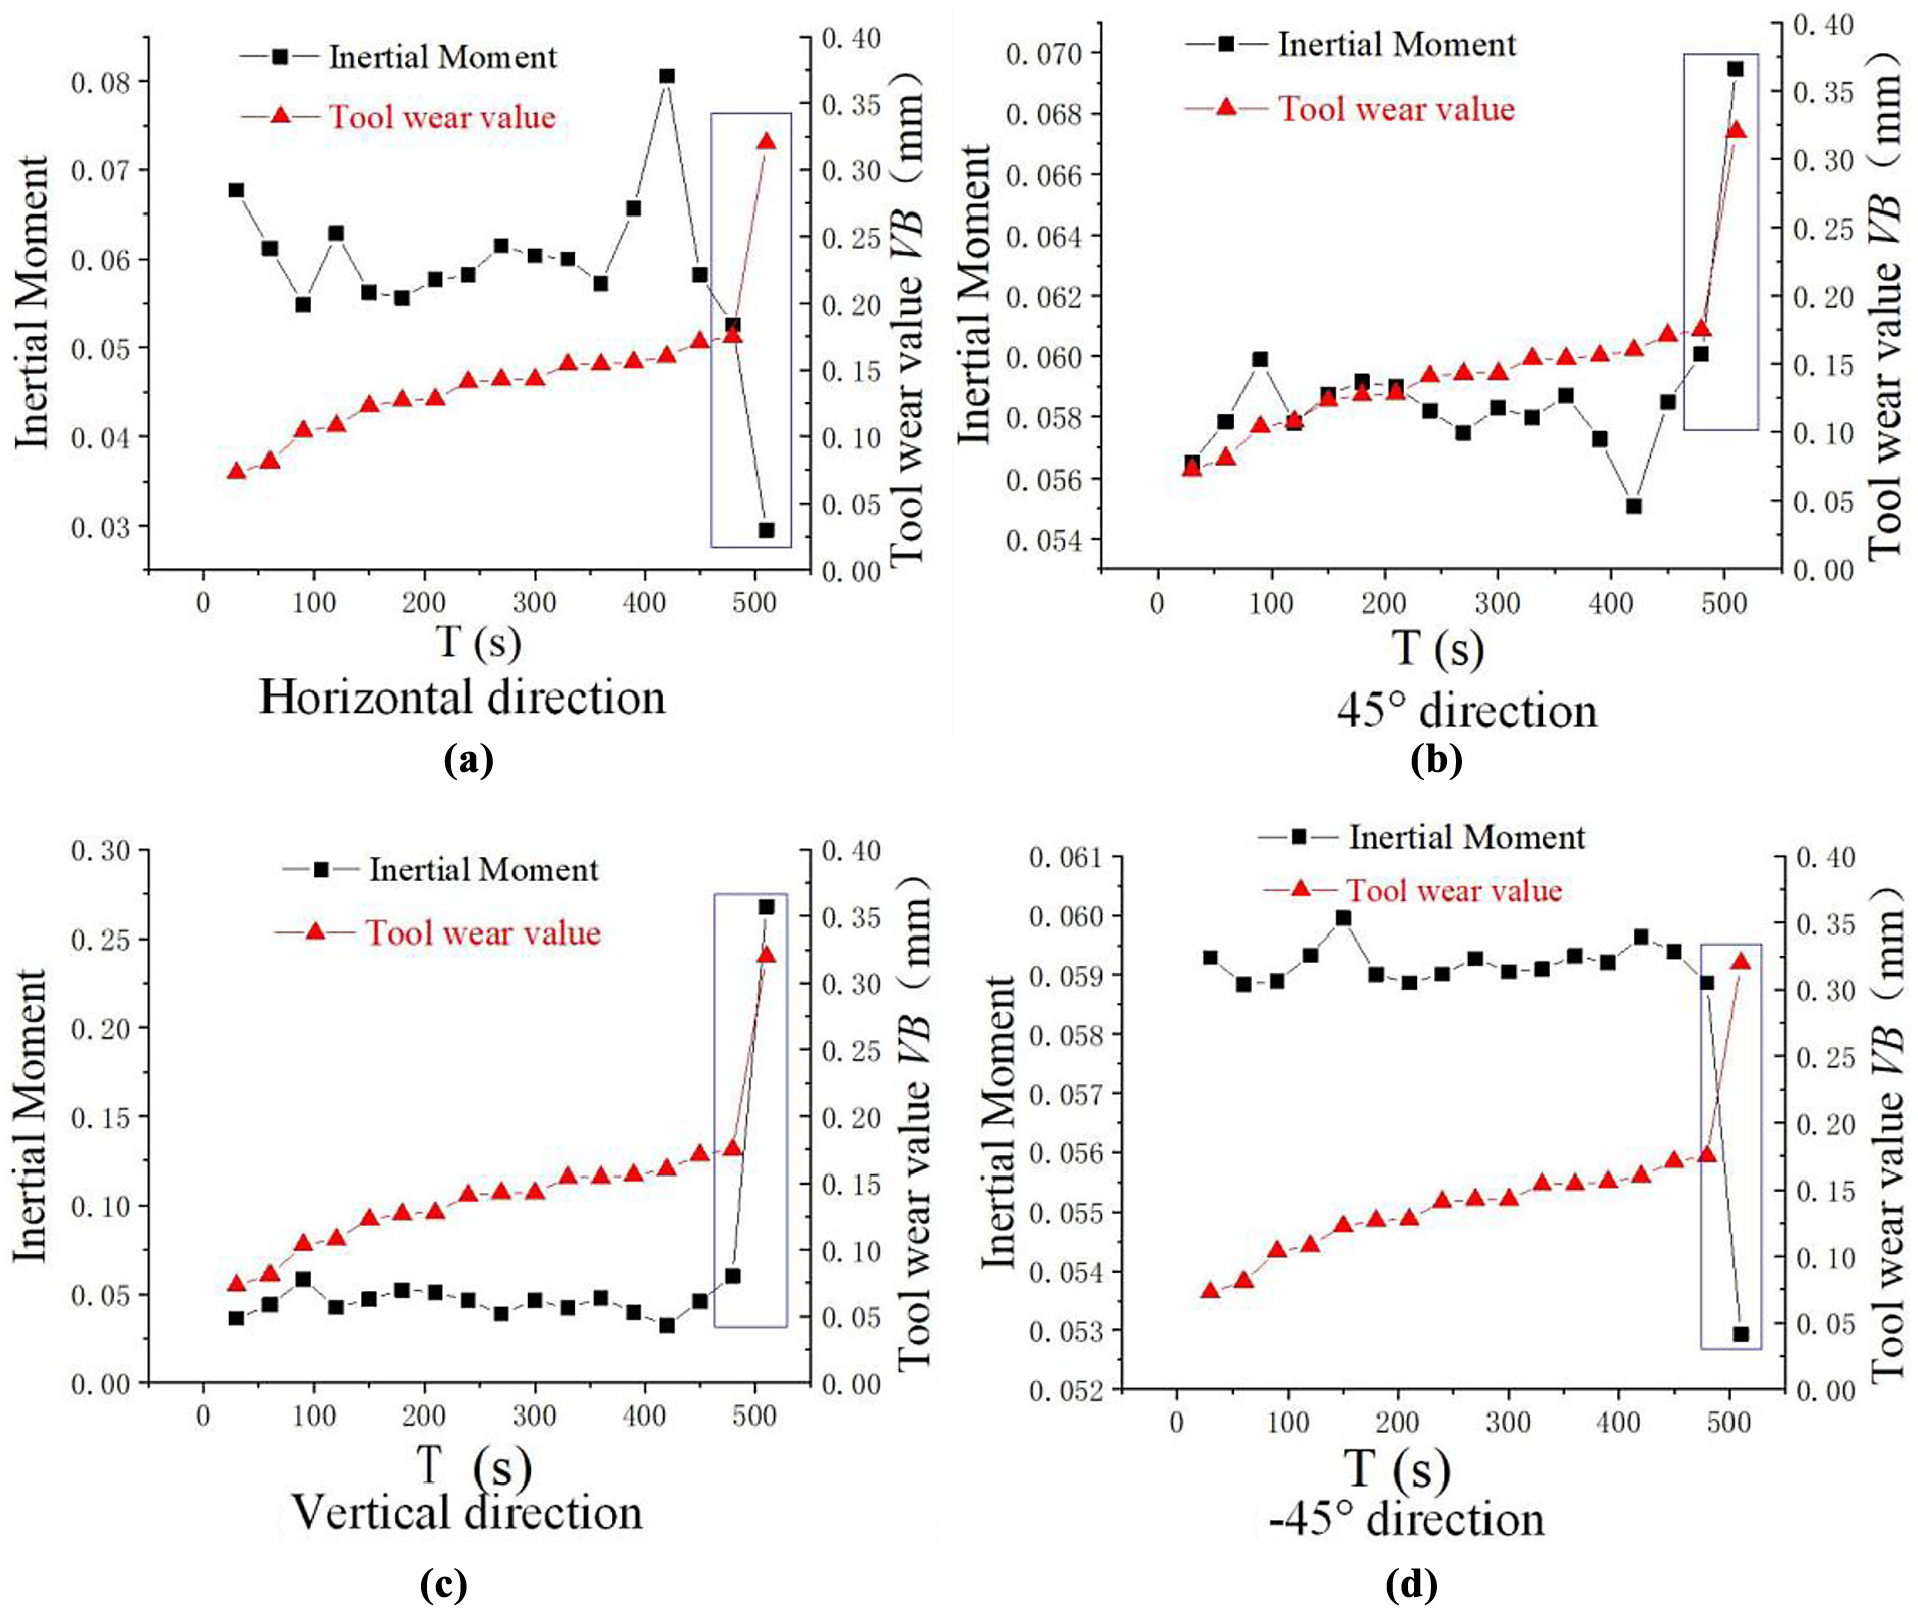
The relationship between inertial moment and tool wear.
In the normal wear stage, the surface texture is a regular vertical stripe and the texture is clear, so the moment inertia changes less. When the tool is broken, the surface texture becomes lighter and irregular, so the moment inertia changes drastically. The moment inertia in the horizontal direction and −45° direction drops sharply and the moment inertia in the vertical direction and 45° direction rises sharply.
Figure 9 illustrates the relationship between energy, entropy, correlation and tool wear. In the normal wear stage, the surface texture is uniform and small, and the texture characteristics in different directions are consistent, so the energy, correlation and entropy are all consistent. When the tool breaks, the surface texture of the cutting surface becomes irregular, which inevitably leads to simultaneous changes in entropy and energy, and the trend of change is opposite.
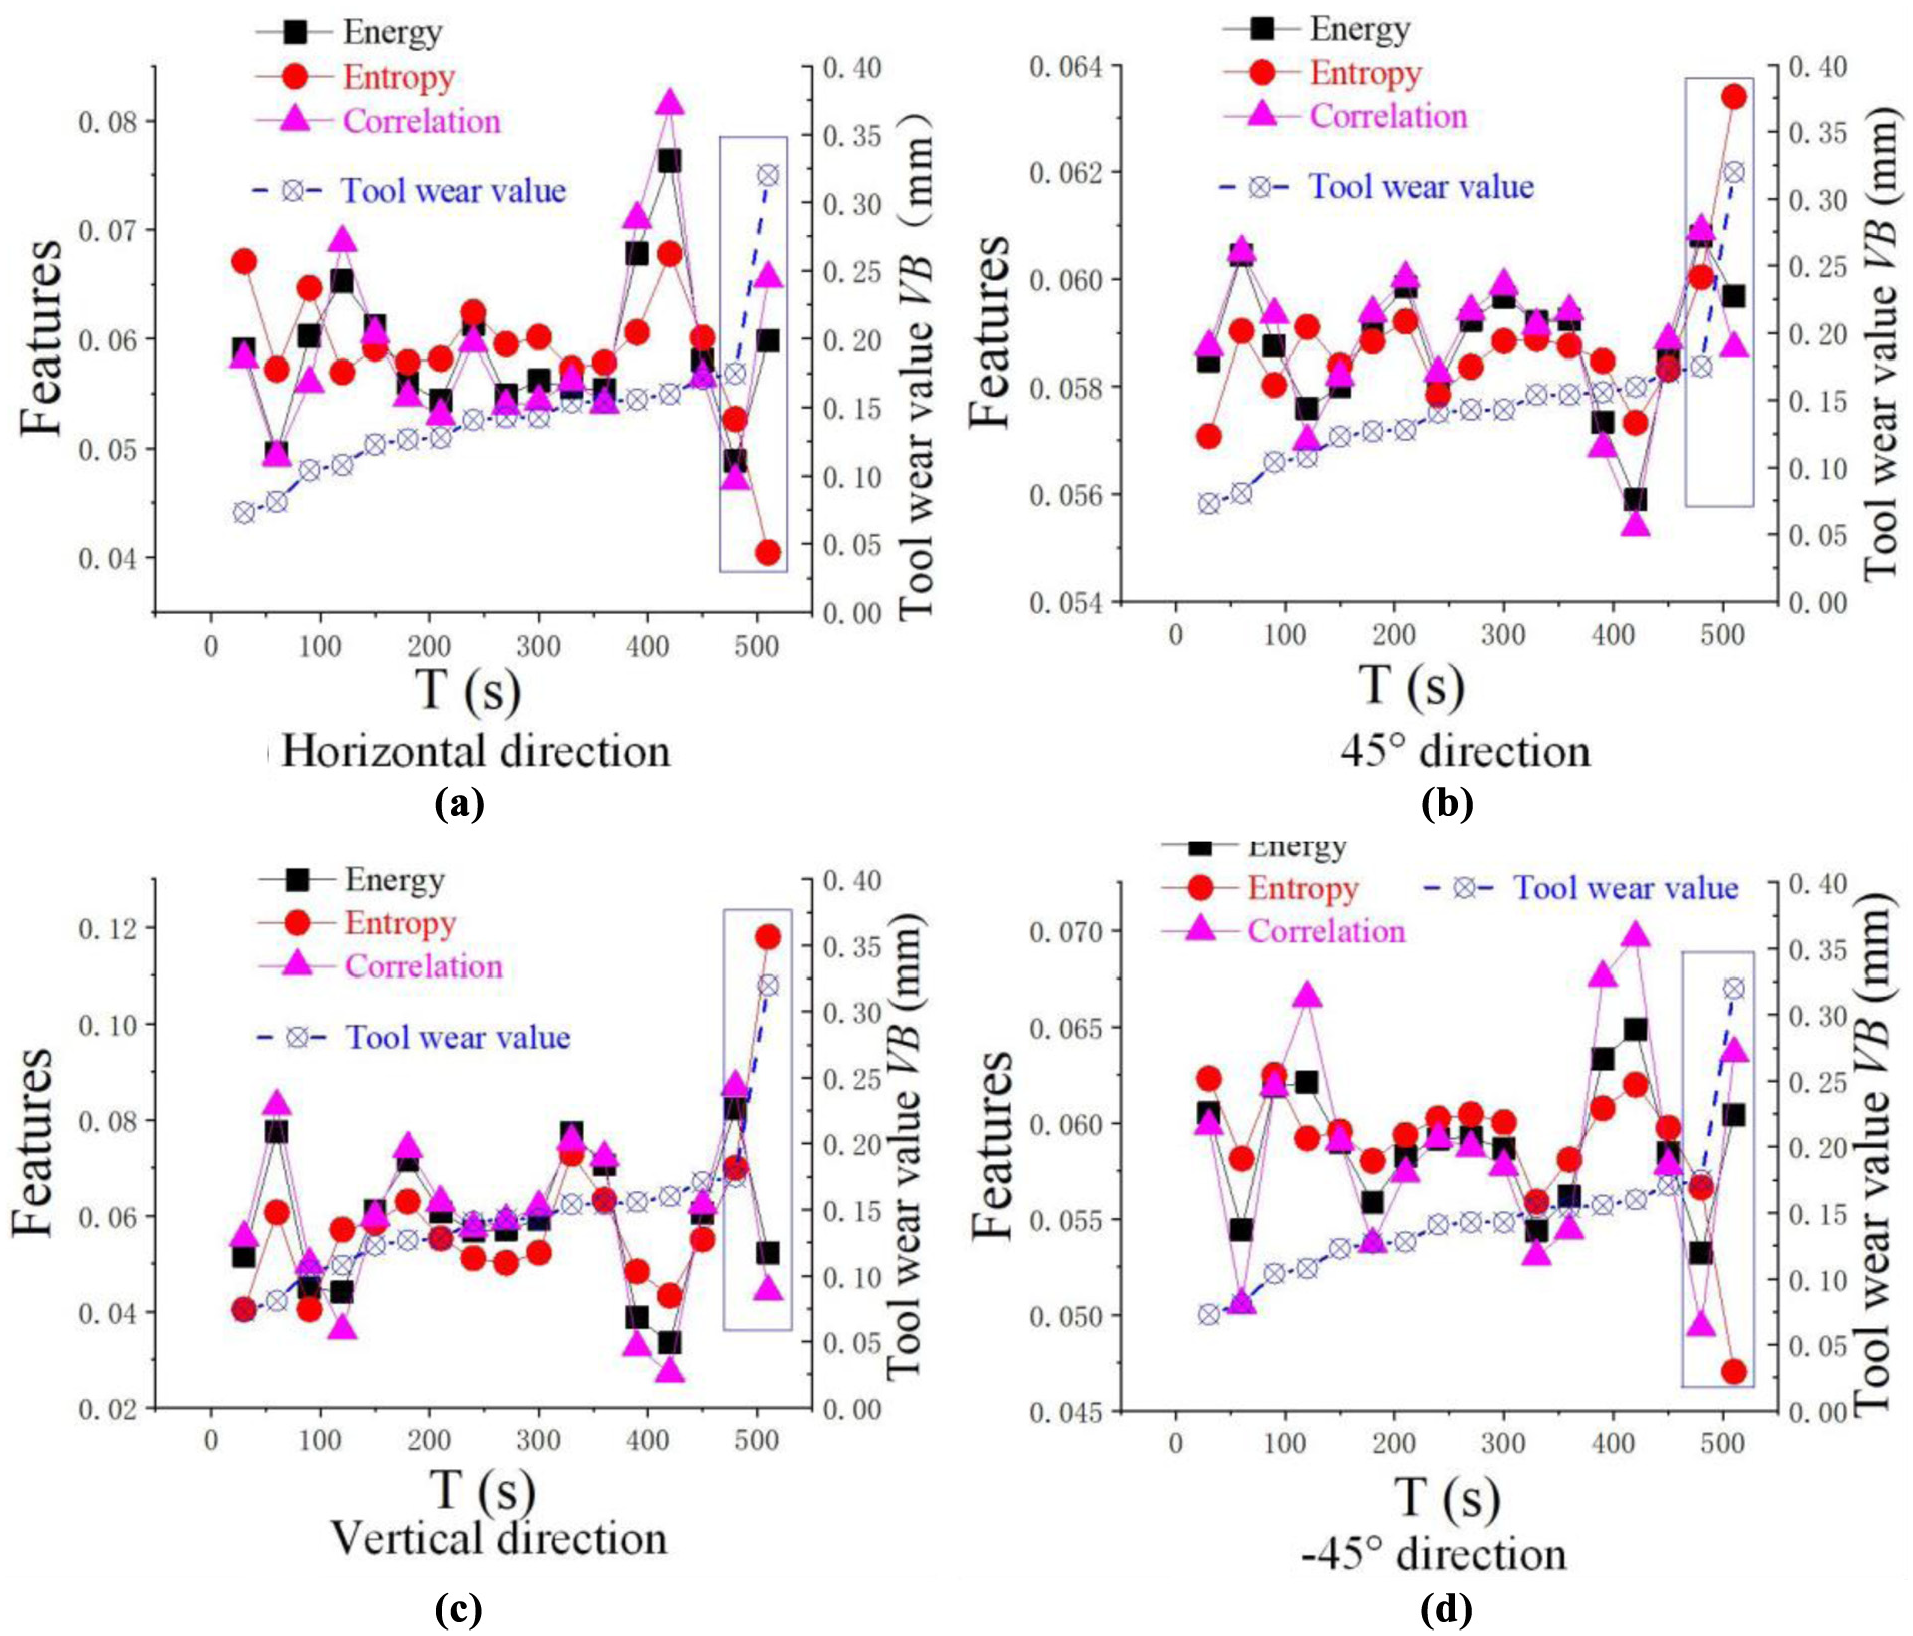
The relationship between energy, entropy, correlation and tool wear.
Description of the feature set
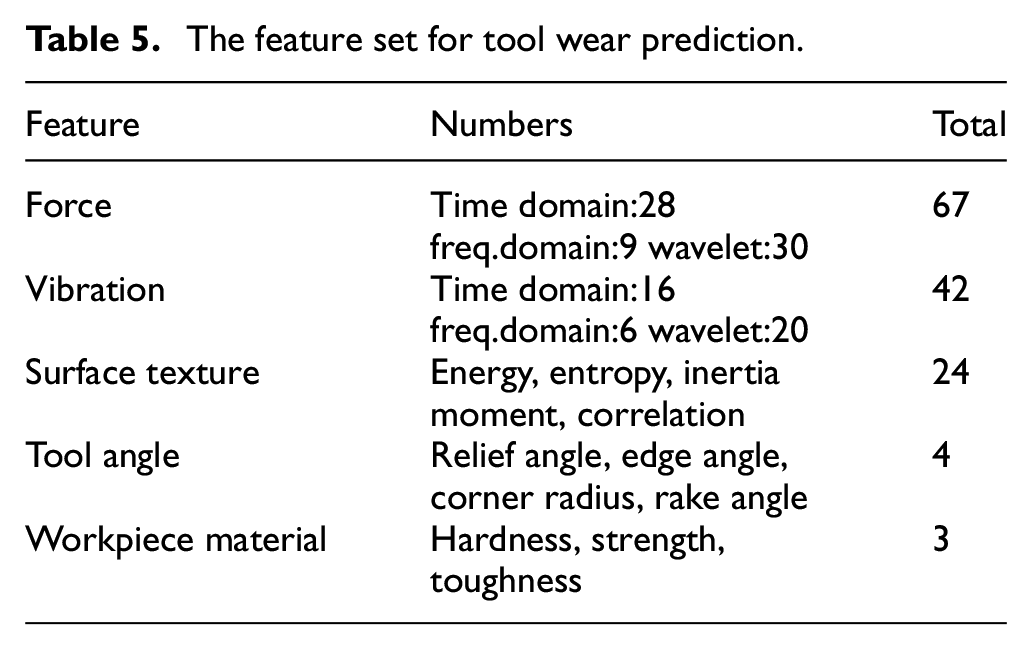
After the features were extracted from the one-dimensional and two-dimensional data above, a total of 133 special features were extracted. Table 5 specifically illustrates the features used to achieve tool wear prediction. There are 28 time-domain features, 9 frequency-domain features and 30 time-frequency features extracted from the cutting force, of which 22 for each directional force and a resultant force. Sixteen time-domain features, 6 frequency-domain features and 20 time-frequency features analyzed by wavelet decomposition were extracted from the vibration signals and the number of the features of the surface texture is 24. There are four features of the cutting tool mainly including the tool rake angle, relief angle, edge angle and corner radius. In addition, the hardness, strength and toughness of materials were included.
The feature set for tool wear prediction.
The machine learning algorithm for tool wear prediction
With the advent of the era of intelligent manufacturing, machine learning algorithms, which perform well in solving classification or regression problems, are rapidly becoming popular. Support vector machine (SVM) is a new type of machine learning algorithm proposed by Vapnik et al. 26 Based on statistical learning theory, the SVM is derived from the principle of structural risk minimization. SVM can automatically find out the support vector which has better ability to distinguish the classification with better adaptability and a higher discrimination rate. Therefore, the prediction model is established by an improved SVM.
Intelligent algorithm implementation process
Given training samples
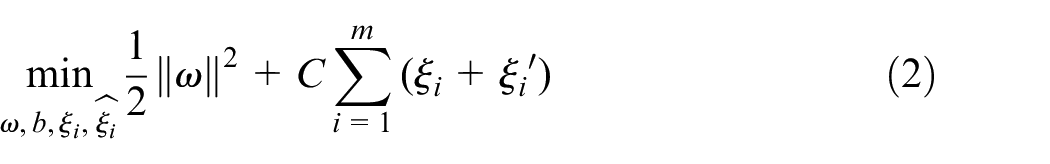
where
Introducing Lagrange multipliers
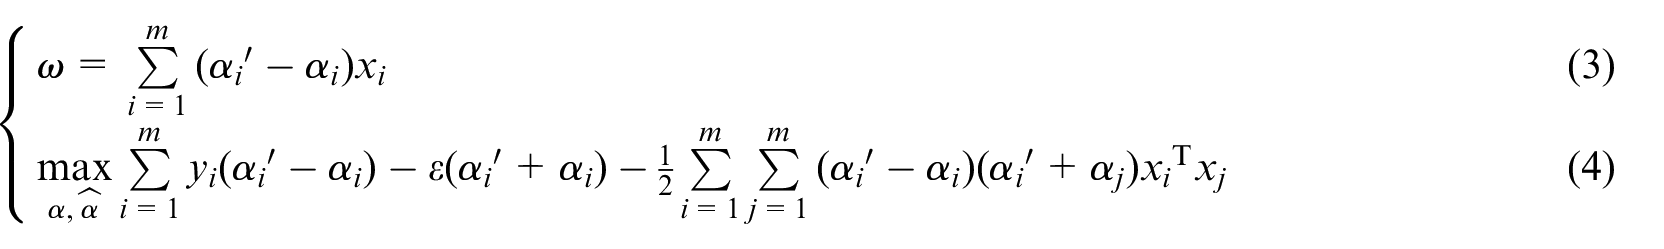
Due to the high dimension of the feature set, the vector x must be mapped. Therefore, the high-dimensional SVR model can be expressed as
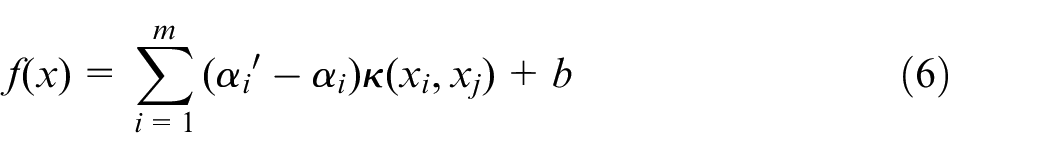
where b is the model parameter and
Parameter optimization
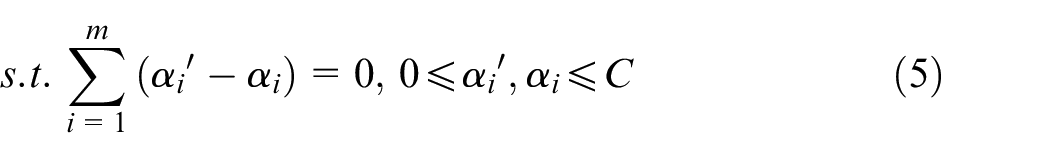
The kernel function solves the difficult problem of vector inner product in high-dimensional space, but the parameters in the kernel function affect the accuracy of the algorithm, such as the
where
Optimization variables:
where
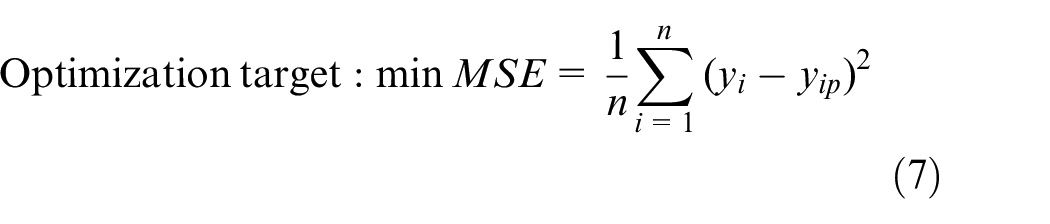
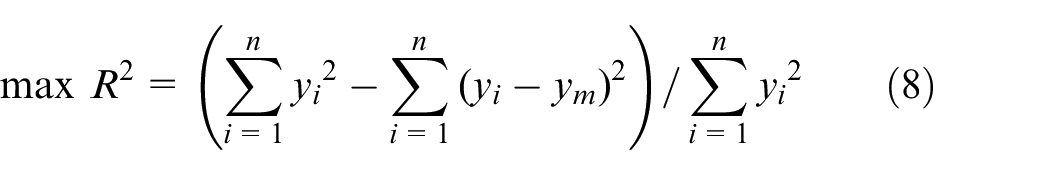
The optimization target is the result of cross-validation. The evaluation parameters of cross-validation result mainly include the mean square error (MSE) and the decision coefficient R2. MSE is the mean square of the difference between the predicted value and the true value. The smaller the MSE is, the higher the prediction accuracy of the model is. R2 is a statistical variable to measure the accuracy of the sample’s predicted value. The range of R2 is 0∼1 and the closer it gets to 1, the smaller the prediction error is.
The optimal parameter combination (
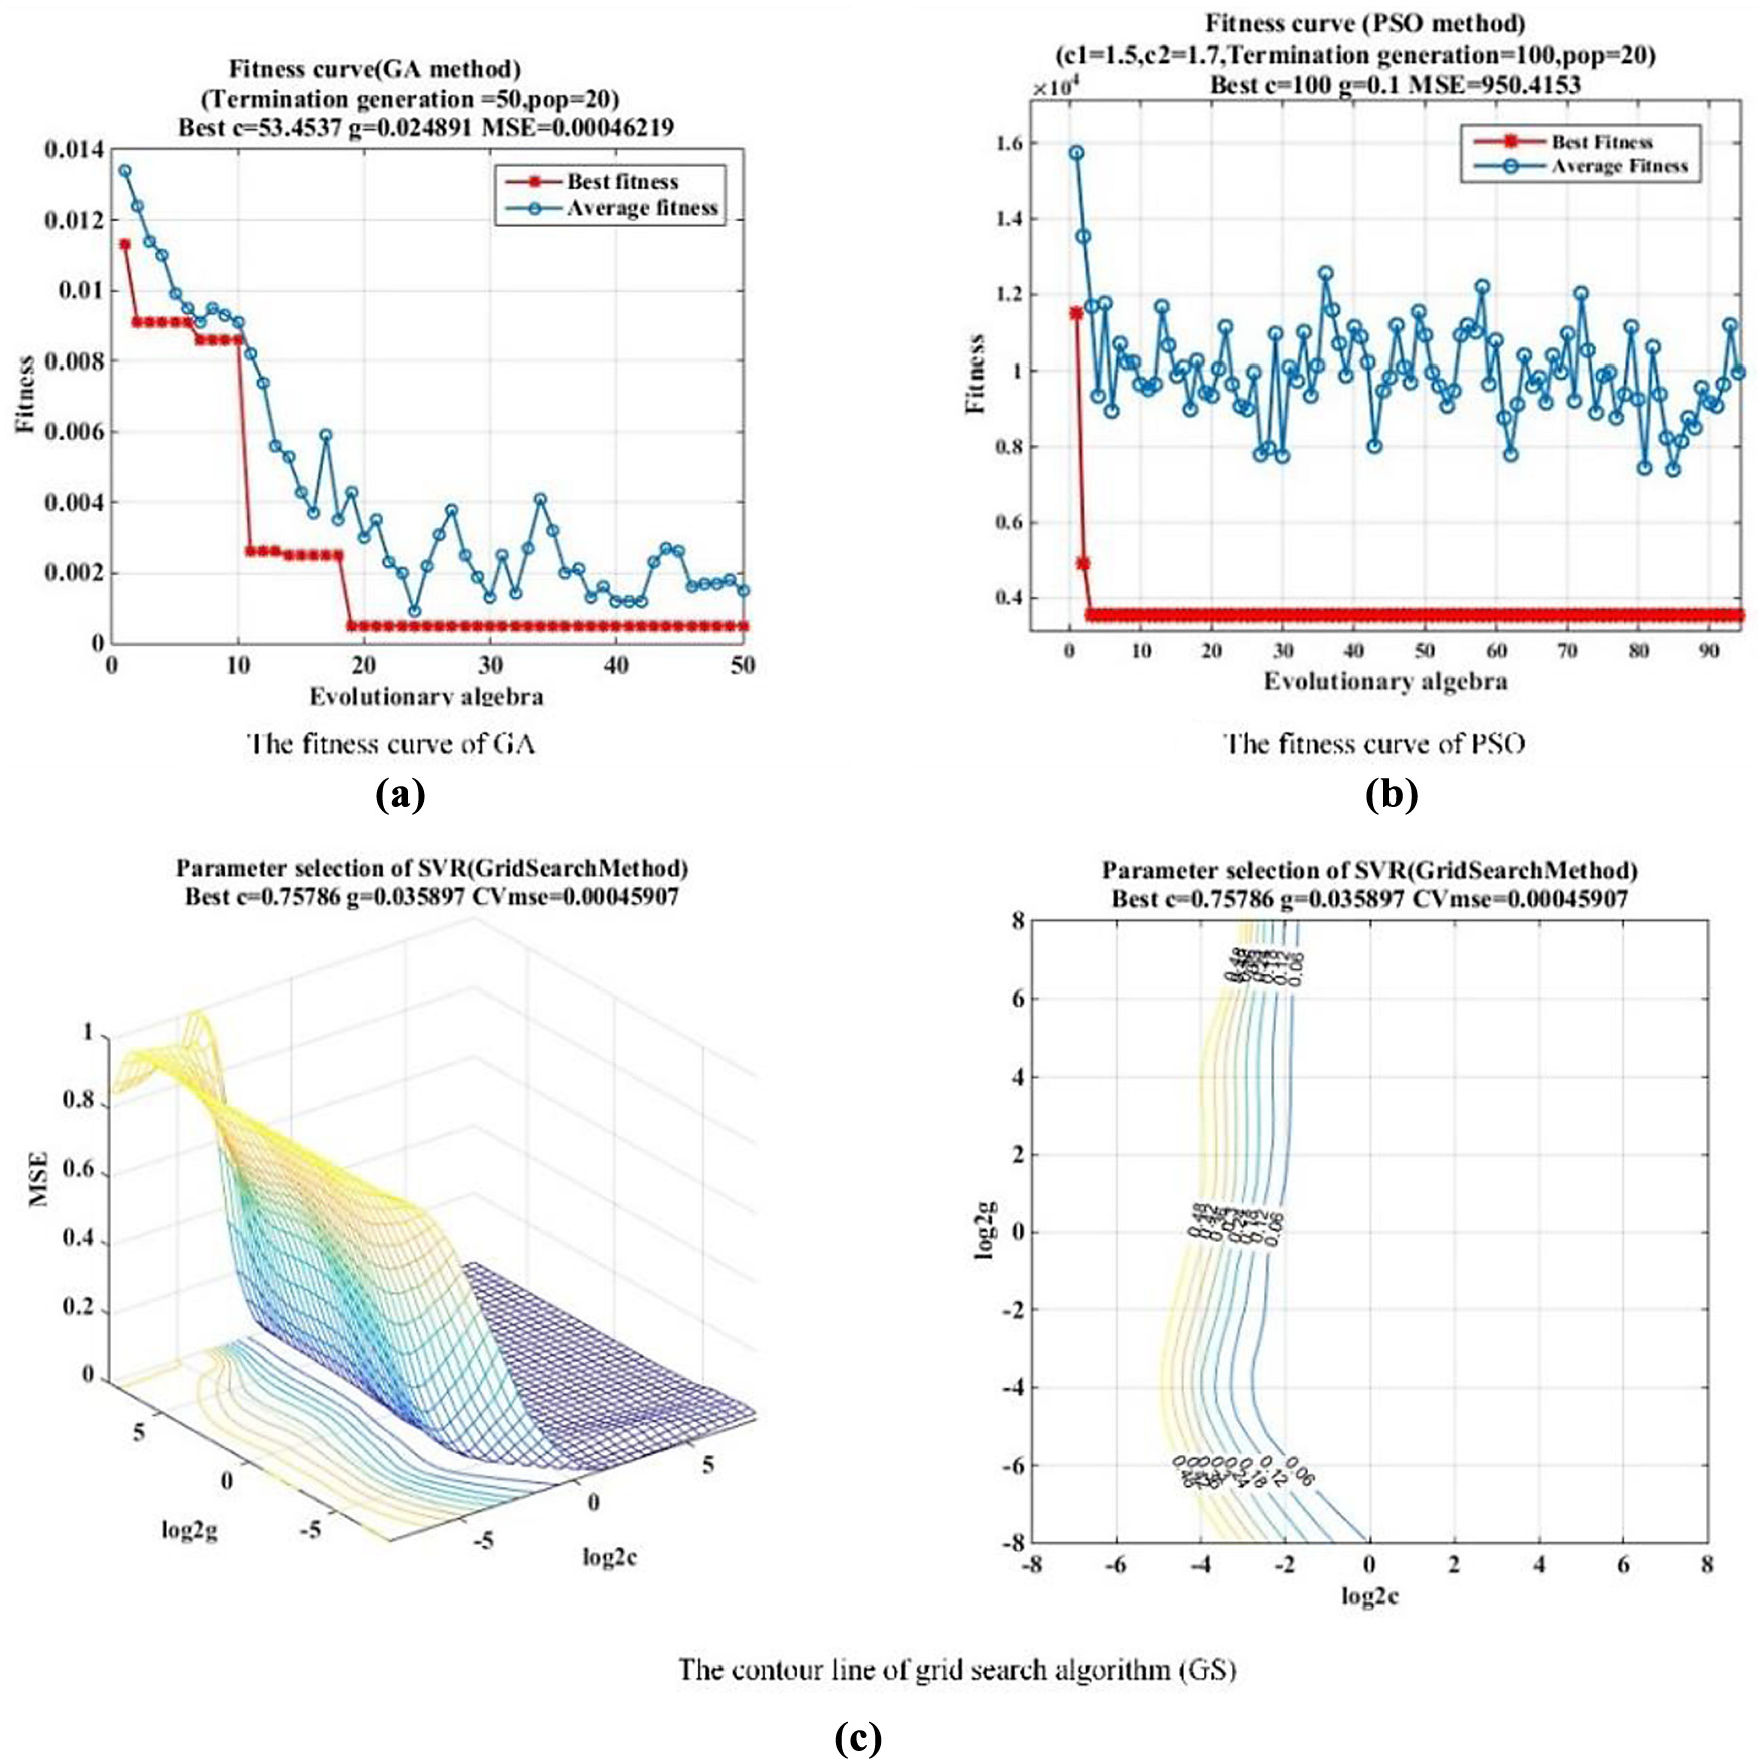
The optimization process of optimization algorithms.
Results and discussion
The effect of surface texture on the tool wear prediction
Previous studies focused on the effect of cutting force or vibration on the tool wear prediction without considering the surface texture. In fact, surface texture most directly reflects the state of tool wear. Therefore, this section researches the effect of surface texture on the tool wear prediction for group 7 experimental data and the results of the study are shown in Figure 11.
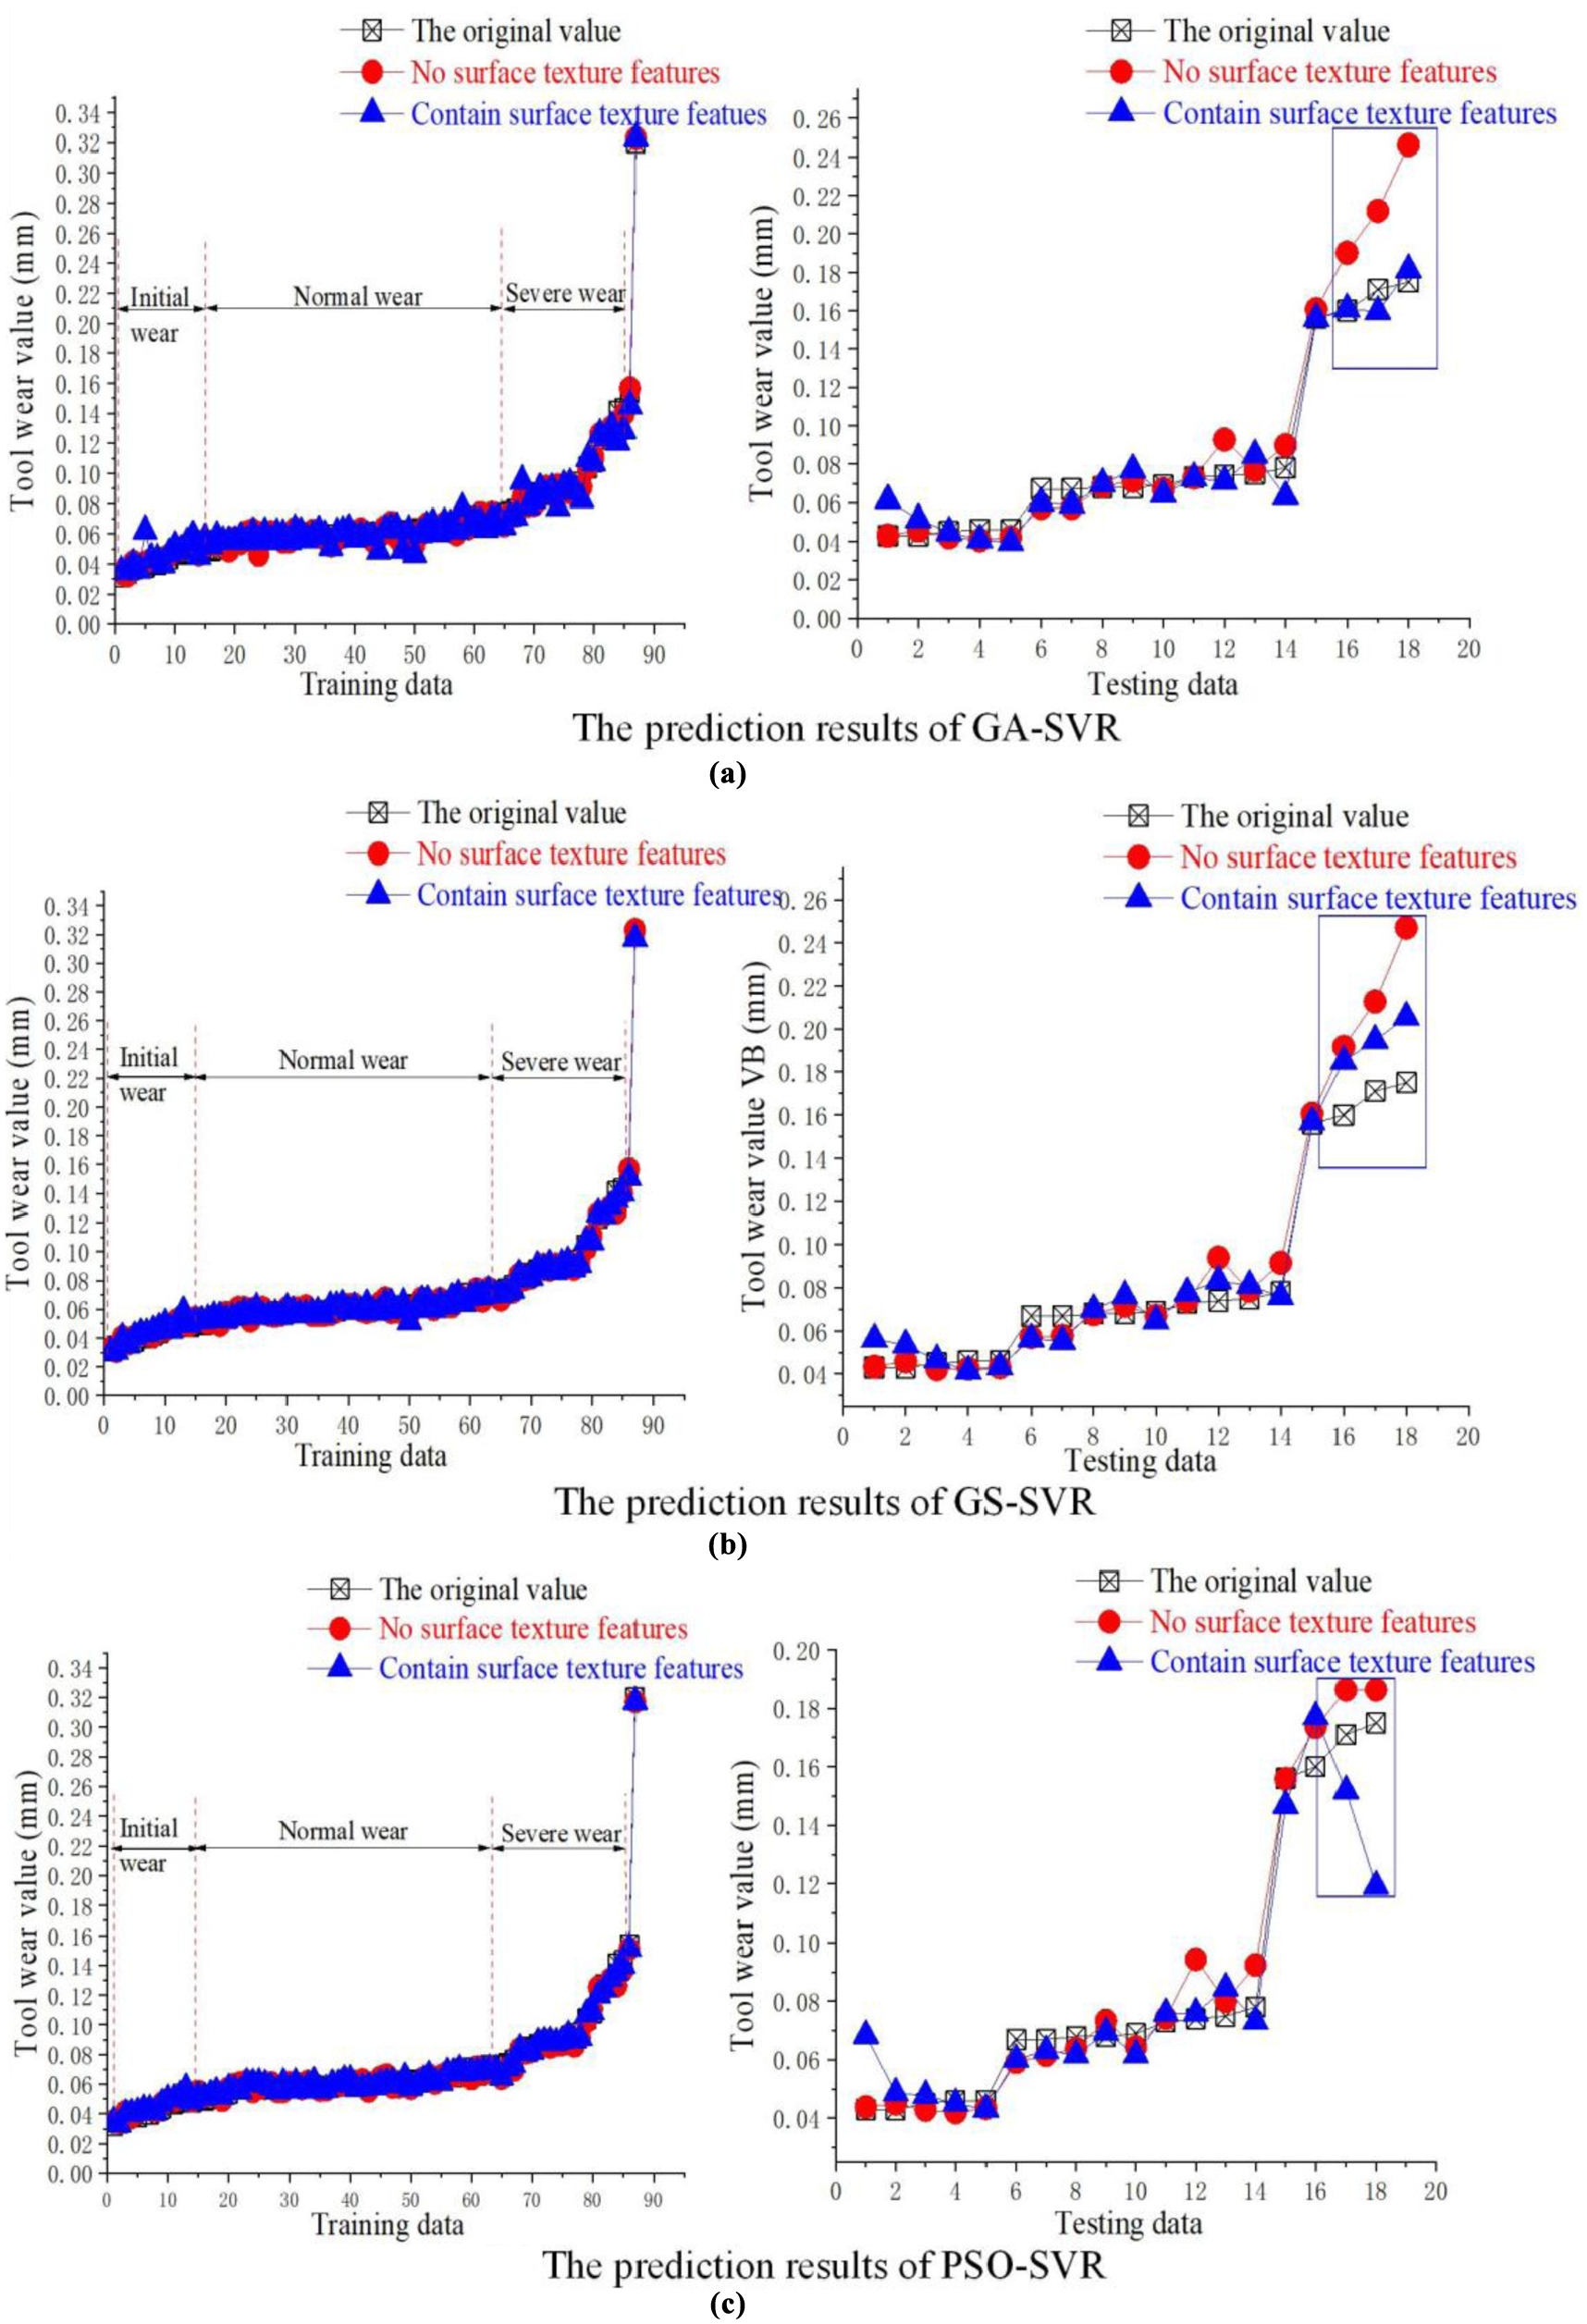
The effect of surface texture on the tool wear prediction under 45CrNiMoVA experimental data.
There are many different methods of partitioning when dividing training and testing sets; the two most common methods of partitioning are the Hold-out method and the cross-validation method where the Hold-out method is used. When using the Hold-out method to divide the data set, it is necessary to determine the proportion of the division in advance. If the training set is too large, the testing set will be too small, and the evaluation result may be less accurate and stable. If the testing set is too large, the training set will be too small, and it is possible that the trained model may produce large deviations. The sample size ratio of the training set and testing set is randomly selected from three different tool wear stages on a scale of 5:1 according to previous studies. 33 As can be seen from Figures 11(a) and (b), the accuracy of the tool wear prediction is improved after considering the features of the surface texture. When the feature amount increases, the PSO algorithm is prone to fall into a local optimal solution, so the prediction accuracy is slightly poor, as shown in Figure 11(c). The specific prediction accuracy is shown in Table 6. The meaning of MSE and R2 is referred to the section - The machine learning algorithm for tool wear prediction.
The prediction results of testing data.
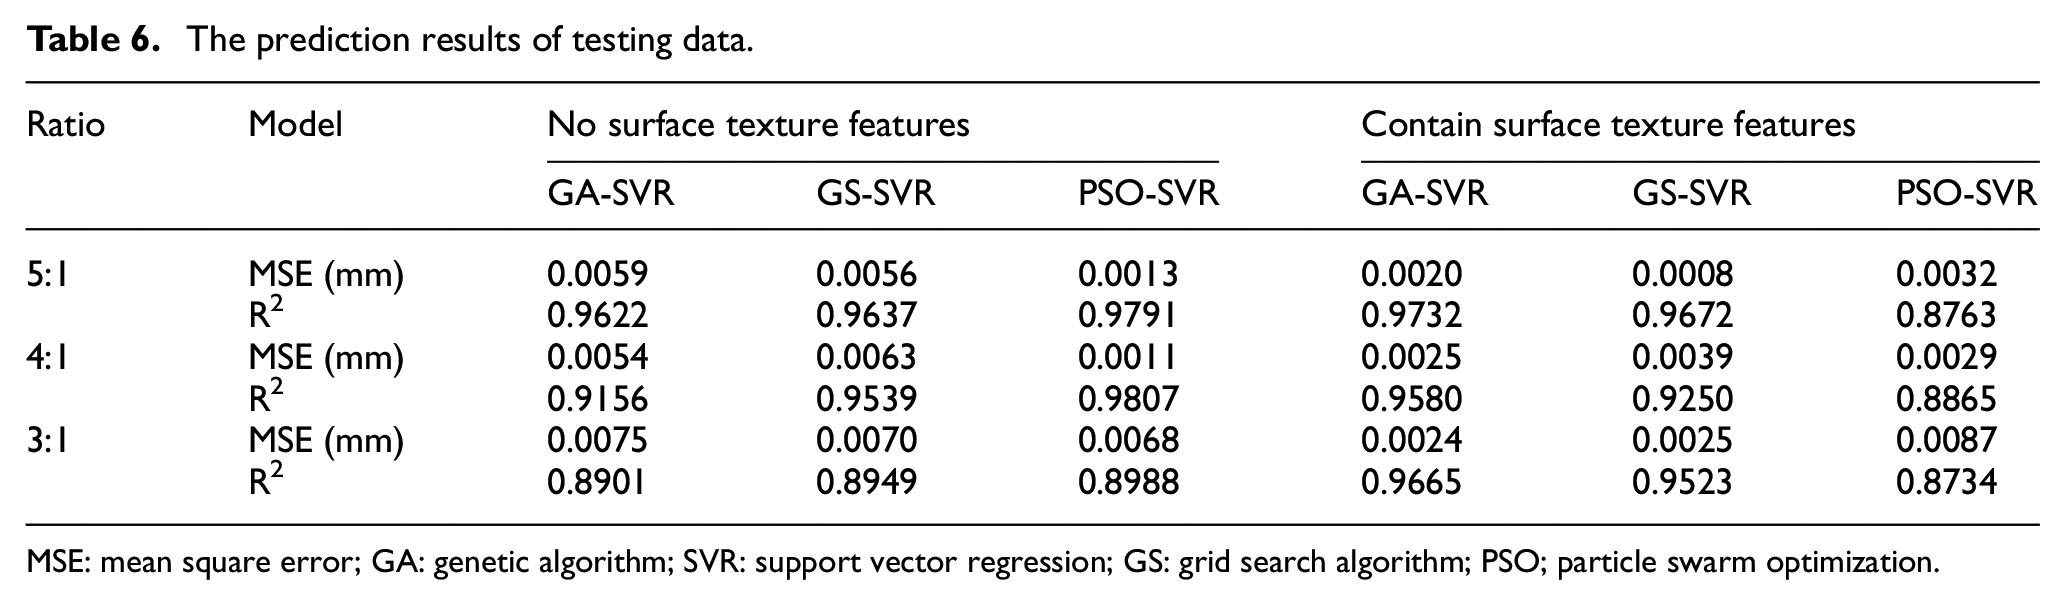
MSE: mean square error; GA: genetic algorithm; SVR: support vector regression; GS: grid search algorithm; PSO; particle swarm optimization.
From Table 6, it can be seen that when considering the features of the surface texture, the MSE is reduced by 60% and 85% respectively under the two prediction models of GA-SVR and GS-SVR. The prediction accuracy of tool wear values has been greatly improved. Although the prediction error of PSO-SVR is increased, it is about 45% smaller than that of GA-SVR and GS-SVR without considering the surface texture features.
In order to study the influence of different dataset ratios on the prediction results, the dataset was divided into 3:1 and 4:1 ratios.34,35 The prediction results on the testing set are shown in Table 6. When the sample size ratio of the training set and the testing set is 3:1 and 4:1, the effect of the surface texture features on the prediction results is similar to the case where the sample size ratio of the training set and the test set is 5:1. The MSE decreases to varying degrees under the two prediction models of GA-SVR and GS-SVR and the MSE is slightly increased under the prediction model of PSO-SVR. From the overall analysis, when the sample size ratio of the training set and the testing set is 5:1, the prediction results of the model are the best.
Tool wear prediction under different cutting conditions
In this experiment, even if the cutting tools and materials are changed, the established tool wear prediction model can achieve accurate prediction. Therefore, different tool wear experiments were performed under different cutting parameters, cutting tools and workpiece materials. The cutting conditions are shown in Table 2. A series of cutting experiments were carried out and the corresponding cutting signals and tool wear value were obtained. The features extracted from the signals and surface texture under different cutting conditions were put together forming a feature set which was used to training the prediction model and the training and prediction results were examined by 10-fold cross-validation method. SVR was used to predict VB values in the order of magnitude by mm. The optimized C and γ values and the MSE and R2 of each prediction model are shown in Table 7.
Optimization results and prediction accuracy.
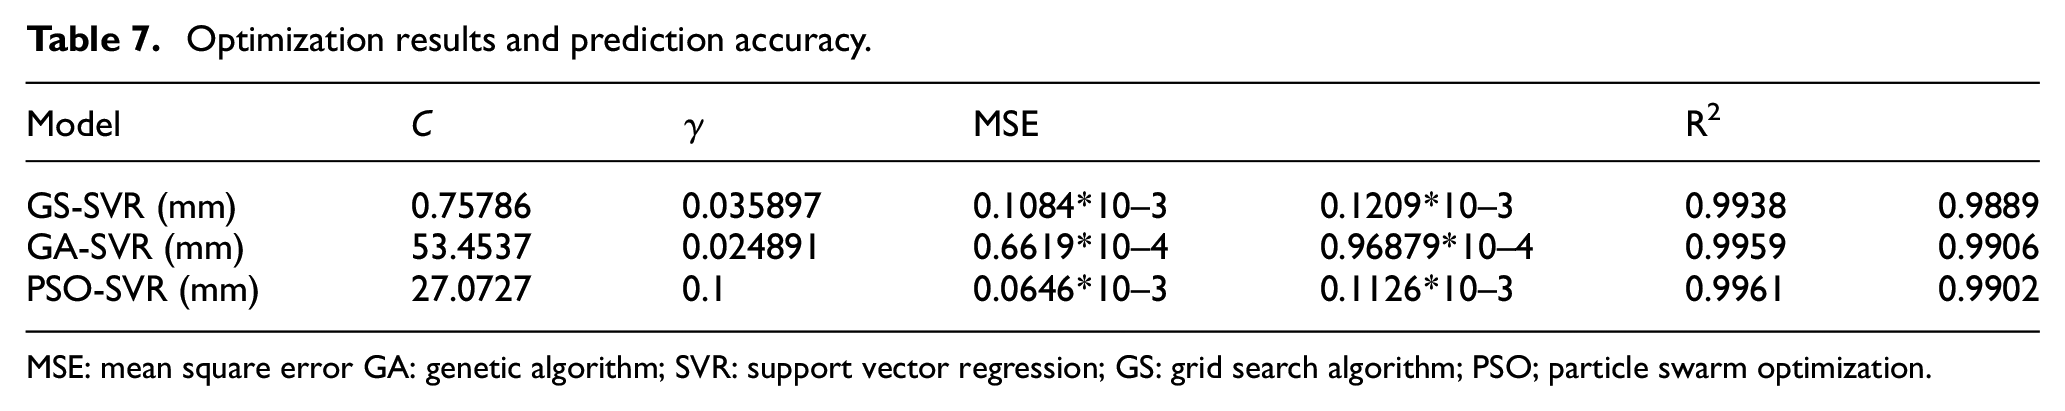
MSE: mean square error GA: genetic algorithm; SVR: support vector regression; GS: grid search algorithm; PSO; particle swarm optimization.
Figure 12 shows the tool wear prediction results for experiments 3, 5, 6, 8 and 9. Because the cutting tool and cutting parameters used are different as shown in Table 2, so the sample size of each group of experiments is different. It can be seen that the training curve and the prediction curve are well fitted, which proves that the intelligent prediction model can realize the accurate prediction of tool wear under different workpieces and different parameters.
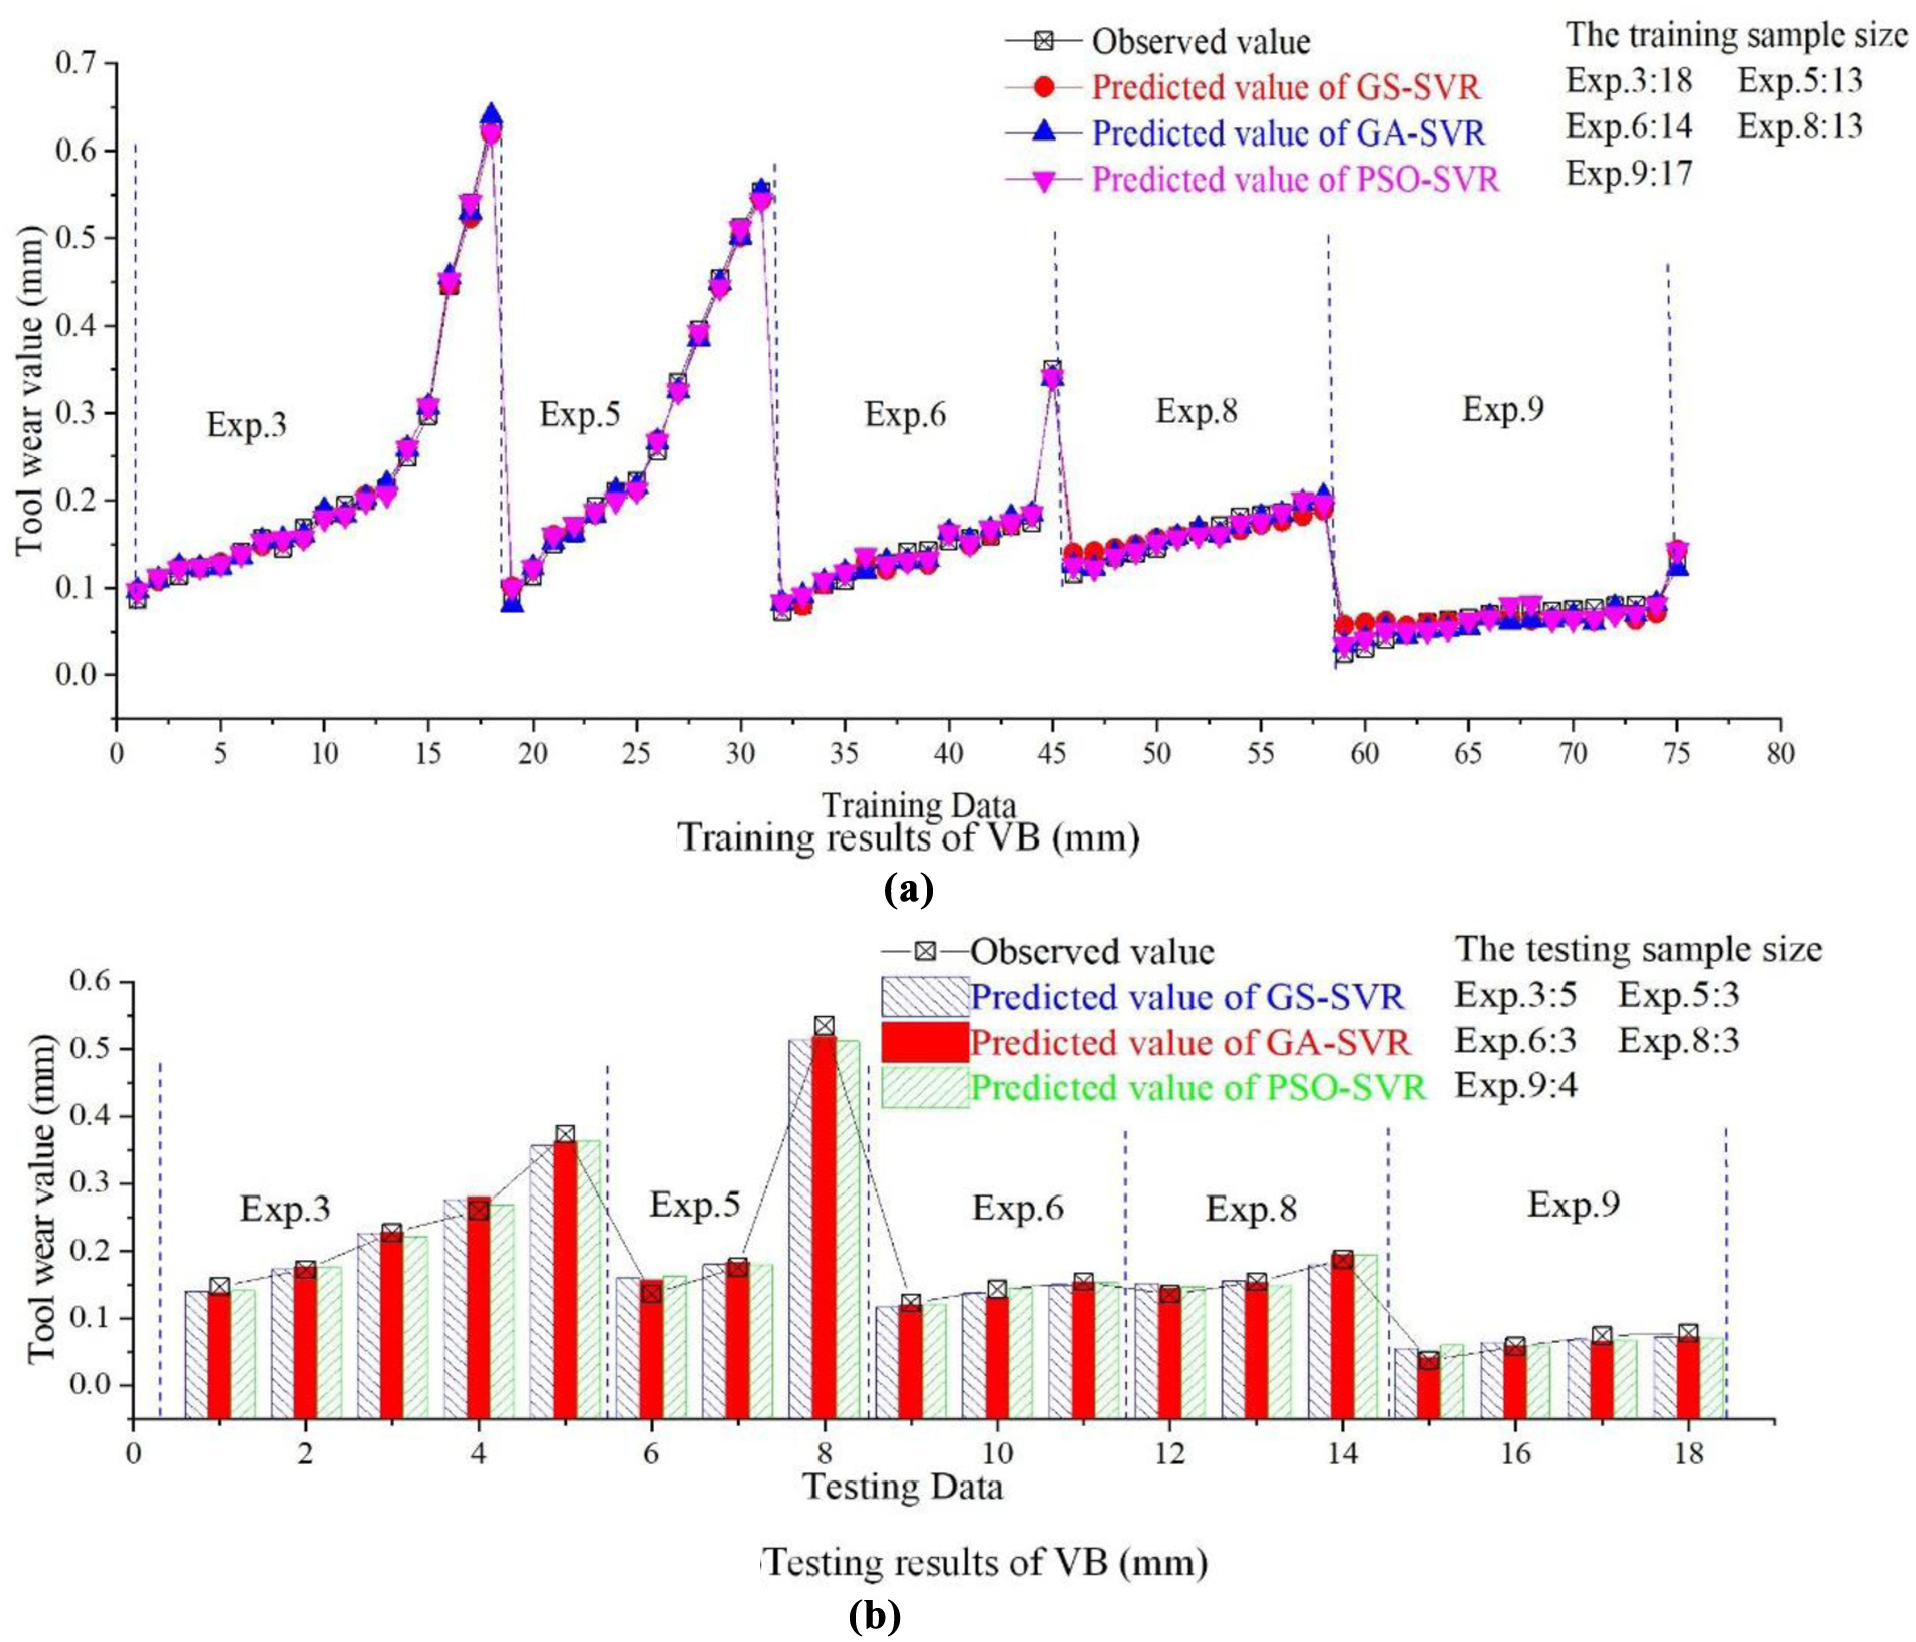
In millimeter, the results of the training data and the testing data.
Figure 12 shows the training and testing results on the order of millimeter, and the VB curves obtained by the GA-SVR and PSO-SVR fit better. Moreover, the MSE values are smaller and the R2 of the training set and the prediction set are both greater than 0.99. The prediction accuracy of GA-SVR and PSO-SVR is higher than GS-SVR and the average error obtained by the GA-SVR and PSO-SVR is better than GS-SVR algorithm. The minimum error of the three optimization algorithms is consistent, both below 1 μm. The maximum error obtained by GA-SVR and PSO-SVR is obviously less than GS-SVR model and the average error for the training set and testing set are less than 9 μm. The training and prediction errors of different models on the order of millimeter are shown in Table 8.
Training and prediction errors under different optimization algorithms.
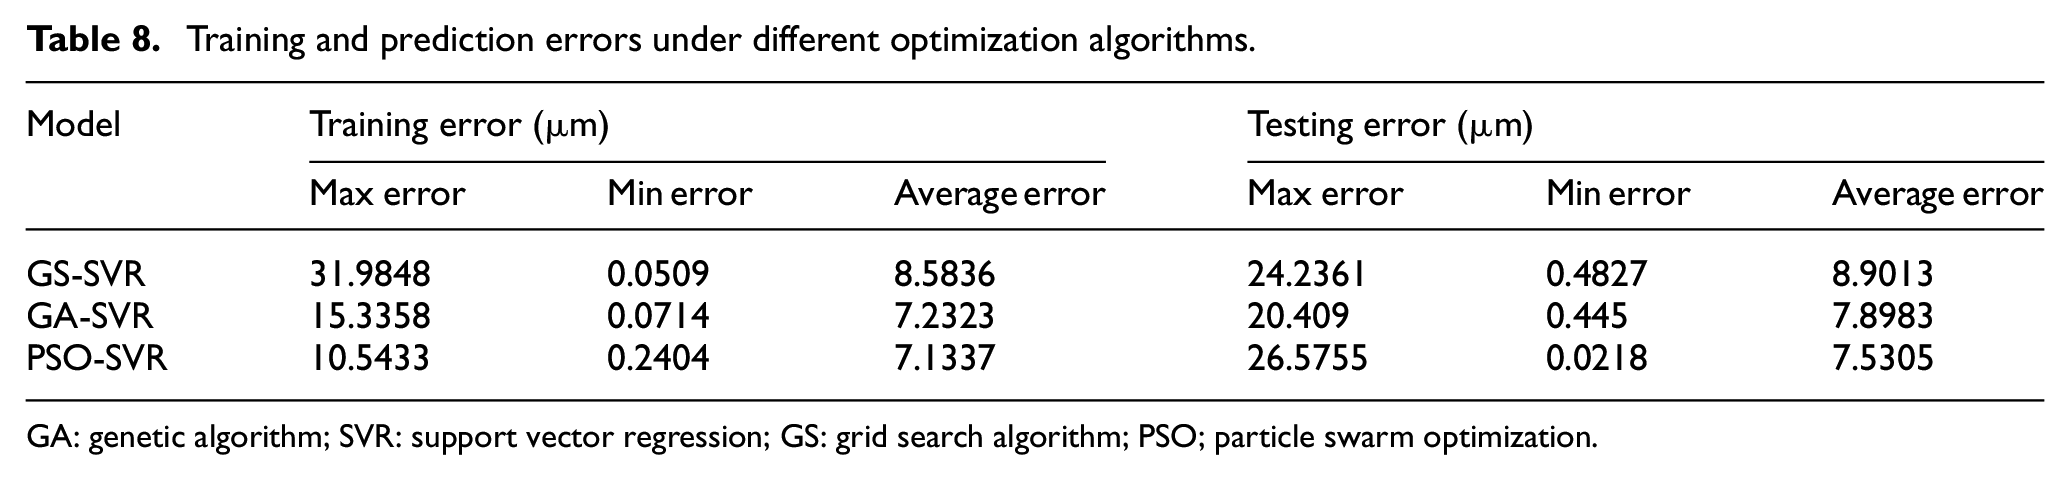
GA: genetic algorithm; SVR: support vector regression; GS: grid search algorithm; PSO; particle swarm optimization.
Through research and analysis, it is found that the accuracy of the prediction model is very high in the article. In addition, the processing time of the proposed method is about 15 s lower than the sampling time (30 s) of the tool wear value in this article, which can ensure that the collected data is processed in time. Therefore, the prediction model can be applied to turning operations in industrial machining to monitor the wear state of the cutting tool in real time, then the badly worn tool could be replaced timely and the products with high surface quality are produced. On the other hand, the intelligent prediction model may be used in the intelligent cutting database to build a detection platform about the tool wear state.
Tool wear prediction for a single wear cycle
It has been demonstrated that the SVM algorithm can establish an accurate prediction model to monitor the value of tool wear. This section is based on group 9 experimental samples. The process of tool wear is divided into the initial wear stage, the normal wear stage, the severe wear stage and from normal to severe wear transition stage.
Five sample points are randomly selected from the normal wear stage, and all the sample points in the transition phase are extracted to form a prediction set. The other samples are training sets for training and the training and forecast results are shown in Fig 13.
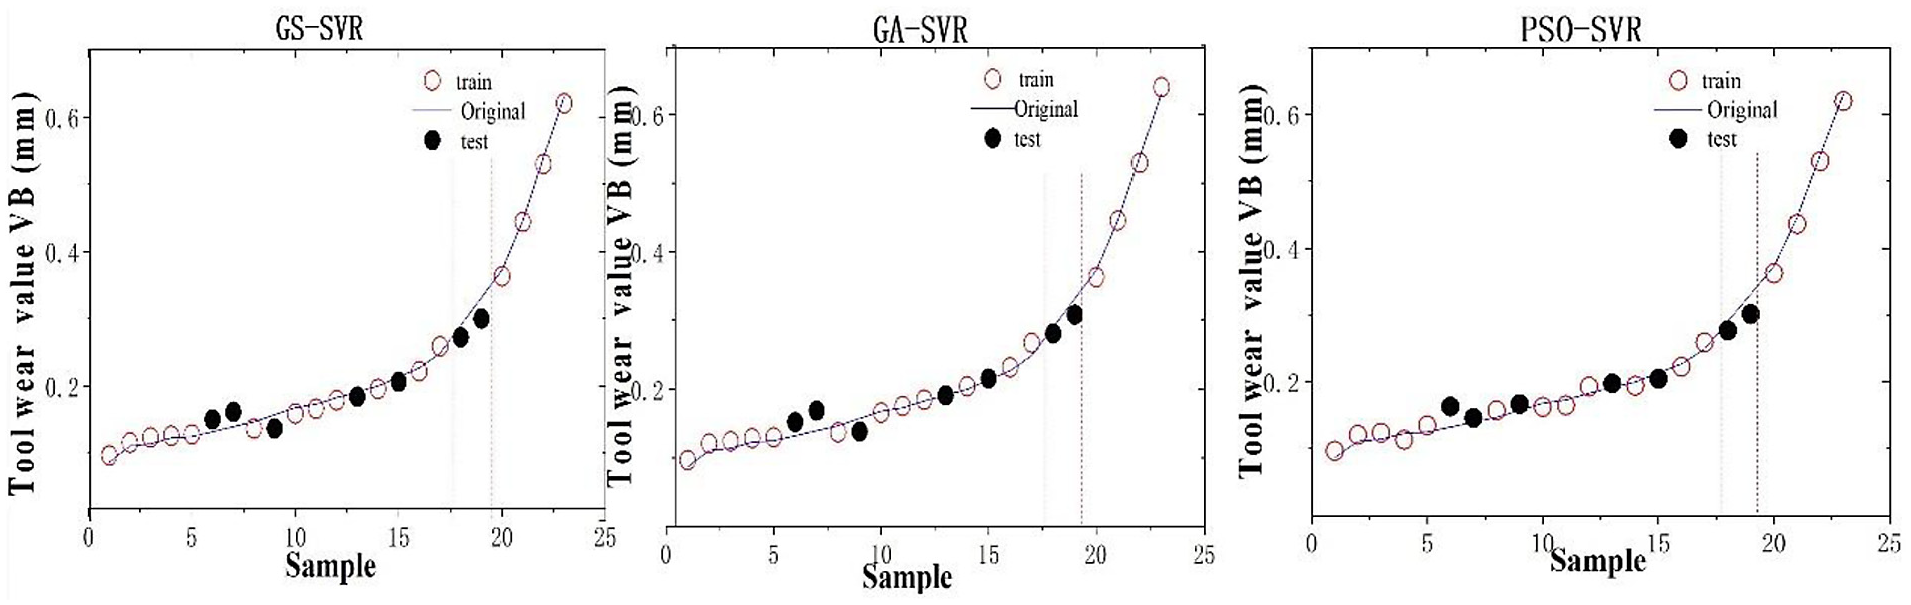
Training and testing results of experiment 9.
Figure 13 shows the prediction results of experiment 9 using the SVR intelligent prediction model. The hollow circle represents the training samples and the solid circle represents the predicted samples. The training and prediction values are shown in Table 9. The interval between the dashed lines is the transition stage from normal wear to severe wear. Five points were randomly selected during the normal wear stage and the points of the transition stage were used for prediction, and the other points were used for training. As can be seen from Figure 13, the SVR model can achieve accurate prediction both in the normal wear stage and the transition stage. Among them, the PSO-SVR prediction model has the highest accuracy, the absolute error of the normal stage is about 9 μ m and the absolute error of the transition stage is about 10 μm.
Training and testing results of experiment 9.
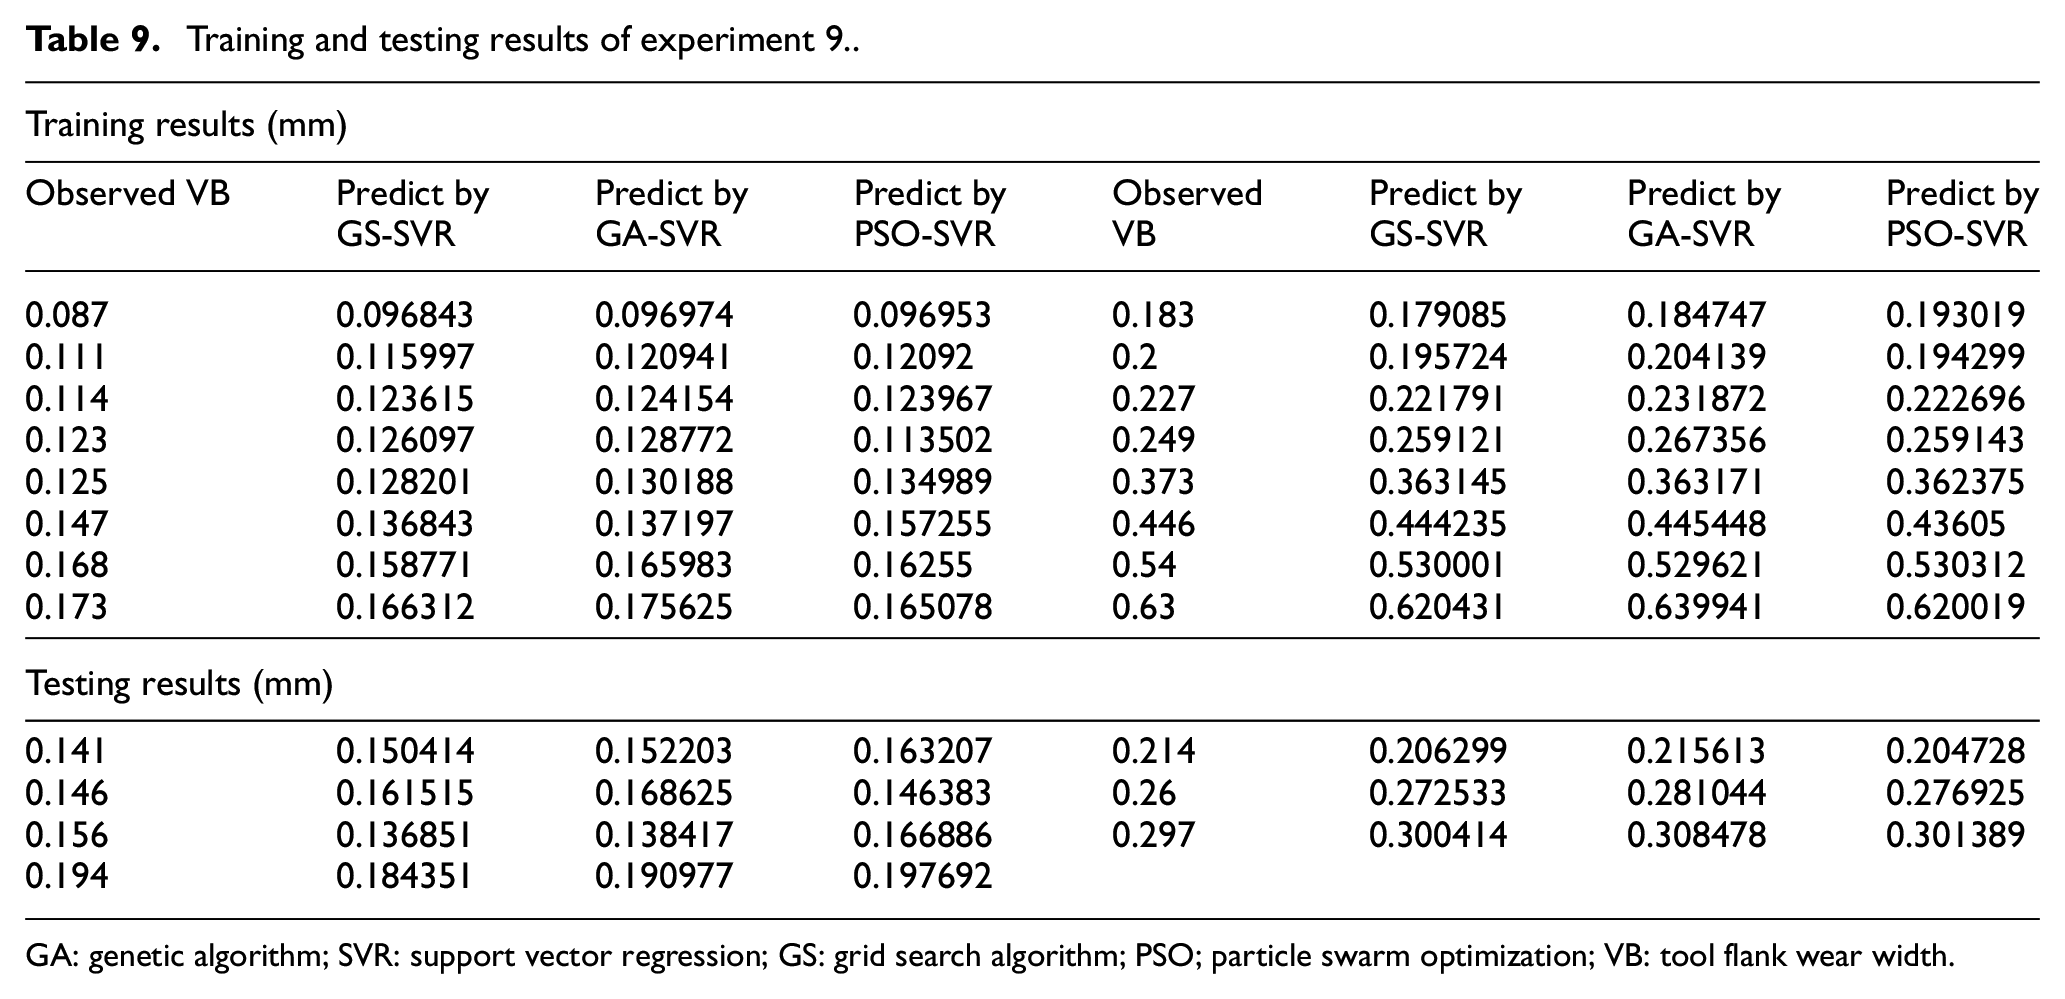
GA: genetic algorithm; SVR: support vector regression; GS: grid search algorithm; PSO; particle swarm optimization; VB: tool flank wear width.
In the actual production process, when the tool wears to the transition stage, the SVR prediction model can accurately predict the tool wear value. Thus, the tool failure probably is predicted in advance and the operator can replace the tool timely by using this intelligent prediction model to avoid the failure of the parts, machining stagnation and other issues due to tool failure.
Although the prediction accuracy of this intelligent prediction algorithm is very high, some factors are not considered. The tool will not only be affected by the workpiece material, cutting force and vibration but also by the heat of cutting. However, due to experimental conditions, cutting heat cannot be collected. Therefore, the influence of cutting heat on the tool should be taken into account in the future.
Conclusion
A methodology based on multi-sensor fusion and machine learning algorithm is developed for TCM and predicting tool wear under different cutting parameters in turning high strength steel. Principally, the key aim of the proposed research is to predict the value of tool wear using SVR whose kernel parameters are optimized using different optimization algorithms, mainly including GS, GA and PSO algorithm. What’s more, the surface texture of machined surface was collected and the main features having correlation with the cutting tool were extracted from the surface texture that was used to determine whether the cutting tool has been broken. The main research can be summarized as follows:
The features of surface texture mainly including inertial moment, energy, entropy and correlation were extracted to determine the state of cutting tool and it was found that the quantity of those features changed simultaneously when the cutting tool broke.
Studies have shown that the features of surface texture have an important influence on the tool wear prediction. Based on the cutting force and vibration features, the surface texture features were fused to predict the value of cutting tool and found that when considering the features of the surface texture, the MSE is reduced by 60% and 85% respectively under the two prediction models of GA-SVR and GS-SVR.
Combining machine vision technology and multi-sensor fusion technology, the time-domain frequency-domain and the time-frequency features which were obtained by using wavelet decomposition algorithm were extracted from the cutting force and vibration. Those features and the features of surface texture were fused using SVR whose kernel function parameters were optimized respectively by GS, GA and PSO algorithm. Compared with the traditional prediction methods, it can not only predict the tool wear under different cutting conditions but also the different wear stages in a single wear cycle. The absolute error between the predicted value and the actual value is less than 10 μm and the confidence coefficient of prediction curve is more than 0.99 which demonstrated the intelligent prediction model is reliable to monitor the state of cutting tool.
This article not only has studied the tool wear prediction but also has established a fast and accurate predictive model. Therefore, the prediction model can be applied to turning operations in industrial machining to monitor the wear state of the cutting tool in real time. Due to limited actual conditions, the tool wear condition monitoring model of this article has not yet been used for online real-time monitoring in practical applications. The change of processing environment will affect the prediction accuracy of the model. When a new processing environment appears, the prediction does not match the actual situation well, which leads to misjudgments. Therefore, this article offers guidance to online real-time tool wear monitoring and product applications and future research in real industrial machining environment is needed.
Footnotes
Acknowledgements
The authors acknowledge the financial support from the Natural Science Foundation of China (grant no. 51575050).
Declaration of conflicting interests
The author(s) declared no potential conflicts of interest with respect to the research, authorship, and/or publication of this article.
Funding
The author(s) received no financial support for the research, authorship, and/or publication of this article.