
Abstract
Pattern recognition and feature extraction methods are applied to identify cashmere and wool fibers, which are two kinds of very similar animal fibers. In this article, we proposed a new identification method based on Speed Up Robust Features of fiber images. The images of wool and cashmere fibers are obtained by scanning electron microscopy. Speed Up Robust Features of fiber images are extracted, and each fiber image is regarded as a collection of feature vectors in our logic. The vectors are fed into a support vector machine for supervised learning. The findings from scanning electron microscope images indicate that this method is effective; the recognition rate is higher than 93% for a broad range of blend proportions of the two fibers.
Introduction
The morphological characteristics of cashmere and wool fibers, as well as their physical and chemical properties, are similar; thus, the identification of these two fibers has always been a challenging proposition. Cashmere is more expensive than wool, and thus, it is very important to quickly and accurately distinguish between the two fibers. The artificial detection method is still the most important practical detection method at present, but it usually takes at least a year to train qualified professional testing staff. It is time-consuming and laborious as it requires microscopists to observe the morphology of the fiber under a microscope for a long time, and subjective and the detection accuracy depends on the experience of the microscopists. For many years, researchers have been developing a fast and accurate method for automatically identifying cashmere/wool fibers and have made many useful attempts. Throughout the literature, the methods mainly include (1) optical microscopy and scanning electron microscopy (SEM), (2) near infrared spectroscopy, (3) DNA analysis and (4) image processing and computer vision.1–4 Among the above methods, DNA analysis achieves high accuracy by extracting mitochondrial DNA from the fibers. Then, polymerase chain reaction (PCR) is used for amplification and sequencing the fibers. Cashmere and wool fibers can be identified by their specific base sequences. 4 However, DNA analysis has the disadvantage of being expensive and time-consuming, and it is still far from being widespread.
Methods based on image processing and computer vision are current research hotspots. In the early days, people mainly used image processing technology to measure geometric parameters of fibers, such as fiber diameter, fiber evenness, and so on. Recently, some scholars have begun to use computer vision technology to extract abstract features from some fiber images in order to identify them.5–10 Technically, fiber identification based on surface morphology can be seen as a pattern recognition problem. Shang et al. 5 extracted six characteristics of fibers from fiber images, such as fiber diameter, scale height, and scale projection width, and so on, and used a Bayesian model to classify the fiber images. Zhang et al. 6 extracted texture features from the fiber surface to classify wool/cashmere fibers. An artificial neural network was then constructed to classify these two kinds of fibers. Jiang et al. 7 converted wool/cashmere fiber images into spectral lines and extracted six features. A discriminant method was proposed by analyzing these six parameters. She et al. 8 extracted nine geometric features from fiber images after processing the original images. An artificial neural network was constructed as a classifier, and these features were fed into the classifier to do a classification task. Shi and Yu 9 measured 10 shape parameters of fiber scales from fiber images. A multiparameter Bayes model was established to classify the animal fibers. Ma et al. 10 measured eight characteristic parameters, including scale perimeter, scale area, fiber diameter and the scale rectangularity, and so on, and these parameters were applied to distinguish wool and cashmere fibers.
Instead of calculating the measurement parameters of fiber surface geometry, some scholars extract visible features from fiber images to describe the difference in scale patterns between wool and cashmere fibers. Yuan et al. 11 employed Tamura texture features to describe fiber images and a back propagation (BP) neural network to classify wool and cashmere fibers. Zhong et al. 12 transferred a fiber image into texture blocks, and a projection curve was created based on these texture blocks. To reveal the differences in scale pattern between wool and cashmere fiber, recurrence quantification analysis (RQA) was used to explore the numerical features embedded in the projection curves. A support vector machine (SVM) was employed as a classifier to perform supervised learning.
In the computer image analysis method, many parameters such as circumference and area of fibrous scales are obtained to distinguish between the two fibers. However, these method relies on the quality of images. The research presented here focuses on using electron microscopy to distinguish between wool and cashmere. Optical microscope pictures are easier to obtain than electron microscope pictures, but they have lower resolution. Therefore, subsequent image processing and feature extraction are very difficult. In the experimental part of the article, we compare the recognition effect of the fiber SEM images under different blend ratios and evaluate the crucial parameter, the number of visual words, in the proposed method.
Research methods
In this article, the identification of wool and cashmere fibers was accomplished in three steps. In the first step, the SEM images are preprocessed to remove the image background. In the second step, the Speed Up Robust Features (SURF) features of the fiber were extracted from the image by feature descriptors. Each fiber can be described by a histogram of SURF features. In the third step, a recognition model is built to distinguish between wool and cashmere fibers based on these features. Figure 1 shows the main flow of our algorithm.

The flowchart of cashmere/wool identification.
Sample collection and image preprocessing
Wool and cashmere fibers were collected from Shaanxi, Inner Mongolia and Qinghai. All fibers samples were supplied by the Erdos Group. Fiber images were captured at 1000x magnification via a scanning electron microscope (Hitachi TM3000), under ISO 17751-2-2016 and GB/T 14593-2008. Fiber images were saved in the “jpg” format. There is only one fiber in each image, and each image contains a different fiber. The class of each fiber is known and all fibers (images) have been labeled. The number of fiber images equals the number of fiber samples. The identification of wool/cashmere fibers can be converted into an image classification.
There are some interference factors in the original fiber images obtained by SEM, such as background brightness unevenness, impurities, noise, and so on. Because the information used for fiber identification only exists on the surface of the fiber, we separated the fibers from the image background before feature extraction. The detailed steps are as follows. Figure 2 shows the flowchart for image preprocessing.

The flowchart of image preprocessing.
The detailed steps of image preprocessing are represented as follows. For comparison, the process is shown in Figures 3 and 4 by taking a cashmere fiber and a wool fiber as examples, respectively.
Step 1: Image binarization. Adjust the gray value of the original image and increase the contrast of the fiber area and background. 13 To obtain the skeleton outline of the fiber, Sobel edge detection is performed, as shown in Figures 3(b) and 4(b).
Step 2: Dilation. Detect the intersection of the skeleton area and the edge of the image, and then, dilate the fiber edge to get a closed fiber area (Figures 3(c) and 4(c)).
Step 3: Filling margin. Use the mathematical morphology to fill the holes in the fiber (Figures 3(d) and 4(d)).
Step 4: Removing noise. The fiber area parameter is used to remove remaining noisy regions to get the final segmented image (Figures 3(e) and 4(e)).
Step 5: Removing background. Use the segmented image to remove the background in the original image, as shown in Figures 3(f) and 4(f).
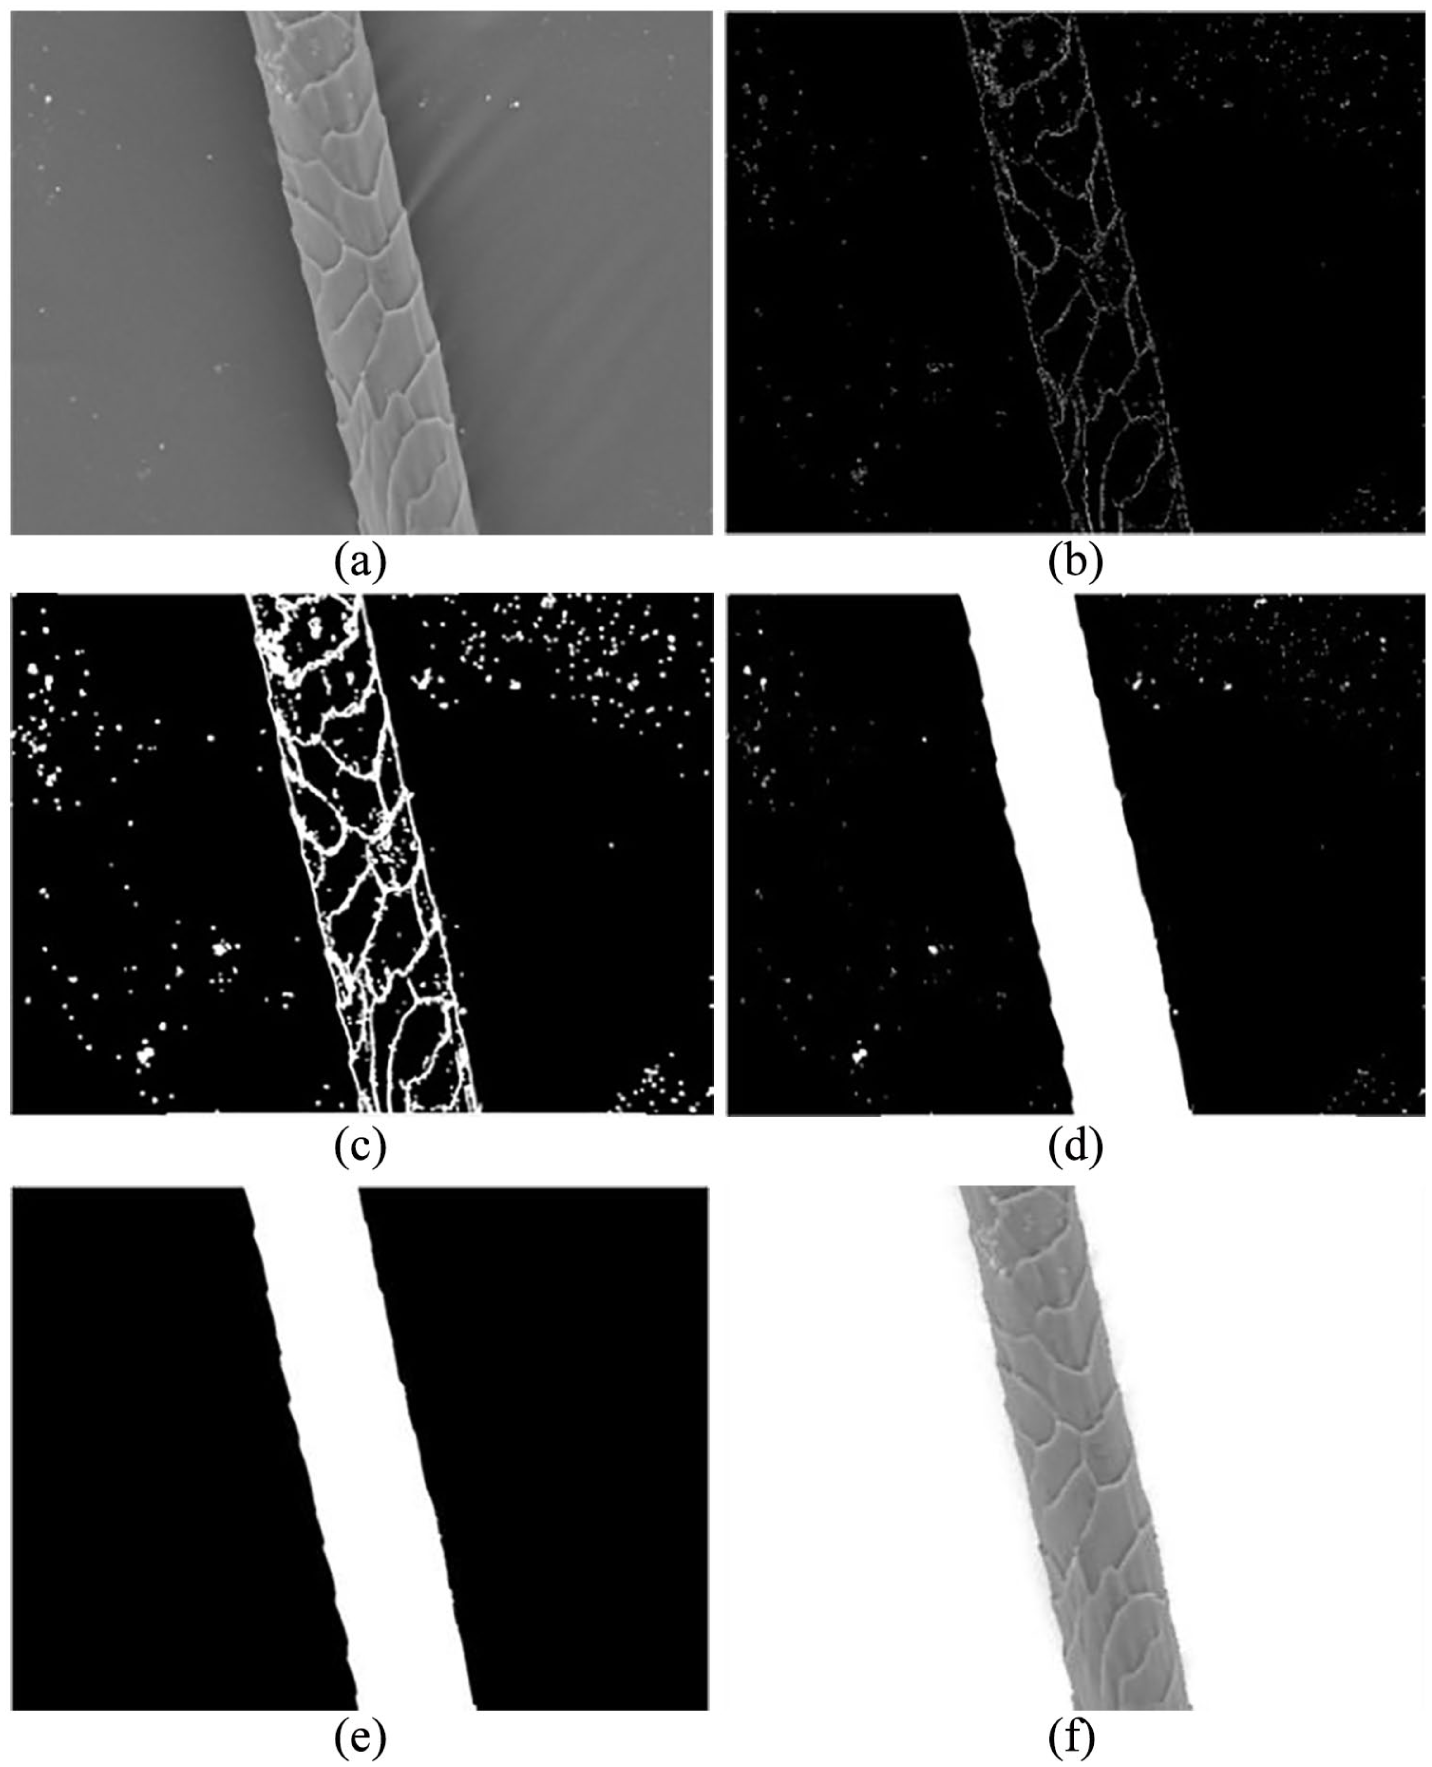
Wool SEM image preprocessing: (a) original image, (b) image binarization, (c) dilation, (d) filling margin, (e) removing noise, and (f) removing background.

cashmere SEM image preprocessing: (a) original image, (b) image binarization, (c) dilation, (d) filling margin, (e) removing noise, and (f) removing background.
SURF feature extraction
Computer image processing attempts to detect the stable characteristics of certain kinds of images using an algorithm. The SURF algorithm proposes a solution which can find the key points inside a certain type of image such as corner points, edge points, and highlight points and then distinguish between the different types. 14 This algorithm uses the integral image to speed up the feature acquisition, and the Hessian operator is employed. At a point X of the image, the Hessian matrix at scale σ is

where
The whole process consists of four steps: (1) compute the integral image, (2) create a scale space for the image, (3) locate feature points in the scale space established, and (4) feature point representation. The results of the above method are shown in Figure 5, and the circles represent the SURF features extracted.

SURF feature extraction: (a) features extracted from the original image of wool fiber, (b) features extracted from the processed image of wool fiber, (c) features extracted from the original image of cashmere fiber, and (d) features extracted from the processed image of cashmere fiber.
Build visual word histogram
Because the amount of data extracted from the previous step is huge, this article uses a k-means clustering method to process it. With this scheme, the computation of the later algorithm is reduced. Then, each cluster center is mapped into a visual word, and the two-dimensional pixel information in the image is transformed into a visual word that is easier to categorize. Given an extracted SURF feature set, k-means clustering method generates a k cluster center

Where M and K represent the total number of SURF characteristics and cluster centers, respectively. X represents the SURF features, and U is the center point of clustering. The number of clustering centers K is an important parameter. It not only affects the efficiency of the clustering operation but also affects the descriptive ability of visual words, and the accuracy of image recognition. The selection of the number of visual words is discussed in subsequent experiments.
The central point of clustering

Visual word histogram: (a) visual word histogram of wool fiber and (b) visual word histogram of cashmere fiber.
Intuitively, the difference between cashmere and wool fiber cannot be found on the visual word histogram. Next, we will try to use the SVM classifier to distinguish the difference between the visual word histograms of cashmere and wool.
Classifier
SVM is a kind of supervised learning theory, that is, useful for small samples and high-dimensional data classification problems, and it is widely applied to various model classification algorithms. 16 The basic idea is shown in Figure 7, in which circles and triangles represent two types of objects. After analyzing the labeled data sets, we get an optimal classification hyper plane

Which can be used to separate the two training samples. Here, x represents the data point, and ω is the n-dimensional eigenvector. In the process of fiber classification, T is the frequency vector of words extracted from each image.
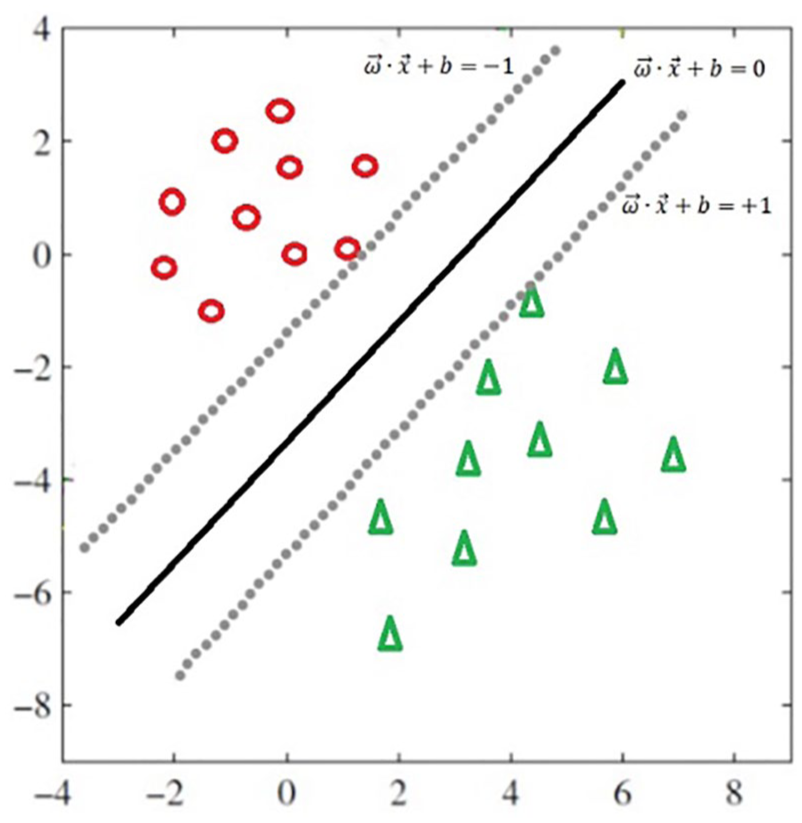
SVM classification schematic.
A mapping function is first used to map the original sample to a higher-dimensional space, and then, the linear regression method is used to analyze the data. The regression function is

where N is the sample number, x is the characteristic, y is the result label, and K(xi, x) is the kernel function. The hyperplane is calculated from the training set image, and the test set images are predicted according to the distance.
Experiment
Experimental conditions and procedures
This experiment is performed on a PC with Intel Xeon E3-1231 v3 CPU at 3.4G Hz and 32GB memory. The fiber samples used in the experiment are provided by the Erdos Group, and the electron microscope photographs are taken using the sample preparation procedures of GB/T14593-2008 “Quantitative analysis method of cashmere, wool and their blends.” The instrument used is a HITACHI TM3000 desktop scanning electron microscope. To ensure the effectiveness of the identification, the filming job requires skilled and experienced experimenters. A dataset containing 2000 SEM images (1000 cashmere and 1000 wool fiber) was prepared. Data set was divided into three non-overlapping subsets: the training set to train the model, the validation set to select the parameters of the model, and the test set to evaluate the final model. In this experiment, we took 15% of the data set as the test set containing 300 samples (150 cashmere and 150 wool), and 70% of the data set as the training set containing 1400 samples (700 cashmere and 700 wool), and the remaining 15% as validation set containing 300 samples (150 cashmere and 150 wool). Figure 8 is a schematic diagram of data set split.

A split of data set into training set, validation set and test set.
Cross-validation is a commonly used method of data set partitioning, which is more stable and comprehensive than a single method of dividing data set. In this article, cross-validation was employed to split data set into training set, validation set and test set. In this experiment, the entire data set is divided into 20 subsets, each of which accounts for 5% of the total. That is, each subset contains 100 fiber images, with 50 images of wool and cashmere stations. In the experiment, the data set was divided into 7 times, and different subsets were selected as the training set, verification set and test set. The blend rations of wool and cashmere in the training set, verification set and test set were all 1:1. Model training, parameter selection and evaluation are performed after each time the data set is divided. The average of the results of seven experiments was used as the recognition accuracy. The method of dividing the data set is shown in Figure 9.

Data set splitting.
The specific experimental steps are as follows:
The image background removal algorithm is used to preprocess the original images and enhance their characteristics at the same time.
The SURF algorithm is used to transfer the fiber images into a series of feature descriptions and get the image texture features.
The clustering center is obtained by the k-means method for all the texture features.
The resulting clustering center is used to calculate the frequency of feature points in each image and to obtain the visual words vector.
Every fiber image was transferred to a histogram (vector) of visual words, in vector form. And these vectors were split into training set, validation set and test set based on aforementioned methods.
Training set was used to train a SVM model as a classifier for image classification. Validation set was used to select the parameters of the model. Test set was employed to evaluate the performance of the selected parameters.
Experimental results and discussion
In this article, the definition of recognition accuracy is
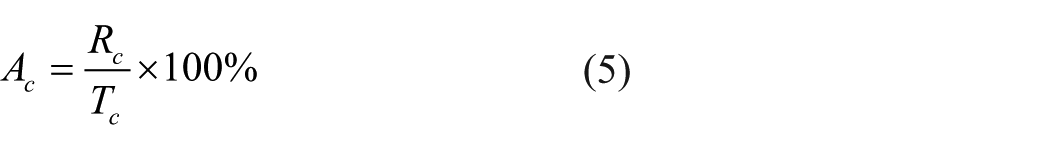
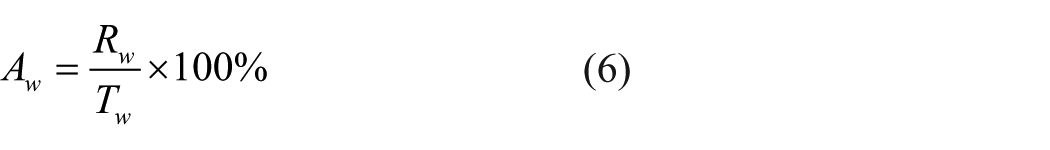

where Rw and Rc are the number of wool and cashmere fibers that were correctly identified, respectively. Tw and Tc are the number of wool and cashmere fibers in dataset, respectively. Aw and Ac denote the recognition accuracy of wool and cashmere, respectively, and At is the overall accuracy for both.
In this experiment, SVM take radial basis function (RBF) as the kernel function. And the two important parameters (C and gamma) were adjusted by grid search. The parameter gamma determines the scale of what it means for points to be close together. And the parameter C limits the importance of each point. Both parameters are set from 0.01 to 100. First, training set was fed into SVM to train a classifier for each combination of parameters by grid search. Then, validation set was used to evaluate the classifiers and store the best score and corresponding parameters. Next, we rebuilt a new model on a data set which combined training set and validation set using the saved parameters. At last, test set was employed to evaluate the new model. The result obtained on the test set is the recognition accuracy of the model.
Taking into consideration the tradeoff between discriminability and generalizability, the number of visual words was investigated in this experiment. We compared the recognition accuracy of our proposed method when the number of visual words had different values. In this experiment, it was set to 12 different values: 50, 100, 150, 200, 300, 400, 500, 600, 700, 800, 1000 and 1200.
A curve representing the results of the classification of SEM images of wool and cashmere fibers is shown in Figure 10. The number of visual words, K, plays an important role on the accuracy. When the number of visual words is set very small, the accuracy is low. This indicates that small K does not afford adequate discriminability for wool and cashmere fiber. With increasing K, the accuracy begins to rise. The highest accuracies are achieved when K is in the (400, 700) range. Our method achieves the highest accuracy when K is set to 500. The curve does not rise obviously when K exceeds 700. One possible reason is that excessive visual words cause the model to be too sensitive and lead to poor generalization for the testing set. Notably, the accuracy starts to decline when K exceeds 700. Csurka et al. 17 indicated that the highest accuracy was achieved when the number of visual words was set to an intermediate value, rather than a large value, which is consistent with our observations in this experiment. In light of the tradeoff between dimension and accuracy, the number of visual words was set to 500 in subsequent experiments.

Accuracy at different scale levels.
The impact of the number of visual words was further investigated by comparing the performance of our method in the testing set and training set. In this experiment, 4000 fiber images were contained in the dataset. In this experiment, we took 15% of the data set as the test set containing 600 samples (300 cashmere and 300 wool), and 70% of the data set as the training set containing 2800 samples (1400 cashmere and 1400 wool), and the remaining 15% as validation set containing 600 samples (300 cashmere and 300 wool). The method of dividing the data set still uses the division method in the previous section, and the number of cashmere and wool in each collection is still the same. We still selected the 12 values mentioned above as the number of visual words. Figure 11 shows the error rate of our method in the testing set and training set versus the number of visual words. As shown in Figure 11, for the training set the error curve declines as the number of visual words increases. For the testing set, the error reached the minimum value when the number of visual words was set to 500, beyond which point the curve started to rise. This finding indicates that over-fitting may occur when the number of visual words is too large.

Error rate of the training set and testing set.
To verify the stability of our method, we prepared the samples of different blend ratios. These samples were selected from testing set by a certain percentage. According to the above discussion, we selected 500 as the number of visual words in the experimental configuration. The overall experimental results are summarized in Table 1.
The accuracy at different blend ratios.

In Table 1, the first column of this table lists the group number of each dataset. The second column shows the sample number of all groups. The third column shows the blend ratio of the fibers. The fourth column (At) is the classification accuracy of the corresponding dataset. As shown in Table 1, although the datasets contained various blend ratios of the fibers, the performance appears to be stable, and the classification accuracy of each data set is approximately 93%.
Conclusion
This article proposed and evaluated a new identification method for wool and cashmere. In our method, the SURF features were used to extract the characteristics from SEM images of fibers. Experimental results show that this method has high recognition accuracy over a wide range of blend ratios. The crucial parameter, the number of visual words, was evaluated in the experiment. The research presented here is an exploration of the SURF feature extraction algorithm’s applicability to the identification of cashmere and wool fiber. In future work, we will use this method to compare and test other kinds of fiber samples and to assess other factors that affect the classification results.
Footnotes
Acknowledgements
The authors would like to thank the anonymous reviewers for their carefulness and patience.
Declaration of conflicting interests
The author(s) declared no potential conflicts of interest with respect to the research, authorship, and/or publication of this article.
Funding
The author(s) disclosed receipt of the following financial support for the research, authorship, and/or publication of this article: This work is supported by the Key Technologies R&D Program of Henan Province under Grant No: 192102210135, the Key Project of Institutions of Higher Learning in Henan Province under Grant No: 18A520010 and the Project of Xuchang University under Grant No: 2019ZD005.