
Abstract
The previous paper (part I) analyzed test errors of the spectrophotometer and their reasons, then systematically investigated the algorithms to reduce measuring bandpass error and intervals error. This paper (part II) focuses on the influence of measurement wavelength ranges and their truncation errors, and some algorithms to overcome the truncation errors. CIE recommends that tristimulus values are calculated over a range of 360–830 nm. However, most spectrophotometers do not meet it. The reduction of measurement range will result in a measurement range error or a truncation error. In this study, five ranges commonly employed in practice are selected for investigating the truncation errors, and three extrapolation methods are used to extend the data to compensate for the measurement range loss. Results are obtained by employing 1301 Munsell color chips under illuminant D65 and CIE 1964 standard observer. For the standard 1-nm intervals, the narrower the range, the larger the truncation error. For the usual-measured 10-nm intervals, bandpass error and intervals error should be handled at the same time, 380–780 nm Table LWL gives the highest accurate outcomes, which even improve the accuracy of the range 360–750 nm to an acceptable level. Whereas, ranges of 360–700 nm and 400–700 nm still need extrapolation to reduce their truncation errors even with Table LWL. Three extrapolation methods of nearest, linear and second-order all reduce the truncation error, but for different ranges, algorithms and illuminants, the optimal method of extrapolation varies.
Keywords
Introduction
CIE 15: 2004 1 and CIE 167: 2005 2 defines that the tristimulus values (TSVs) are calculated over a wavelength range of 360–830 nm. CIE 167: 2005 further states that when fluorescent illuminants are not involved in industrial applications, the wavelength range may be 380–780 nm; if the wavelength range is shorter than 380–780 nm, the calculation error of the TSVs will be caused. In practice, due to the limitation of color measurement instruments, the wavelength range usually cannot cover the full range of 360–830 nm. The error caused by narrower measurement wavelength range is called measurement range error or truncation error.
ASTM E308 3 sets the weighting tables at a range of 360–780 nm, while most instruments can only measure narrower ranges such as 360–750 nm, 360–700 nm, or 400–700 nm. The reduction of the measurement range means that the reflectance data in the corresponding wavelength of the begin region (near Ultraviolet) and the end region (closer to NIR) is 0 compared to the standard range, which will cause truncation error.
Truncation error can be reduced by extrapolation. The so-called extrapolation is a mathematical method to estimate the data outside the range basing on the data within the range. Extrapolation methods commonly recommended include nearest, linear and second-order extrapolation.
Nearest extrapolation is a method that making the extrapolated data equal to the closest data. For example, supposing the range is 400–700 nm, the reflectance that needs to be extrapolated in the end region of the spectrum is consistent with the relationship of Ri = R700 (i = 710, 720 . . .. . . ).
Linear (One-order) extrapolation is a method that using a binary linear equation to extend the data at the beginning and the end of the range. For example, the two points before extrapolation, R690 and R700, are used to calculate a linear equation Rλ = aλ + b (a and b are determined by λ, R690 and R700), then the points of extrapolation are all on this line. This equation can be further converted into the following form.

Second-order extrapolation refers to the method of using a ternary quadratic equation to extrapolate both ends points. For example, using R680, R690, and R700 to calculate the second-order equation Rλ = aλ2 + bλ + c (a, b, and c can be determined by λ, R680, R690, and R700), the points to be extended are all on this curve and can be obtained by the following equations.

In addition, except this direct extrapolation method, the extrapolation coefficient of the reflectance can be added to the corresponding weighting table by weighting coefficient,4,5 so that a new weighting table can be achieved and directly applied to the reflectance data with the same range.
According to CIE 15:2004, extrapolation is generally not recommended, however, when predicting necessary but unmeasured values beyond the range of measurements, in the absence of other information, unmeasured values may, as a rough approximation, be set equal to the nearest measured value of the appropriate quantity in truncation. 1 While, the equivalent (nearest) extrapolation does not take into account the slope and trend of the data terminals that need to be extrapolation, even though, the accuracy is still higher than that of non-extrapolation data. CIE 167:2005 recommends simple linear extrapolation. If one or two data points are extrapolated, linear extrapolation works well, but its precision may decrease with the increase of the numbers of extrapolation data points.
In order to investigate the truncation errors of different measurement ranges and the improvement effect by extrapolation, this paper firstly analyzes the truncation errors theoretically and experimentally, then selects the best-performing Table LWL 6 algorithm to explore the truncation and extrapolation. Five measurement ranges commonly used are chosen for studying the influence of different ranges on calculation accuracy. Three extrapolation methods are utilized to extend different ranges to compensate for the truncation errors. All the improvement effects are analyzed by programming Matlab software. Here, we need to explain that Table LWL is an algorithm, and it performs best to reduce bandpass error and intervals error for reflectance with 10-nm-interval and 10-nm-bandwidth, under D65 illuminant and CIE 1964 10° standard observer basing on our study results of Part I (the previous paper). 7
Experiment
Total 1301 color chips from Munsell Color Book (Matt) were measured by utilizing a Cary 5000 UV-VIS-NIR spectrophotometer over the range of 360–830 nm at 1-nm intervals with 1-nm bandwidth to get spectral reflectance.
CIE’s standard calculation method for TSVs is an integral summation of the reflectance at 1-nm intervals in the range of 360–830 nm together with the same range and same intervals’ standard illuminant and standard observer. TSVs calculated with other methods which differ from standard are set as reference. This paper still uses basic formula CIELAB, 8 the commonly used formula in textile industry CMC(l:c), 9 and the latest standardized formula CIEDE200010,11 to compare the color difference between standard TSVs and reference. The coefficients in the last two formulas are set as 2:1 and 2:1:1, which are adopted in textiles for acceptable evaluation.9,12 The statistics (Median, Average, Max, 80 percentile, 95 percentile, and Standard deviation) are utilized to analysis color difference. The smaller the color difference, the better the corresponding method.
The reflectance data and calculate methods are the same as those in Part I of this series article.
Theoretical analysis of truncation error
Both relative error and color difference are employed to analyze the truncation error.
Relative error of truncation
In 1983, Erb and Krystek
13
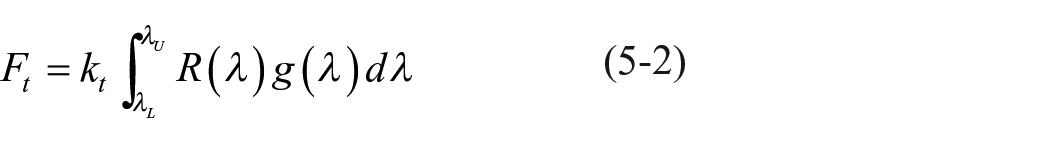
theoretically analyzed the truncation error, they expressed it by the traditional relative error between the actual value Ft by truncated calculation and the nominal value F by CIE specified computation, shown in equation (1-1). According to CIE’s computation method of TSVs, if the truncated range is shorter than 360–830 nm, then


Where,

with

and

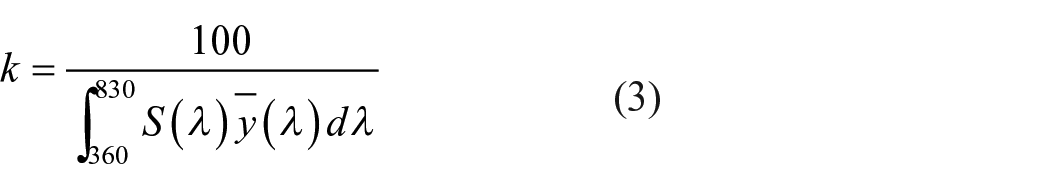
Here, R(λ) is the spectral reflectance factor, S(λ) is the relative spectral distribution of the illuminant,
According to the definition in CIE standard, k in equation (5-1) is not the same k as in equation (3). k in equation (3) corresponds to the wavelength range of 360–830 nm, while k in equation (5-1) corresponds to the range of
with

When the truncation is very small, that is, the measurement range is close to 360–830 nm, then kt ≈ k.
Substitute equations (2), (3), and kt ≈ k into equation (1-2), equation (7), and equation (8) can be obtained. Here, the equal sign as in reference 13 is used, but in fact, due to the difference between kt and k, the equal sign should be the sign of approximately equal.
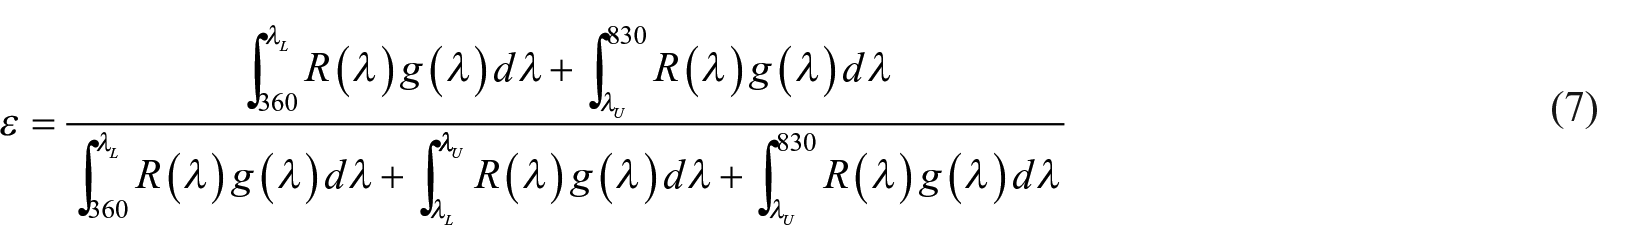

Because of

With the increase of the measurement range, the truncation part decreases (
Obviously, Erb and Krystek used a generally-used relative error method to analyze the truncation error, and the conclusion is reasonable when the truncation was small, since at this time kt≈k.
For example, when the data of
In order to show the error more intuitively, the 1301 spectral reflectance data (as shown in section 1) are adopted to calculate the color difference introduced by different k. Here we compare the color difference between the calculated TSVs with k360–830 as in equation (3) and the standard values with kt as in equation (6).
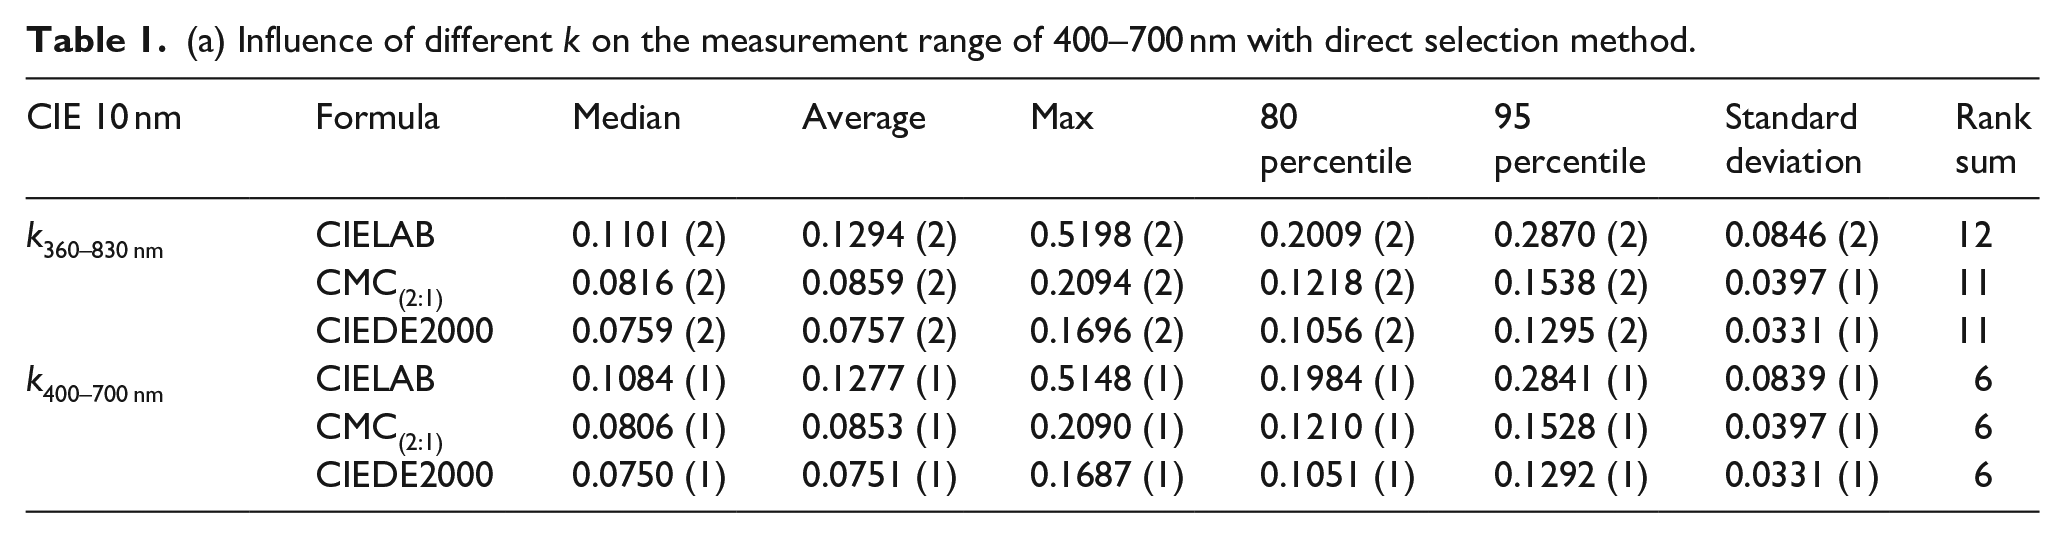
Table 1(a) lists the range error caused by direct selection method with 400–700 nm range and 10-nm intervals, presented by color differences between the standard and the calculated TSVs. The calculated TSVs are obtained by using their reflectance with 400–700 nm and 10 nm weighting coefficients, which are directly extracted from the CIE 1 nm’s standard. In the following evaluation part, numbers in parentheses are the ranks for each statistical cluster, which are summed and written in the last column. The smaller the rank sum, the smaller the color difference, the better is the corresponding method.
(a) Influence of different k on the measurement range of 400–700 nm with direct selection method.
(b) Influence of different k on the measurement range of 400–700 nm with ASTM Table 6.

The second row of data in Table 1(a) are the color differences calculated within the range 400–700 nm, but the k value is k360–830 nm calculated according to the approximate method of equation (3). The third row is computed within the range of 400–700 nm, and the k400–700 nm is gotten according to the correct method of equation (6). Comparing the color difference values of the second and third rows, the accuracy using equation (6) is higher than that using equation (3) as a whole, although they are very close.
If the optimization weighting table in Part I is used to improve the accuracy of the measured data with 10-nm intervals in range 400–700 nm, that is, the optimization algorithm is used to reduce the bandpass and the intervals error, the color differences will be significantly decreased. Table 1(b) exhibits the results calculated with ASTM Table 6. The difference between the second and third rows is minimal and can be ignored. The results computed with Table LWL are similar to those with ASTM Table 6, not listed here. While, the differences between the data in Table 1(a) and (b) also show the effect of the improved algorithm on increasing the accuracy of TSVs as investigated in Part I.
Color difference of truncation error
Equation (1) adopts relative errors of TSVs to analyze the truncation error. In the field of color, people are more accustomed to using color difference to evaluate the difference. Since the conversion of TSVs to color difference is not linear, it is not easy to estimate the variation of color difference based on XYZ’s increase or decrease.
To investigate the variation of color difference with the change of measurement range, this paper sets the starting wavelength range from 360, 370, . . ., till 820 nm at 10 nm intervals changes, the ending wavelength ranges from 370, 380, . . ., till 830 nm at 10 nm intervals, then calculates the errors of all the possible 1128 ranges shorter than 360–830 nm with 1-nm intervals S(λ) and

Median values of CIELAB color difference of all the 1128 possible truncation errors caused by ranges shorter than 360–830 nm (shown at 10-nm intervals): (a) three-dimensional figure, (b) left view figure, (c) top view figure, and (d) right view figure.
Figure 1(a) is a three-dimensional plot. It presents the relation between the trends of truncation error and range. The values in the x-axis being the starting wavelength, the y-axis being the terminal wavelength, and the z-axis being the Median value of CIELAB color difference in the corresponding measurement range (from starting wavelength x to terminal wavelength y). Figure 1(b)–(d) are left side view, top view, and right view respectively.
It can be seen from Figure 1 that the color difference is not merely reducing with the measurement range increases. The highest color difference occurs in the range of 410–420 nm, and then decreases with the range increasing. Overall, the range with larger color difference is mainly distributed before 500 nm, indicating that the error caused by the missing data points at the terminal wavelength is larger than the lost at the beginning. In addition to the large fluctuations at some ranges, the truncation error is basically reduced as the measurement range increases.
Experimental study of truncation error
Generally, the measurement range of spectrophotometer is less than 360–830 nm specified by CIE. Weighting tables recommended by ASTM provide data in range of 360–780 nm, while CIE recommended 1 for computing TSVs for no fluorescent materials, the wavelength range can be from 380–780 nm, the ranges of some spectrophotometers are 360–750 nm or 360–700 nm, and some portable instruments used in the industry covers only 400–700 nm. Therefore, five ranges (360–780 nm, 380–780 nm, 360–750 nm, 360–700 nm, 400–700 nm) and their truncation errors are experimentally studied here.
The truncation errors of the above five ranges are discussed and compared based on the three cases blew, the errors are characterized by color differences. First case, research on the truncation errors with 1-nm intervals reflectance data. The results are shown in Table 2.
Color difference of five truncation ranges at 1-nm intervals with CIE’ weighting coefficient table.

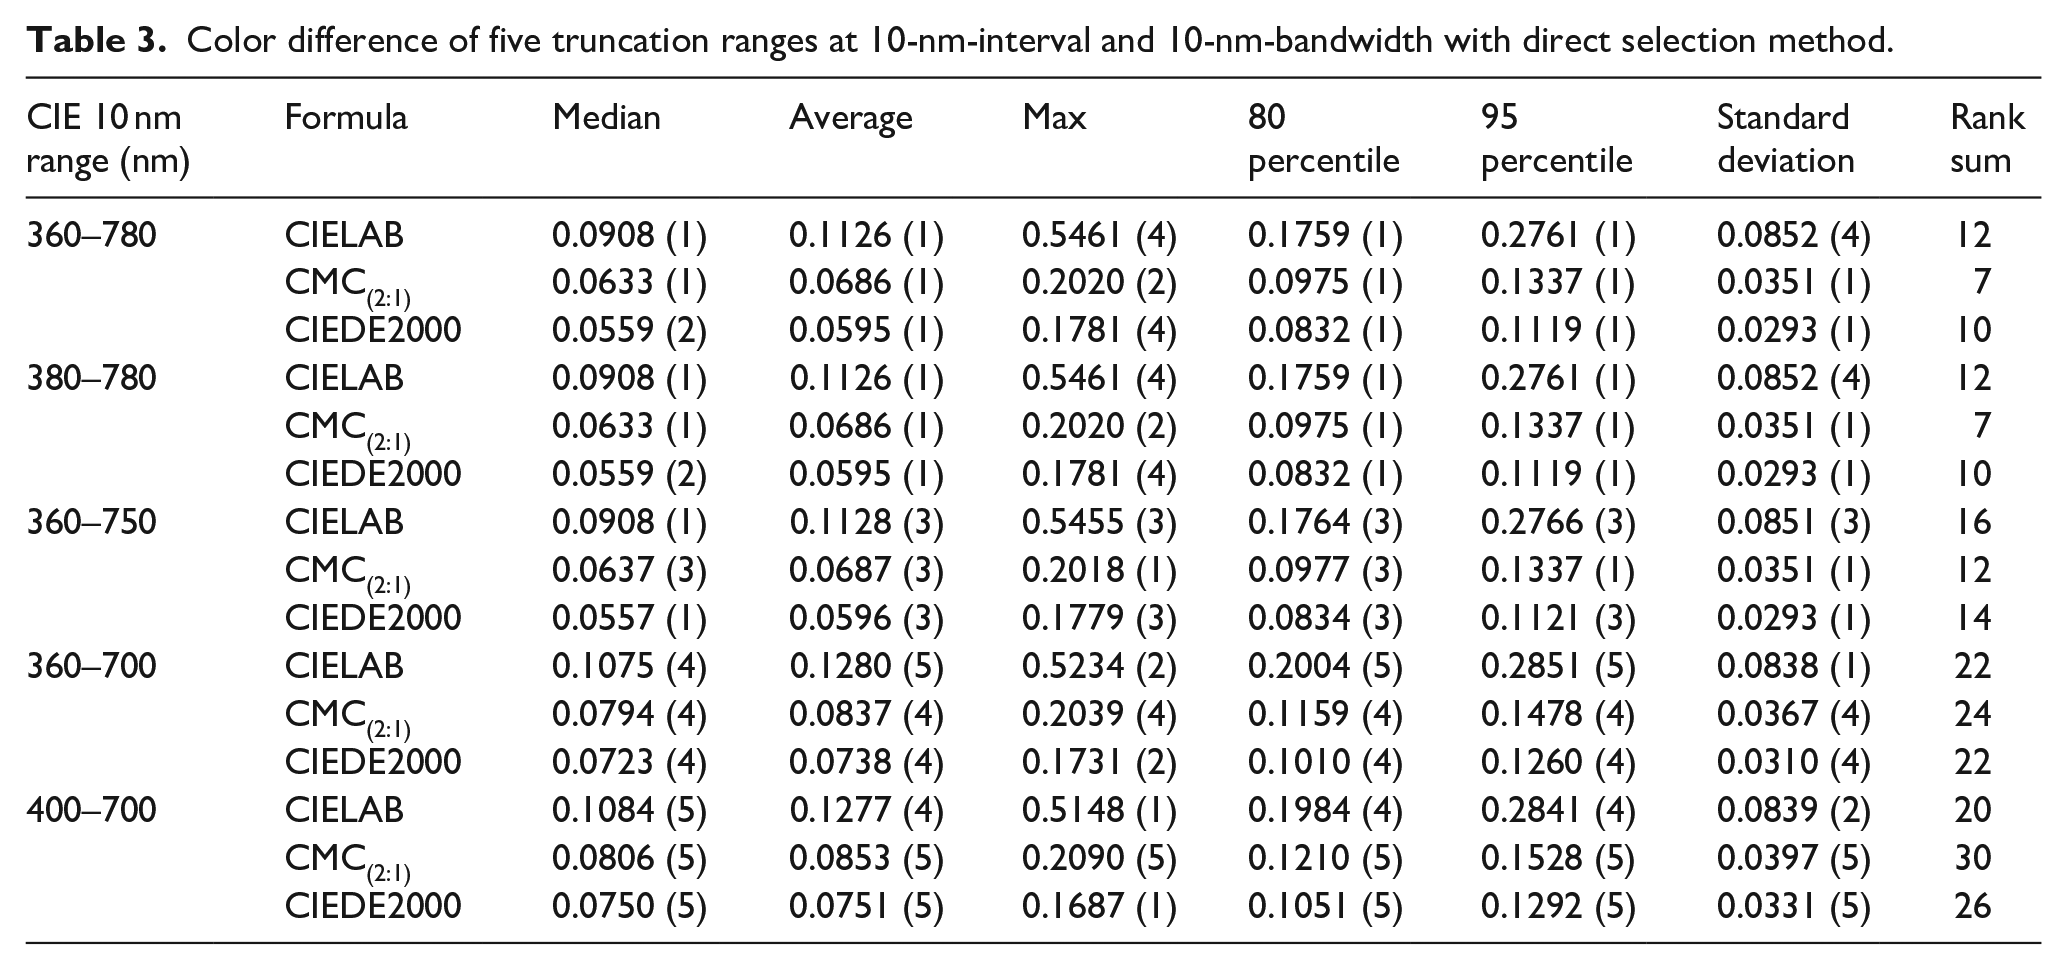
Second case, since reflectance data measured by many spectrophotometers are 10-nm-interval with 10-nm-bandwidth, so the truncation errors by direct selection calculation method (a conventional method used by ordinary people) are also researched. The results are exhibited in Table 3.
Color difference of five truncation ranges at 10-nm-interval and 10-nm-bandwidth with direct selection method.
Third case, measurement intervals and bandpass errors exist in the second case can be significantly reduced by Table LWL algorithms, so the truncation errors based on Table LWL are very worth to research. This case need to produce Table LWL of the five ranges correspondingly to get the reference TSVs. The results are exhibited in Table 4.
(a) Truncation error calculated with Table LWL made by corresponding measurement range.

(b) Truncation error calculated with range truncated from Table LWL of 380–780 nm.

From Table 2, it is apparent that the narrower is the range (far from 360 to 830 nm), the larger is the error. The average CMC(2:1) color difference of truncation error of 400–700 nm is close to 0.1, and the maximum CMC(2:1) is about 0.2. As for the ranges broader than 360–750 nm, the max values are less than 0.01, for ranges broader than 380–780 nm, the max values are even less than 0.002.
Table 3 includes not only truncation error but also bandpass error and intervals error. The five ranges show similar errors to each other. All their Max values of CIELAB are higher than 0.5 and all the Max values of CMC(2:1) are about 0.2. These errors are generally much higher than their corresponding data at 1-nm intervals as shown in Table 2, but all the five ranges reach to the same error level. This means that the 10-nm measurement intervals affect worse than the five truncations. In other words, 10-nm-interval and 10-nm-bandwidth errors are higher than the above truncation errors. Besides, the three errors are not merely additive, they have compounded effects from the view of color difference.
From the rank sum in Table 4(a), it can be seen that the first rank is the range of 380–780 nm, the second is 360–830 nm, the third is 360–780 nm. The fourth-ranked range 360–750 nm, the fifth-ranked range 360–700 nm and sixth-ranked 400–700 nm are much larger than the top three ranges. The top three ranges, 380–780 nm, 360–830 nm, and 360–780 nm show the same level of errors and all reduce to less than 1% of their corresponding errors as shown in Table 3. Range 360–750 nm’s maximum error is less than 0.01 which is also acceptable. Range 360–700 nm and 400–700 nm’s max CMC(2:1) error is higher than 0.2, indicating they need to be further improved.
What surprised us is that the truncation error of range 380–780 nm is smaller than the full range 360–830 nm when utilizing Table LWL at the 10-nm intervals, although they are on the same level. This indicates that Table LWL has the smallest error in the range of 380–780 nm. Because the reflectance data of this narrower range is easier to be measured than the full range of 360–830 nm, and it also reduces the amount of computation accordingly, these advantages make us can’t help thinking more about it.
First, we try to explore the reason: the original data sets used for deducing Table LWL algorithm by Professor Li et al. 6 include 1096 Pantone color samples’ reflectance at 1-nm-interval in band of 360–780 nm, and 1269 Munsell Matt samples’ reflectance at 1-nm-interval in 380–800 nm, these total 2365 sets data were then extrapolated to 360–830 nm. We hypothesized that the ranges of these original data result in Table LWL performed best at their sharing range of 380–780 nm.
Then, we further guess: if the truncation error of the range 380–780 nm by Table LWL algorithm is the smallest, can other ranges shorter than 380–780 nm directly adopt the weighting data of corresponding ranges truncated from Table LWL of 380–780 nm? If yes, Table LWL algorithm will be more practical and convenient.
Following this speculation, the truncation errors of ranges 380–750 nm, 380–700 nm, and 400–700 nm were also calculated by using the weighting tables truncated directly from 380–780 nm Table LWL. The results are given in Table 4(b). Comparing the data in Table 4(b) and (a), the ranges of 380–750 nm, 380–700 nm, and 400–700 nm in Table 4(b) are not broader than the range of 360–750 nm, 360–700 nm, and 400–700 nm in Table 4(a), but the errors in Table 4(b) are apparently less than that in Table 4(a). For range 400–700 nm, the maximum of the three color differences reduces from (0.2528, 0.2228, 0.1778) to (0.1446, 0.1124, 0.1127). This further indicates that Table LWL has the highest accuracy in the range of 380–780 nm. When the range is shorter than 380–780 nm, the weight coefficients can be directly taken from the 380–780 nm Table LWL without additional calculation of the corresponding range’s Table LWL.
Comparing the data in Table 4(b) achieved by 380–780 nm Table LWL and the data in Table 3 gained by regular direct selection method, obviously, Table LWL algorithm reduces errors and improves accuracy greatly. For the range of 400–700 nm, the maximum errors decrease from (0.5148, 0.2090, 0.1687) to about 60% (0.1446, 0.1124, 0.1127). For range 360–700 nm, the maximum errors reduce from (0.5234, 0.2039, 0.1731) to about 60% (0.1426, 0.1110, 0.1118) too. For range 360–750 nm, the maximum errors decrease from (0.5455, 0.2018, 0.1779) to (0.0047, 0.0044, 0.0044), being less than 0.03, which is acceptable and seems indicate that the measurement range 360–750 nm is acceptable by utilizing Table LWL of 380–780 nm to improve its accuracy.
In addition, we speculate, if the ranges of the basic data sets used by Professor Li CJ’s in their investigation of Table LWL algorithm is 360–830 nm, can he get a more accurate algorithm? Of course, the improvement effect of the current Table LWL algorithm is in fact unexpectedly beautiful.
Experimental study of extrapolation
According to the above section, truncation errors can be reduced significantly by adopting Table LWL algorithm, but the reductions are not enough for range 360–700 nm and 400–700 nm, so extrapolation is still in need. Since Table LWL performs better in range of 380–780 nm than in 360–830 nm, the extrapolation in this part extends data to the range of 380–780 nm.
The reflectance data of ranges 360–750 nm, 360–700 nm and 400–700 nm at 10-nm intervals are individually extended to 380–780 nm by three extrapolation methods (the data at 360 nm and 370 nm are deleted), their TSVs are obtained by calculating with 380–780 nm Table LWL.
Table 5 gives the results of extending the range from 360–750 nm to 380–780 nm. The data of 360 nm and 370 nm are omitted, and three data points for 760 nm, 770 nm and 780 nm are extended. The best extrapolation method is the second-order method (with maximal DE: 0.0034, 0.0027, 0.0022), but the differences among the three methods are very small. Second-order is just slightly better than other methods in the maximum color difference. In fact, the truncation error of 360–750 nm with Table LWL improvement method is minimal (maximal DE: 0.0047 0.0044 0.0044, average DE: 0.0012, 0.0009, 0.0008) that the extrapolation method seems no need to proceed as described at the end of section 3.
Performance of three extrapolation methods of extending measurement range from 380–750 nm to 380–780 nm using Table LWL.

Table 6 shows the results of extrapolating range from 360–700 nm to 380–780 nm. Eight data are extended from 700 nm to 780 nm at 10-nm intervals. The best extrapolation method is the linear method, which is better than the other two in terms of maximum value. The result is encouraging with most (95%) DE about 0.004, maximal DE about 0.01, while the un-extrapolated 95 percentile data in Table 4(b) are about 0.07, maximal DE about 0.11.
Performance of three extrapolation methods of extrapolating measurement range from 380–700 nm to 380–780 nm using Table LWL.

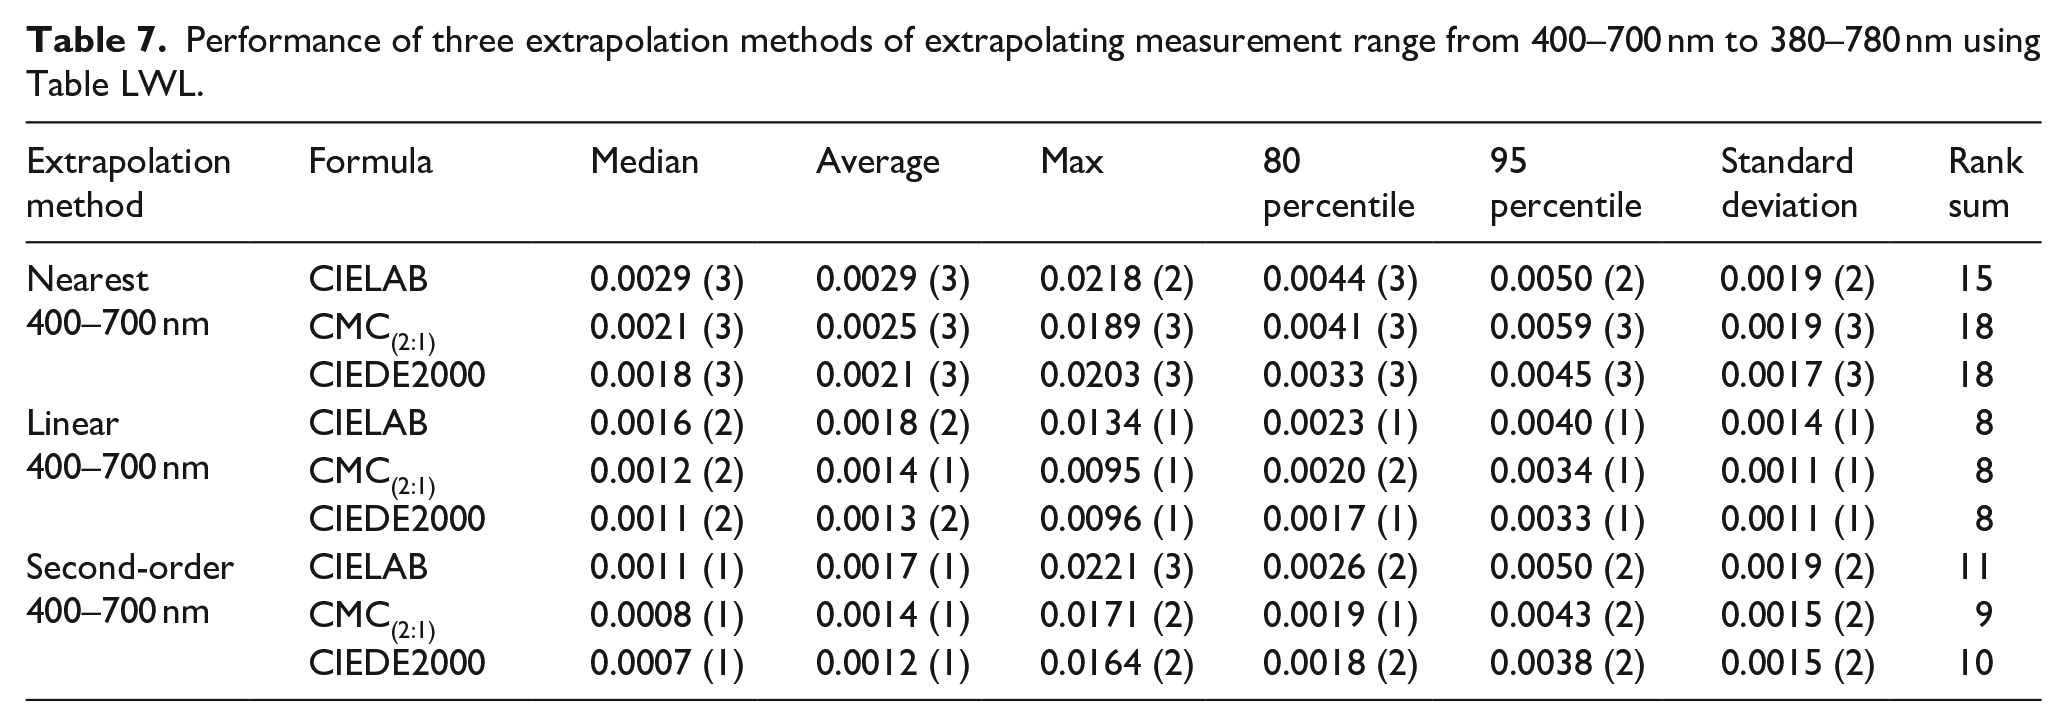
Table 7 shows the results of extrapolation of range 400–700 nm to 380–780 nm. The rank sum shows the linear method is slightly better than the others. Linear method is better in Max, 95 percentile and Standard deviation coefficient, while second-order is better in Average and Median color difference. The effect is encouraging with most (95%) DE less than 0.004, maximum DE about 0.01, while the un-extrapolated 95 percentile data in Table 4(b) are about 0.06, maximal DE about 0.1.
Performance of three extrapolation methods of extrapolating measurement range from 400–700 nm to 380–780 nm using Table LWL.
In order to show the improvement of the extrapolation methods more intuitively, the truncation errors of three measurement ranges less than 380–780 nm and extrapolation methods are presented by Median CMC(2:1) and depicted in Figure 2. Obviously, the range 380–750 nm after extrapolation almost reached the accuracy of 380–780 nm. The ranges of 380–700 nm and 400–700 nm have also been significantly improved by the extrapolation, and the color difference decreases to 2.2% and 3.6% of the original ones respectively. The errors here reduced mainly because of the contribution of extrapolation.
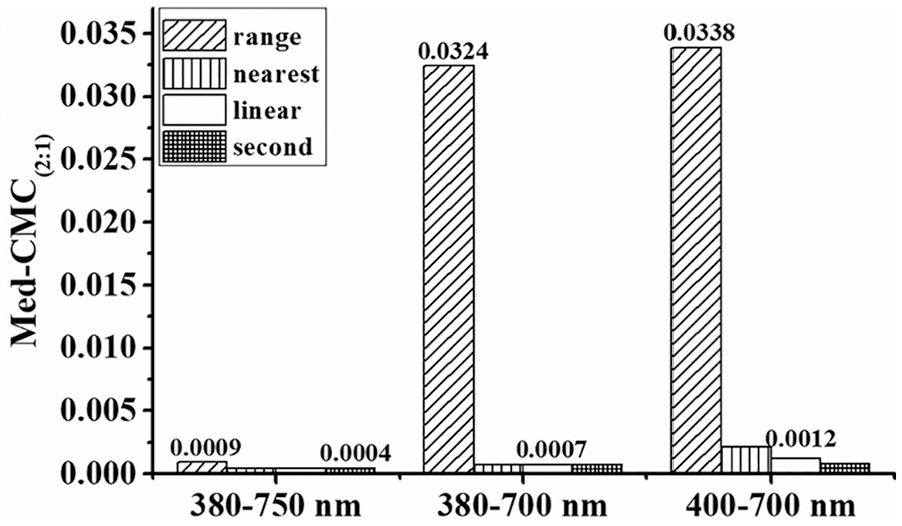
Performance of three measurement ranges before and after extrapolation (with Table LWL improvement).
Comparing the color difference of Table 3 (the direct selection method contains bandpass, intervals and ranges errors) and Tables 5 to 7 (the method reduces bandpass and intervals errors by Table LWL, and reduce range errors by extrapolation), for the range 380–700 nm, the median CMC(2:1) after linear extrapolation (Table 6) is nearly 0.9% (0.0007/0.0727 = 0.009629) of the direct selection method (Table 3), for the range 400–700 nm, the median CMC(2:1) after Second-order extrapolation (Table 7) is almost 1.5% (0.0008/0.0766 = 0.010444) of the direct selection method (Table 3). The errors here reduced remarkably, not only due to the contribution of the extrapolation, but also the improvement of the accuracy brought by 380–780 nm Table LWL.
It should be noted that the optimal extrapolation method corresponding to the above measurement range is under the illuminant D65 and 1964 standard observer with the best algorithm of Table LWL. When condition changes, the best extrapolation method may also vary. Taking Wang et al.’s 14 research as an example, their result indicates the second-order method perform best.
There are two critical different points between methods in this paper and Wang et al.’s. First, Wang et al.’s data basing on the assumption that the directly extracted 10-nm reflectance is the reflectance contain bandpass but corrected by a perfect bandpass correction, thereby the 10-nm reflectance at the corresponding wavelength points is exactly equal to the 1-nm’s reflectance at the same wavelength points, so they can explore the extrapolation purely without other error. While this paper considers the practical situation of 10-nm intervals reflectance measured by the existing instruments, and explores the extrapolation methods basing on Table LWL, therefore this method contains all the errors exist already and can be easily used in practical application. Second, Wang et al. separates the color differences into two groups of continuous CIE illuminants (D65, D50, and A) and fluorescent CIE illuminants (FL2, FL7, and FL11), each group is combined with the CIE 1931 and CIE 1964 standard observer separately, then to evaluate comprehensively. While, this paper only calculates under illuminant D65 and CIE 1964 standard observer, because it is one of the commonly used standard conditions for theoretical research. The CMC(2:1) and CIEDE2000(2:1:1) color difference formulas are also recommended to be used under this condition. And only consider one condition can avoid the effect of other conditions. This paper also explores the best extrapolation methods of ASTM Table 6 and CIE 10 nm direct selection method respectively. Three typical ranges of 360–750 nm, 360–700 nm, and 400–700 nm and their optimal method of each algorithm are shown in Table 8. Obviously, for the same reflectance data and the same number points of extrapolation, the optimal extrapolation algorithm may different. Besides, Wang et al. 14 also imparts us that the extrapolation effect may also affect by the illuminants.
The best extrapolation method for three measurement ranges with different algorithms.

Theoretically, extrapolation by following the trend of reflectance spectrum should be optimal. Due to the variation trend of spectrum, even the colors with the same Hue vary their trend at their terminals. Therefore, it may necessary to consider the extrapolation method separately according to the beginning and the end’s trend of each sample.
Anyway, extrapolation is necessary for measurement ranges of 360–700 nm and 400–700 nm. Further investigation should be conducted for more accurate calculation of TSVs for object color
Conclusions and recommendations
This paper analyzes the truncation error theoretically and experimentally, and then studies extrapolation algorithms to reduce the errors and improve the calculation accuracy of TSVs. The following results are achieved by employing 1301 Munsell color chips under the condition of D65 illuminant and CIE 1964 standard colorimetric observer.
(1) By calculating the truncation errors of all the possible 1128 ranges shorter than 360–830 nm, the truncation error characterized by color difference does not merely decrease as the measurement wavelength range increase. The color difference is larger when the whole range is closer to the UV region, which means that the loss of end region’s data makes the color difference even bigger. But in general, the color difference decreases as the measurement range increases.
(2) For the five commonly used wavelength ranges (360–780 nm, 380–780 nm, 360–750 nm, 360–700 nm and 400–700 nm) at 1-nm intervals, longer range results in higher accuracy. However, for the usually measured 10-nm intervals, a special algorithm is needed to reduce both the bandpass error and the intervals error. In this paper, Table LWL algorithm (the best method proved in Part I) is adopted to explore the truncation errors of the shorter ranges. Results show that the 380–780 nm Table LWL performed best and can significantly reduce the errors of the above five ranges. All ranges narrower than 380–780 nm can directly extract the corresponding range from Table LWL 380–780 nm for tristimulus computing. There is no need to produce the corresponding range of Table LWL again, which greatly simplifies the calculation. With 380–780 nm Table LWL’s improvement, the truncation error of measurement range 360–750 nm is reduced to an acceptable level, but range 360–700 nm and 400–700 nm are still not ideal and need further extrapolation.
(3) Three extrapolation methods of nearest, linear and second-order are all proved to have an efficient effect of improving the accuracy of TSVs. For range 360–750 nm, the effect of extrapolation is not apparent since its error is already very small by applying Table LWL algorithm, for ranges of 360–700 nm, their errors reduce to 2.2% by linear extrapolation, and reduce to 0.9% by both Table LWL and linear extrapolation, for ranges of 400–700 nm, their errors reduce to 3.6% by linear extrapolation, and reduce to 1.5% by both Table LWL and linear extrapolation. The error values and their corresponding methods can provide a reference for users finding proper methods they need.
The investigation in Part I (the previous paper) and Part II (the current paper) shows that, when the measured intervals and ranges do not meet CIE’s requirement, some mathematical methods can be utilized to reduce the error and improve the accuracy of TSVs significantly. For the reflectance at 10-nm intervals under illuminant D65 and 1964 standard observer, Table LWL has the highest accuracy with the median color difference reduced to about 7% of untreated data (shown in section 4.6 in Part I), and its best calculating range is 380–780 nm. With 380–780 nm Table LWL’s help, the errors of measurement range 360–750 nm are acceptable, but ranges 360–700 nm and 400–700 nm need further extrapolation for high accuracy. Generally speaking, Table LWL algorithm performs extraordinarily in improving the accuracy of TSVs of object color. Hope it can also do a great job under other condition and fluorescence color. Besides, the optimal and unique extrapolation methods need further study too.
Footnotes
Declaration of conflicting interests
The author(s) declared no potential conflicts of interest with respect to the research, authorship, and/or publication of this article.
Funding
The author(s) received no financial support for the research, authorship, and/or publication of this article.