
Abstract
Tubular braided composites combine manufacturing technologies from textiles and composites industries. The design of the reinforcing textile structure plays a significant role in the mechanical characteristics of the final composite. Twisted yarns have shown improved strength over untwisted ones, even for continuous multifilament yarns where twist is not necessary for the manufacturing process. In this work, a manufacturing process is piloted in which twisted yarns are introduced to the braiding process. Static testing is then done to determine the impact of yarn twist on the stiffness and strength. Finally, the Ramberg–Osgood model is adapted to the results in order to provide a descriptive model for the behavior of tubular braided composites beyond the proportional limit.
Background
Previous works on two-dimensional tubular braided composites (TBCs) production and experimentally assessed tensile properties have shown significant variability in the results and lower-than-predicted properties.1,2 Some of the leading causes of these variabilities are thought to be related to final product architecture such as unit cell, strand fraying, inaccurate strand cross-section assumptions, yarn twist, and many more.3–5 Twisted yarns have shown to be advantageous in textile manufacturing processes. 6 In the case of TBCs, no work to date has been done to show the impact of including yarn twist in the manufacturing process of TBCs. Thus, this study aims to quantify the impact of twisted yarns on some key mechanical properties of these materials as well as explore a means of modeling the impacted behavior.
Twist modeling in composites
Twist is used to produce many natural fiber yarns as it acts to bundle the individual short fibers together into a usable final yarn. However, with advances in materials science, virtually continuous fibers and yarns can now be produced, as is the case with many of the fiber constituents used for textile composite materials, such as polyaramids (Kevlar®; DuPont Inc., Midland, MI, USA), E-glass, ultra-high molecular weight polyethylene (UHMWPE), and regenerated cellulose fibers. Twist can even be added to these textile yarns to improve handling and strength during textile processing. 6
The effect of twist on yarns, textiles, and composites has been documented on a few different levels. In the case of textile yarns, some of the earliest work on the subject was done by Gegauff, as described by Hearle,
7
who showed analytically that the relationship between twist angle and longitudinal stiffness of a twisted yarn follows a
For more complex textile composite structures, such as weaves or braids, little work has been done to investigate the effect of twist on the stiffness and strength properties of composite structures. Ma et al. 10 investigated the effect of twisted sisal fiber yarns in composites, though this study used natural fibers with high levels of twist (greater than 10°) and was limited to unidirectional plies. Naik and Kuchibhotla 11 analytically predicted that low levels of twist can be used to improve the handling of a woven composite without significantly altering the strength of the composite. Xu and Qian 12 developed a model to predict the stiffnesses of a four-directional braided composite (4DBC) by including the effects of yarn distortion, including yarn twist, but did not account for the change in strength and only compared to three experimental samples. No studies on the impact of low twist in TBCs have been documented thus far.
Stress–strain behavior of TBCs
The stress–strain behavior of TBCs can be broken down into three distinct sections, as shown in Figure 1.

Schematic diagram of a representative stress–strain of longitudinal tensile behavior of a TBC. Phase 1 is the elastic response, phase 2 is the plastic deformation up to the ultimate strength, and phase 3 is the yarn scissoring as the braid approaches the jamming point. 13
Note that the stress–strain response here is reflective of the structural changes that occur in the TBC. At the onset of tension, there is a region of linear-elastic behavior, which has been well documented.1,14,15 The end of phase 1 (elastic response) is considered to be when the TBC has passed the proportional limit. Next, there is a nonlinear strain phase, which has previously been ignored for TBCs as the unidirectional composites of the same constituents do not express similar behavior. In this region, it is proposed that the bond between overlapping yarns is failing. Finally, there is a scissoring phase, where the previous degradation of the interyarn matrix allows for overlapping yarns to shear relative to each other in a scissoring fashion. 16
The result is a localized decrease in radius of the TBC, as can be observed in Figure 2.
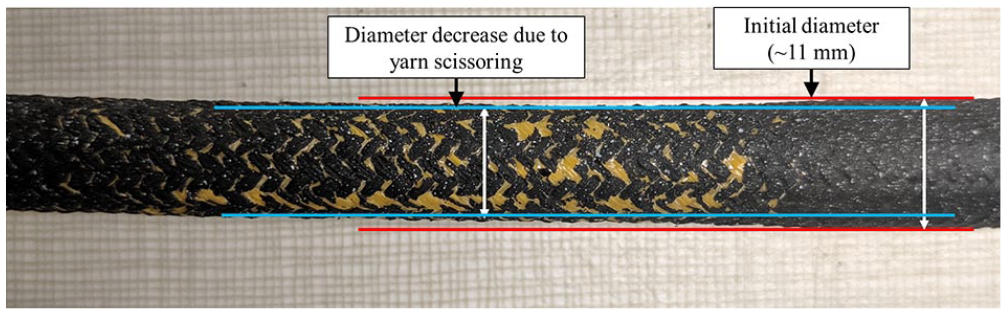
Image showing decrease in diameter of TBC due to yarn scissoring.
In this study, the stress typically decreased with the constant extension rate in the yarn scissoring phase. Large deformations occur in this region prior to the TBC reaching the “jamming” point, where the yarns jam against each other.17,18 Here, the stress may rapidly increase again as this limit is met and the TBC soon fails.
As mentioned, the linear-elastic region of these braids has been well documented, but there is little work to describe the behavior beyond this region. Since there is a distinct linear-elastic region and nonlinear region, the Ramberg–Osgood equation is a good candidate for the analytical modeling of TBCs beyond the proportional limit.
Modeling nonlinear behavior of composites
The Ramberg–Osgood equation has been traditionally applied to the metals, but some recent progress in composites modeling has shown its potential application to other materials. Bogetti et al. 19 use the equation to model the nonlinear behavior of a composite laminate, but this is restricted to the interlaminar shear direction and not applied to the longitudinal or in-plane shear. Cao et al. 20 analyze the in-plane behavior of a carbon-Dyneema® hybrid woven composite and use the Ramberg–Osgood equation to define the nonlinear behavior of the Dyneema textile. For these reasons and through observation of its post-elastic behavior, the Ramberg–Osgood equation is a good candidate for application to TBCs. Beard and Chang 21 attribute the nonlinear behavior to the scissoring that occurs during the compressive longitudinal crushing of TBCs by continually updating the stiffness model as the braiding yarns rotate relative to each other. However, if that same logic is applied to this study that would imply the stiffness of TBCs increases during failure, which is contrary to the behavior that has been observed.
Ramberg–Osgood equation
The Ramberg–Osgood equation is an analytical power law equation that can be used to describe the plastic deformation of the stress–strain curve of a material. 22 Technically, the Ramberg–Osgood equation can take multiple forms so long as both the elastic modulus and an exponent are involved, but in this work, the form of the equation that uses the yield strength and offset will be used as shown in equation (1)

where

Plots showing simulated Ramberg–Osgood equation response to change in (a) elastic modulus, (b) yield strength, and (c) shape factor exponent
Change in the elastic modulus affects not only the linear region but also the curvature response of the plastic zone since the offset yield point is also based on this value (Figure 3(a)). Change in yield strength does not affect the linear region, but still affects the shape of the plastic zone prior to yield (Figure 3(b)). With the other two parameters held constant, changing the shape factor or Ramberg–Osgood exponent (Figure 3(c)) adjusts both the knee response between the elastic zone and the yield strength, and the “flatness” of the plastic zone as it approaches the yield point. Note that the stress–strain curve still passes through the same yield point as determined by the offset method as the shape factor is changed. Appendix 1 gives a detailed description of how each of these parameters is obtained.
Materials and methods
Constituents
Two different textile yarns were used throughout testing. Kevlar 49 (DuPont Inc.), a synthetic polyaramid yarn, has been used extensively for various textile composite applications, including braiding.16,23 BioMid (BioMid Fiber, Burnaby, BC, Canada), a regenerated cellulose yarn, has only recently been used in TBCs.5,24 Both Kevlar 49 and BioMid yarns are supplied as continuous multifilament yarns. Table 1 provides a summary of the relevant properties known for each yarn.
Properties of yarn constituents used.

A thermosetting epoxy resin, Epon 826 (Hexion Inc., Columbus, OH, USA), was used for the composite matrix. Epon 826 is an industry standard bisphenol-A thermoset epoxy for textile composites and has a well-documented literature base. It is mixed with an appropriate hardener, in this case Lindau LS-81 K (Lindau Chemicals Inc., Columbia, SC, USA), at a 1:1 weight ratio. Working life is about 1 h, which is excellent for handling and preparation purposes.
Twist configurations
To directly assess the impact of twisted yarns, TBCs were prepared with and without twisted yarns. Overall, three different loadings of twisted yarns were considered: zero twist, half twist, and full twist. In a zero twist TBC, none of the yarns within the braid structure are twisted. In a half twist yarn, one of the braiding directions (Z- or S-, as shown in Figure 4) is twisted, while all of the yarns in the other direction remain untwisted. In a full twist TBC, all of the yarns in both braiding directions are twisted.

Sketches denoting the directions of yarns in a braided structure (a) and twist in twisted yarns (b, c). The sketch in (a) shows the braid structure with the longitudinal axis direction
Twist can be applied to yarns in either the same direction as their helical path (co-twisted) or in the opposite direction to their helical path (counter-twisted). In this study, all yarns were counter-twisted, and the impact of twist direction was not explored. For the purpose of this study, specimens will be grouped as either “Full” (full twist), “Half” (half twist) or “Zero” (no twist). It was assumed that the twisting of the braiding yarns had no impact on the braid angle of the TBC. Since the braid angle is far from the jamming angle of braid, the braid geometry is dependent on the relative motion of the braid carriers and pulling mechanism, which remained constant for the manufacture of all specimens. Twist was measured for each specimen based on the number of turns per meter (tpm). A previous study was used to determine an appropriate level of twist for increased yarn strength. 25
TBC manufacture
Manufacture of TBCs was done using the process outlined in Figure 5.

Schematic diagram of tested and proposed twisted braided composite process. Continuous multifilament yarns are twisted (a) to 80 tpm and then wound (b) onto braiding bobbins. The spooled yarns are then used to braid (c) preforms and are subsequently cut (d) to length. Resin is impregnated (e) into the braids and finally cured (f) at elevated temperatures.
Yarns were twisted to 80 tpm as per the results from a previous study. 25 Yarns were respooled onto braiding spools with the required yarn twist as discussed previously. These spools were then mounted onto a horizontal maypole braider (Steeger HS140/36-91; Steeger GmbH and Co., Wuppertal, West Germany) and subsequently braided into preforms. Each preform was made with the same manufacturing settings, resulting in a regular braiding pattern (two over, two under, or 2/2) with a total of 36 braiding yarns at a braid angle of 45°. The only changes applied between samples was the yarn twist and configuration used. Preforms of approximately 2–3 m in length were manufactured and then cut down to 20 cm lengths. Dry preforms were then mounted on steel core polytetrafluoroethylene (PTFE) rods for resin impregnation and curing, which was done according to a predetermined heating schedule for the resin used. After curing, samples were trimmed and mounted onto end tabs for testing using a 24-h ambient cure high-strength epoxy (Loctite E-60HP; Loctite Düsseldorf, Germany). At least five samples of each type were prepared for testing, with a minimum of three of each type tested.
Testing
Samples were tested on an electro hydraulic test frame (MTS, Eden Prairie, MN, USA) with a load range of ±4.5 kN. Digital image correlation (DIC) was used for strain capture and thus samples were patterned accordingly prior to testing. Image and load data were captured with custom MATLAB software (MATLAB R2017a; MathWorks Inc., Natick, MA, USA) running simultaneously with the tensile frame, as shown in Figure 6.

Image of testing and imaging setup. Load is applied via the hydraulic actuator (a) to the sample (b), while the load cell (c) is used to report applied load. Cameras (d) capture images of the sample, lit by the diffuse lights (e).
Uniaxial tension was applied to the samples at a rate such that non-elastic behavior was observed within 2 min, approximately 2 mm/min for the Kevlar samples and 1 mm/min for the BioMid samples. Load data were captured at a rate of 100 Hz and saved directly to a computer hard drive for future processing.
A commercial PIV/DIC package (LaVision DaVis 8.2.0; LaVision, Ypsilanti, MI, USA) was used for the DIC analysis. A custom stereo calibration target was used with a feature diameter of 1.25 mm, a feature-to-feature distance of 5 mm, and a height separation of 1 mm. Images were subjected to preprocessing to optimize the contrast and intensity of images. Localized histogram equalization was used to even out brightness across the image and improve contrast. A square 31 × 31 pixel subset with a step size of 17 pixels was used for the image correlation process, and the quantity of interest was strain. Strain maps were produced for qualitative analysis of the failure mechanisms of the braid, while a virtual strain gauge 20 mm in length was used in the longitudinal direction in order to determine the tensile strain.
Predicting post linear-elastic region behavior
The behavior of TBCs reflects that of a ductile material, but there is not true plastic deformation or yield in the technical sense as it applies to metals. However, the power law behavior expressed by the Ramberg–Osgood equation is a good fit for the complex combination of linear strain, interyarn shear failure, and scissoring that occurs to the TBC in this region. However, an equivalent to the “yield stress” must be used in order to account for the nonlinear behavior of the TBCs. Instead of yield stress, an offset stress will be used.
In addition, the use of stress values in this context is debatable as well. The final structure of the TBCs is a hollow tube, but with many surface imperfections due to either the texture of the braid or excess resin. Direct measurement of the specimens results in increased spread of data due to large fluctuations in perceived cross-sectional area from an inability to measure the area well without destructive testing. In traditional composite theory, the most significant contributor to stiffness and strength is the reinforcing fibers and volume fiber fraction, rather than the actual projected area. For the purposes of this study, it was assumed that the fiber volume fraction was constant between samples and that the amount of fiber reinforcement is the same. From these assumptions, the effective area between all samples is assumed identical. For the purposes of demonstrating the impact of twist on the performance of TBCs, this is sufficient. Therefore, all plots and properties are reported in terms of applied load, rather than a calculated stress.
The elastic modulus of each sample was determined through a least-squares linear regression of the data over a range of predetermined strain values. It was found that the range of 0.3%–0.6% strain was optimal for the samples, as it fell well below the proportional limit yet above any error from start-up slack in testing. After checking for goodness of fit for the elastic modulus regression, the samples were shifted to correct for strain offset such that the linear fit passed through the origin of the load–strain curve, to ensure good fitting of the Ramberg–Osgood equation. The offset strain and load are calculated by extending a line parallel to the calculated modulus originating at the 0.5% offset point. The point of intersect with the stress–strain curve is recorded as the offset load and offset strain of the sample.
The linear regression is performed for log of stress versus the log of excess strain using the built-in linear regression function in MATLAB (MATLAB R2017a; MathWorks Inc.). The regression is limited to strains above the linear fit region as determined by the prescribed upper bound, stresses above the proportional limit, and stresses below the load offset. The fit is optimized by minimizing the root mean square error (RMSE) of the regression.
Results
For each sample, the results from MATLAB were tabulated in Excel (Excel 2010; Microsoft Corporation, Redmond, WA, USA). Samples were grouped by twist treatment (zero twist, half twist, and full twist) and analyzed using a single-factor analysis of variance (ANOVA) with Tukey’s post hoc honest significant difference (HSD) test where appropriate. That is, if the single-factor ANOVA indicated a significant difference between groupings, then and only then was the post hoc analysis performed, to avoid any misleading conclusions.
DIC results
Since a constant rate of extension was used for all testing, virtual strain gauge results were used primarily to confirm the strain rate of the tensile tests. For the purposes of the current study, only the global strain from the virtual strain gauge was used. From a qualitative perspective, the DIC strain map provides insight into the possible failure mechanism. A sequence of strain overlays of one of the full twist samples is provided in Figure 7.

Strain map overlay of maximum normal strain for a full twist sample. Scale is from 0% (blue) to 7% (red) maximum normal strain. Numbers correspond to markers in Figure 8.
In the progression of strain overlays shown in Figure 7, there is a concentration of strain throughout the sample associated with the resin-rich regions of the sample. By image 3, the effect is quite pronounced throughout the braid structure. In image 4, at approximately 2.5% strain, a concentration of strain can be seen along the direction of the braiding yarns. This strain concentration quickly exceeds the scale used in the strain map and is the origin of failure for the sample. When compared to the stress–strain curve for the sample as shown in Figure 8, it can be seen that there is relatively no change in stress between image 4 and 5, and the load capacity of the sample remains constant. This localized failure is analogous to the necking behavior seen in ductile solids, such as steel, and explains the nonlinear deformation that occurs in the material.

Plot of stress–strain curve for full twist sample. Markers correspond to the strain map overlays shown previously in Figure 7.
Although Figures 7 and 8 are for a full twist sample, this behavior was seen throughout all of the samples tested, regardless of twist treatment or material. The only difference noted was that the half-twisted samples showed a tendency to exhibit strain concentration across a single diagonal direction, as shown in Figure 9.
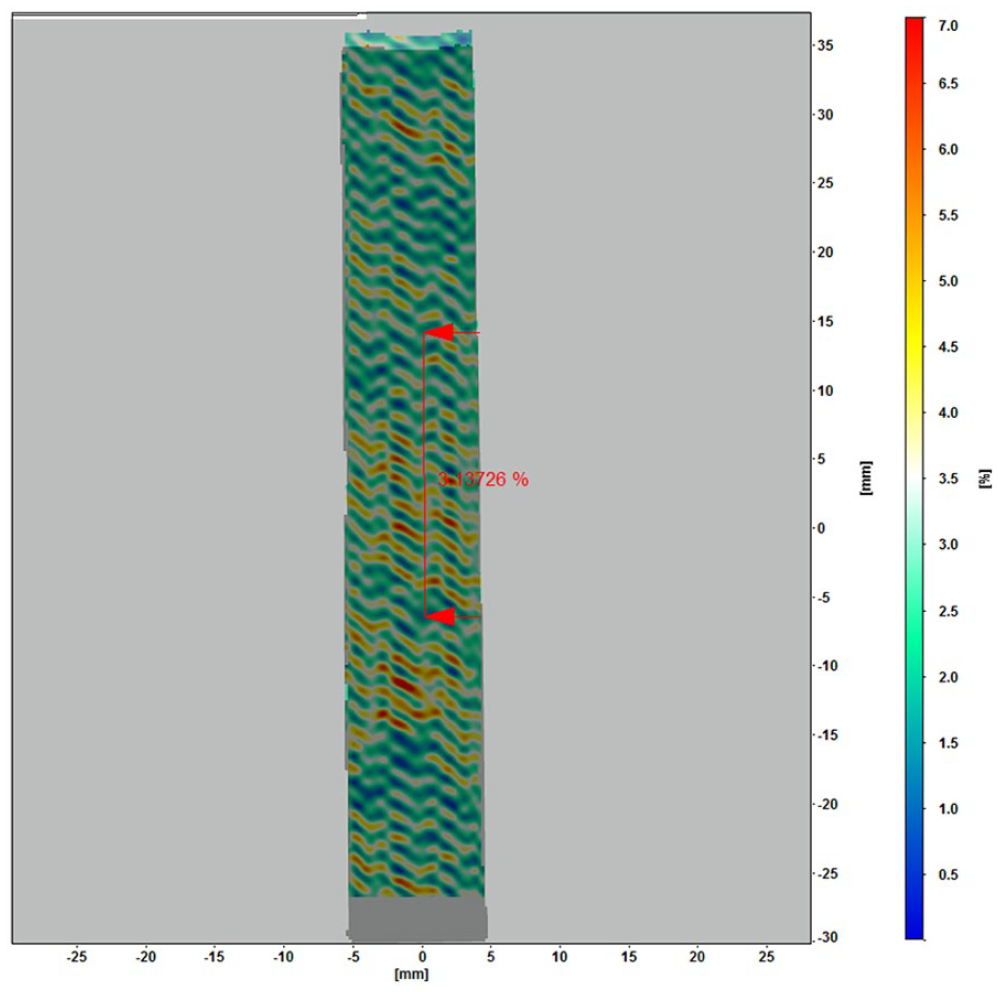
Strain map overlay for half twist sample. Note the concentration of strain occurs primarily in one diagonal direction. Color map scale indicates longitudinal strain from 0% (blue) to 7% (red).
Tensile properties
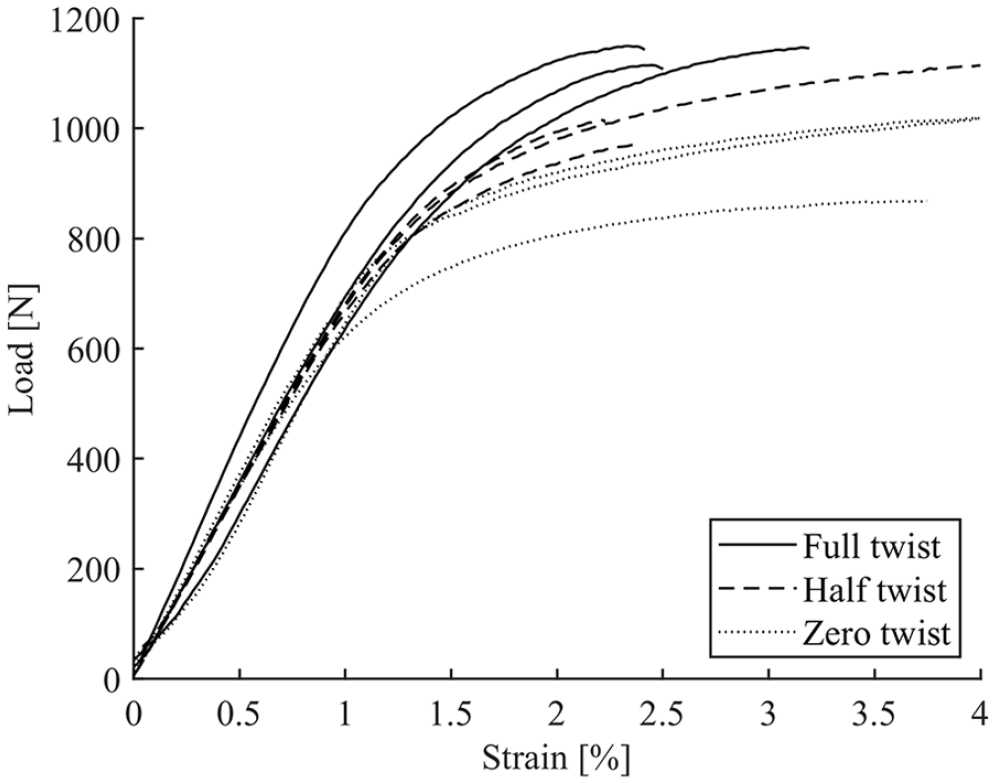
The load–strain results for each sample were plotted as shown in Figures 10 and 11.
Load–strain plot of representative Kevlar samples at full, half, and zero twists.

Load–strain plot of representative BioMid samples at full, half, and zero twists.
Initial elastic modulus, offset strain, and offset load were determined for each sample and grouped according to the twist treatment, as shown in Table 2 (Kevlar 49) and Table 3 (BioMid).
Summary of results for Kevlar 49 twisted tubular braided composites.

Statistical significance between twist groupings (α < 0.05) is denoted as follows: abetween Zero and Half, bbetween Zero and Full, and cbetween Half and Full.
Summary of results for BioMid twisted tubular braided composites.
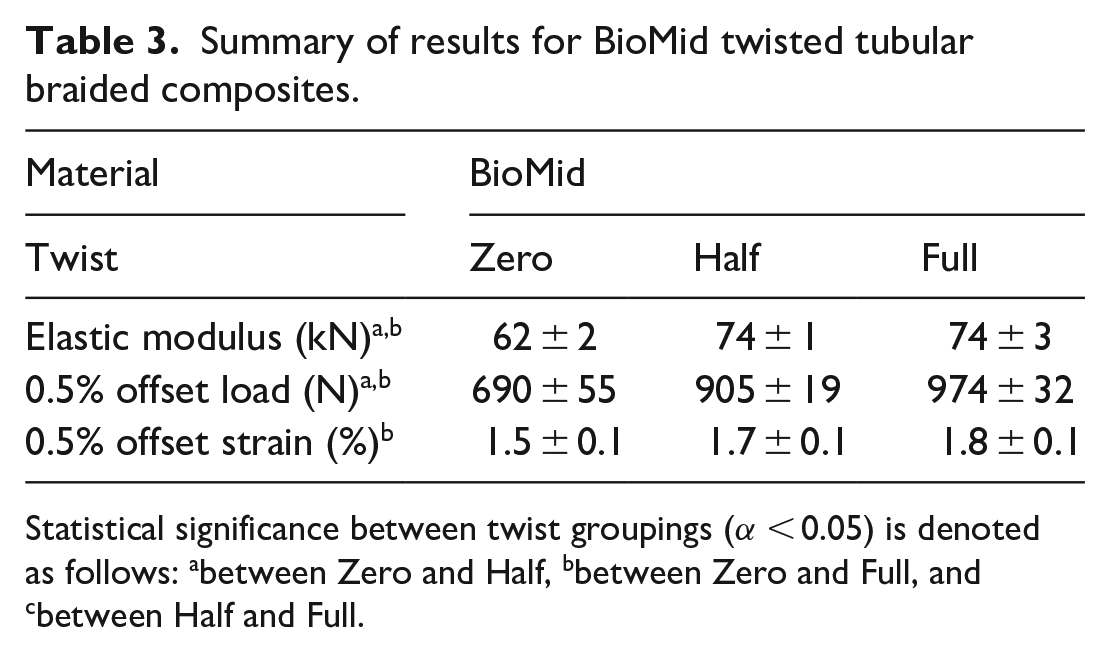
Statistical significance between twist groupings (α < 0.05) is denoted as follows: abetween Zero and Half, bbetween Zero and Full, and cbetween Half and Full.
The load–strain results for each sample were analyzed up to the point where the braid necking occurred. The longitudinal elastic modulus was determined through linear regression in the elastic region and was used to determine the strain offsets. Results were grouped by twist and compared to determine the significance of the twist treatment. A single-factor ANOVA was carried out with the three groupings of each sample, tested at a significance of
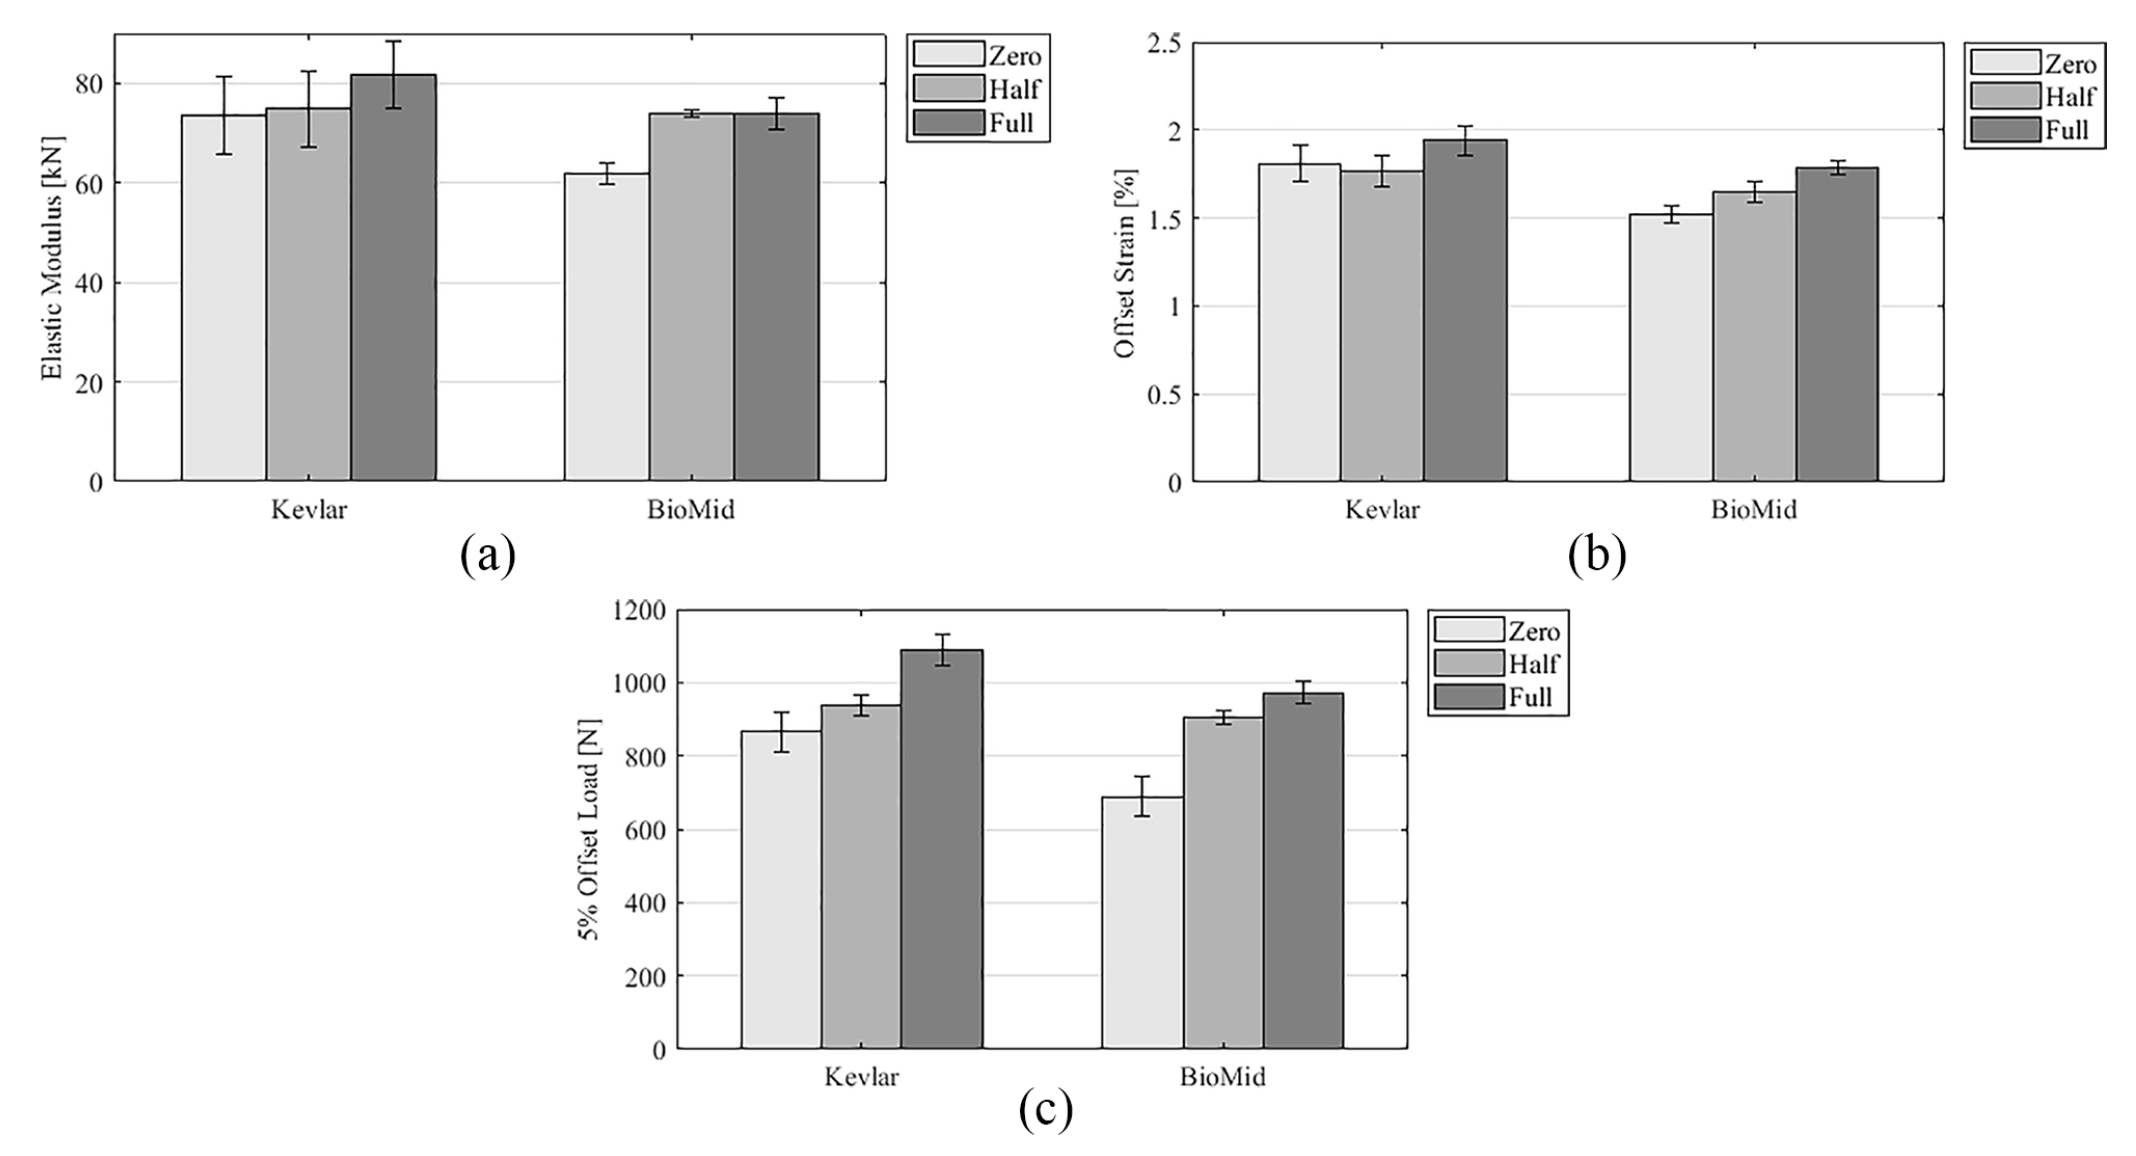
Bar plots: (a) elastic modulus, (b) offset strain, and (c) offset load for all samples. Error plots scaled to the standard deviation for the grouping and offset taken at 0.5%.
The inclusion of twisted yarns increased the elastic modulus, offset strain, and offset load for all samples, although most notably the load capacity at offset increased with added twist for Kevlar (p < 0.03) and BioMid (p < 7E–5) samples. There was insufficient evidence as to any significant difference between the half- and full-twisted TBCs, but what the results do show is that there is an increase in load capacity for all twisted samples, regardless of the amount (half or full) added.
Predicting post-linear-elastic region behavior
For each sample, the elastic modulus, yield stress, yield strain, and Ramberg–Osgood model parameters were determined as described previously. The results are given for the representative untwisted Kevlar sample K-0-3. Figure 13 shows the complete graphical results for the analysis. The results for sample K-0-3 are compiled in Table 4.
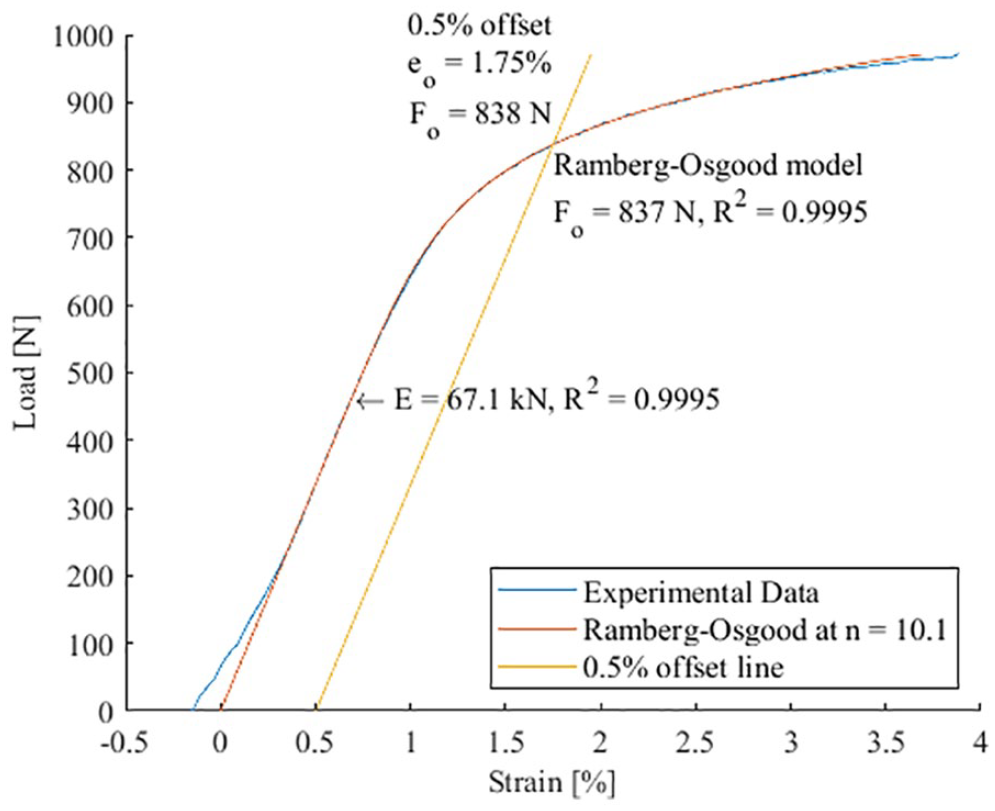
Plot of experimental data, 0.5% offset yield estimate, and Ramberg–Osgood model determined through regression for sample K-0-3.
Fitted parameters for sample K-0-3.

Note that the fit for the linear and plastic regions is very good. Each of the samples was grouped according to their twist treatment and compared for significance at a level of
Summary of means and standard deviations for fitted Ramberg–Osgood exponent across all sample groupings.

Statistical significance between twist groupings (α < 0.05) is denoted as follows: abetween Zero and Half, bbetween Zero and Full, and cbetween Half and Full.
All of the fitted models showed good adherence to the experimental results in the pre-offset regions, but post-offset behavior varied slightly from sample to sample, with some sample over- or underestimating the load capacity after the offset point. This modeling approach has no means of accounting for this behavior. However, the results overall represented the load capacity well until a decrease in load began to occur, due to the scissoring of yarns.
Discussion
Manufacturing observations
A few key differences were noted during the preparation of the twisted TBCs. During braid manufacture, the addition of twist reduced yarn hairiness of the yarn by increasing lateral cohesion of the individual filaments, 26 as shown in Figure 14.

Image of untwisted and twisted yarns in braid yarn carriers highlighting change in filament cohesion.
Without twist, individual straying filaments tended to get caught within the braiding machine, halting production. This may also be a safety precaution for future braiding operations with multifilament yarns. Next, it was noted that the shape of the yarns during the braiding process also changed. Rather than take the flat, ribbon-like shape of a typical multifilament yarn, again the increased lateral cohesion can be noted as the yarn seems to take a more elliptical cross section, as shown in Figure 15.
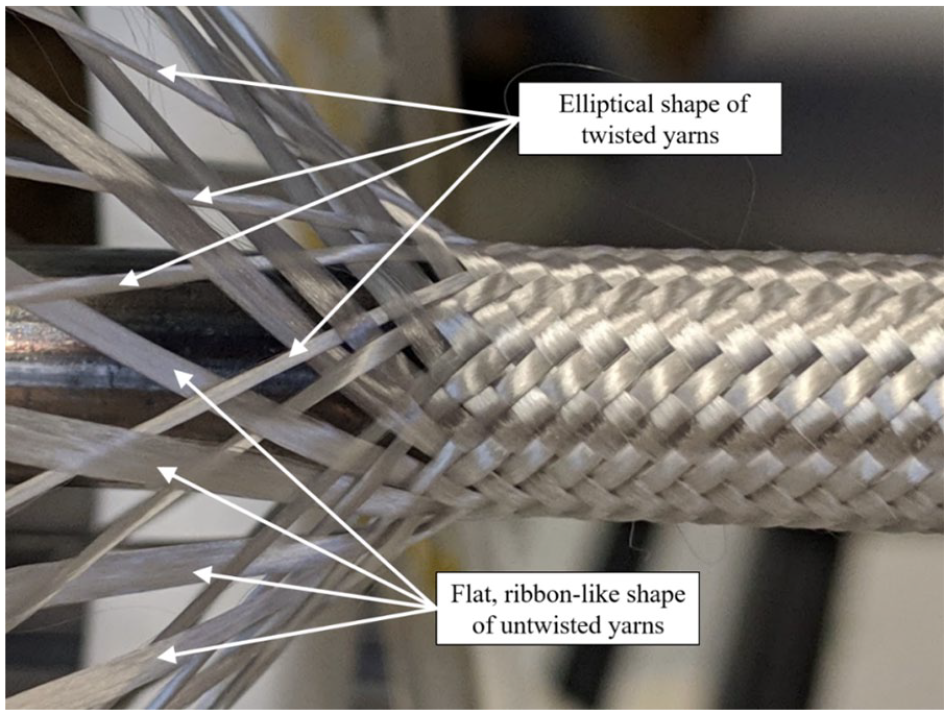
Image of braided yarns and interlacing region highlighting change in cross-section.
Finally, it was also noted that the overall appearance of the preform changed as well due to the change in yarn shape. An increase in the size of gap regions was present, as shown in Figure 16.

Image of twisted and untwisted braided preforms highlighting increase in gap regions.
The formation of these gap regions in the braided preforms indicates the existence of resin-rich interyarn gap regions in the cured TBC. Previous studies have shown that these interyarn gap regions have a significant effect on the mechanical performance of composites, 27 and work to determine the impact of these regions on TBC strength is ongoing.
Geometric properties
The manufacturing process of the braids was consistent for both twisted and untwisted samples. The braid angle selected was far from the jamming limit of the yarns, and thus the reduction in yarn area had no impact on the braid angle beyond typically measured variability of 3° to 5°. 23 As well, each specimen was measured prior to testing. It was found that the measured wall thickness increased based on the manufacturing technique. However, it is proposed that this was most likely due to the raised profile of the twisted yarns rather than an actual increase in wall thickness. A submersion test would be required in order to determine the change in volume and thus, the change in wall thickness. The fiber volume fraction is assumed to be constant for composites with twisted or untwisted yarns. 28
Mechanical properties
In addition to manufacturing handling during manufacture, the addition of twist had a significant effect on the load capacity of the TBCs. Prior to testing, it was predicted that a slight decrease in stiffness and increase in strength were feasible, since this has been shown to be the case in both twisted dry yarns and twisted composite yarns.6,9 The elastic modulus did not decrease, and in fact increased slightly with the addition of twist. The increase in strain at offset is proposed to be related to the angled offset of the filaments, due to the relative stiffnesses of the filament and matrix constituents. So long as the yield strength of the constituents is not surpassed, it can be expected to see an increase in strain, given the matrix constituent has a lower stiffness than the filaments.
The most surprising result was that of the increase of nearly 40% in load capacity with respect to the added twist. Although load capacity is not directly comparable to strength, but nonetheless similar, previous analytical models of plain weave composites have predicted no significant change in strength when using twisted strands, 11 but these results show otherwise. Both the half- and full-twisted samples had a significant (p < 0.03) increase in load capacity at offset over the untwisted samples.
Although twist improved the load capacity of TBC, the phenomenon is not solely related to an increase in strength of the individual braiding yarn. In a previous work, there was a notable increase in breaking strength of the dry yarn with respect to increased twist reported. 25 It is proposed that the increase in strength is due to the increased filament cohesion within the braiding yarns, localizing any microdamage that may occur due to failure of an individual filament or debonding of the filament–matrix interface. 8 Further work is required to confirm both the mechanism of failure in these TBCs and the specific impact of twisted yarns in these structures.
Predicting post-linear-elastic region behavior
As demonstrated prior, the Ramberg–Osgood equation seems to be a good candidate for predicting the post-elastic behavior in TBCs. All the fitted models showed good adherence to the experimental results in the pre-offset regions. Future work should focus on not only extending this model but also developing a predictive model based on TBC properties and manufacturing characteristics, such as materials, braid geometry, and yarn twist.
Conclusion
TBCs were manufactured with low levels of twist added to individual braiding yarns and statically tested in tension. Small changes in longitudinal modulus and strain at offset load were observed, but most notably there was a significant increase in the tensile load capacity (p < 0.03) for all TBCs containing twist, and for the BioMid TBCs this was an increase of about 40% over the untwisted preparations. The twist also improved yarn handling and process safety during the multifilament braiding operation by preventing filament wandering. It is suggested that yarn twist be added to other multifilament textile composites in situations where improved load capacity is desired. In addition, a linear fit and the Ramberg–Osgood equation were used to develop and fit a descriptive model for a portion of the TBC load–strain curve. Higher levels of twist resulted in a decrease in the Ramberg–Osgood exponent, improving the load capacity in the low-strain regions.
The Ramberg–Osgood equation is a good candidate for modeling the post-elastic behavior of TBCs. Three parameters are required for modeling: the linear-elastic modulus, the offset load and strain, and the shape parameter (or Ramberg–Osgood exponent). The shape parameter is dependent on the yarn material and the presence of twist in TBCs. Prediction of the elastic modulus of TBCs has been well documented, and future efforts should focus on predicting the load capacity and behavior of these structures.
Footnotes
Appendix 1
Declaration of conflicting interests
The author(s) declared no potential conflicts of interest with respect to the research, authorship, and/or publication of this article.
Funding
The author(s) received no financial support for the research, authorship, and/or publication of this article.