
Abstract
Plant fiber reinforced hybrid polymer composites have had broad applications recently because of their lower cost advantages, lower weight, and biodegradable nature. The present work studies the influence of reinforcing giant reed fiber concentration in polyethylene terephthalate (PET) polymer for their physical, mechanical, and thermal characteristics and determines the optimum loading of giant reed fiber using an artificial neural network (ANN) scheme. Giant reed fiber reinforced PET matrix laminates were manufactured from compression molding with different fiber loadings such as 5 wt.%, 10 wt.%, and 20 wt.%. The mechanical characteristics such as tensile and flexural strength and the laminate’s tensile and flexural modulus were appraised and examined. The maximum value of tensile strength, flexural strength, tensile modulus, and flexural modulus were 5.4 MPa, 26 MPa, 8343 MPa, and 6300 MPa, respectively, for PET2 (10 wt.% of giant reed fiber in PET polymer) composite. Fiber pullout, gaps, and fracture behavior were examined from a scanning electron microscope in the microstructural analysis. A machine learning technique has been recommended to combine artificial intelligence while designing giant reed fiber reinforced polymeric laminates. Using the suggested method, an ANN model has been generated to attain the targeted giant reed fiber concentration for PET composite while gratifying the necessary targeted characteristics. The developed method is very effective and decreases the effort and time of material characterization for huge specimens. It will support the researchers in designing their forthcoming test efficiently.
Introduction
Plant fiber reinforced laminates have been broadly investigated because of their positive environmental effect and particular characteristics. Using vegetable-based fibers in synthetic fabrics such as Kevlar, carbon, or glass exhibits many benefits like reduced energy consumption, safe handling, highly abundant, low-cost processing, and manufacturing.1–5 Many scientists recommended utilizing less commercial plant fibers like ferula, giant reed, sansevieria, and artichoke as reinforcement material to the polymer composites.6–8 The novel fibers separated from the giant reed leaf (Arundo donax L) are examined as a possible reinforcement to the polymer laminates. The reed fibers were applied as a building material in different Mediterranean nations. In the south region of Alicante, it was involved in all construction and building applications up to the inception of the 20th century, primarily producing as floor and roof. It was promoted to be utilized in short isolated houses and farm construction until the 1960s. 9 The giant reed fiber is a chronic rhizomatous grass, broadly dispersed throughout the world, from the temperate zones of Europe to the eastern countries like India, Japan, and China, because it can be easily modified in different climatic zones. However, a possibly high-yielding non-food plant is applied to generate paper pulp and energy. 10 Also, the giant reed fiber expands naturally and is vast, and gratitude to its higher growth rate presents nosy components that clearance outcome to be complex. It was presently studied for the fabrication of chipboard panels’ alternate material to the wood-based composites 11 and utilized as reinforcement to thermoplastic 12 and thermoset 13 polymer composites which can substitute in sand concrete mixtures. 14 Arundo donax L. has exhibited the considerable potential to be applied as reinforcement in polymer laminates. Recently, these fibers can also be involved in the generation of biomass, biogas, furniture, papers, forage feedstock, construction, building materials, etc. The utilization of these unwanted offers a combined value to the usage of renewable materials as a procedure for regulating these breeds could be defined as a complete utilization of the wastes created in these operations.
As established, plant fibers can be applied as reinforcement material to polymer composites, have attained interest, maturing to their particular characteristics, recyclability, benefits for health, and cost. Because of the reasons mentioned above, plant fibers were applied as reinforcement to composites for different engineering applications.15–20 In general, Yan et al. 21 examined the flexural characteristics (four and three-point bend) of coir fiber and concrete incorporated concrete beams strengthened from flax fabric-based plastics. The experimental outcomes exhibited that the fracture energy, flexural strength, peak load, and deflection of neat concrete and coir incorporated concrete improved with incrementing repression flax layers. Yan and Chow 22 investigated the lateral crushing characteristics of empty and polyurethane-foam reinforced flax fabric included epoxy laminate tubes as formulation of foam filler, tube diameter, and thickness of tube. 23 While comparing with the existing tubes, flax/epoxy tubes can be employed as a better substitution to glass/carbon composite tubes and aluminum tubes as an energy absorber.
Polyethylene terephthalate, generally termed polyethylene terephthalate (PET), is produced from ethylene glycol and terephthalic acid and possesses a long chain network. It exhibits both semi-crystalline and amorphous behavior.24,25 The PET is effectively applied from the different packaging industries, such as containers and bottles for food and other commercial products. Recently, PET has begun to utilize extruded articles and injection-molded, mainly for reinforcement with synthetic fabrics that cannot deteriorate outside climatic conditions. Hence, incrementing attention has been targeted on recycling polymer wastes, specifically PET, for these different applications that avert environmental pollution. 25 The importance of recycling indeed is not only for economic but also for ecological principles. Hence, other techniques for the recycling of polymer-based waste components have been developed. The recycling preference for PET can be classified into three types: chemical recycling, energy recovery, and mechanical recycling.26,27 For economic reasons, mechanical recycling in PET material has become more essential than the chemical recycling technique.
Similarly, the isolation of PET from polymer waste flow is very time-consuming and expensive. 28 Huq et al. 29 manufactured and investigated the mechanical characteristics of jute incorporated PET laminates and observed tensile strength of 58 MPa. It is observed that most of the investigations have been performed on thermosetting plastics as a matrix to examine specific characteristics while producing composite laminate. Using the flat-press technique, Rahman et al. investigated composite laminate manufacturing from recycled polyethylene terephthalate and wood sawdust filler under different proportions. It was observed that the modulus of elasticity and rigidity were attained to the highest for the manufactured laminates, where the wood filler dust concentration was 40%. Nayak and Khuntia 30 fabricated by reinforcing Moringa oleifera fruit fibers with PET polymer, and their mechanical, thermal, and morphological characteristics were studied. It was examined that the composites manufactured from 20 wt.% of fiber exhibits higher mechanical and thermal characteristics when compared with other combinations of composites. This type of giant fiber reinforced PET polymer composite can be applied in construction and building materials, storage equipment, structural parts of automobiles, marine, and food packing applications. The primary issues of these PET polymer composites possess phase separation and weaker adhesion interfaces. These constituents are immiscible, which tend to have high interfacial tension with bad chemical and physical characteristics.
Artificial Neural Network (ANN) is a kind of mathematical modeling favorable for effectively examining the interaction between huge sets of outputs and inputs with broad utilization in processing the material. 31 Artificial Neural Network has exhibited a rigid scheme for modeling nonlinear structures for many years, specifically chemically organized. 32 The most coveted advantage of ANN is its capability to model multidimensional, nonlinear, and complex formulations without assuming anything about the behavior of the relationship.33,34 It supports raising understanding of highly uncertain schemes and aiding in the possible prediction of their future outcomes by producing a consistent mechanism in materials science research. It has been applied in different research sectors, including material structure, process modeling, optimization, and regression.35,36 Artificial Neural Network is efficient in the characteristic-structure examination of plastics depend on the limited quantity of measurement outcomes. 37 An intelligent computational scheme’s commitment supports the reduction of custom experimental characteristics in new plastic advancement. 38 This procedure is employed to determine the time-exhausting issue that usually attains using recommending optimum filler constituents to estimate polymer laminates’ best physical and mechanical characteristics. Artificial Neural Network prediction method is an average of decreasing huge scale laboratory quantification. The procedures of ANN have their source from the performances of the human nervous schemes. It requires information like the human brain in a learning system and stocks this data using the synaptic weight interneuron network. The ANN scheme is classified into three dimensions: output, hidden, and input layers. 39 Artificial Neural Network consists of the nodes (neurons) arranged in layers, weighted networks between the activation function and nodes. 32 Artificial Neural Network has been applied to conclude in fabricating techniques emerging material characteristics vis input characteristics of operational factors and material constituents. This technique has been applied in different composites to acknowledge laminate-related issues like inter-relationship between parameters in a fabricating technique to the life cycle forecast of the laminate. 40 The ANN has been affirmed by different investigations as a beneficial mathematical formulation in plastic-based laminate. Bayraktar et al. 41 created the three-dimensional printed plastic components and optimized the mechanical characteristics using the ANNs model. The specimen was fabricated using polylactic acid. The test performed mainly depended on raster arrangement orientation, values of thickness, and ranged melt temperature. The best-operating formulation has R squared values of 0.999,997 and 0.999,199 for training and testing, respectively, with a cross raster scheme. The outcome evident the effectiveness of ANN formulation in estimating the optimum weight percentage of the various Poly Vinyl Chloride (PVC) laminate components to attain the acquired laminate characteristic. The ANN modeling and experimental process were also examined in Vineela et al. 40 on the tensile strength of special fiber laminate composed of epoxy polymer, carbon, and glass fabrics. The volume proportion of the precise carbon fibers is the input parameter, and six neurons are applied in the hidden layer and the outputs as tensile strength. Two data sets for testing, two for validation, and four data sets were applied as input parameters in this context. The training set has overall R and correlation coefficient values of 0.49 and 0.49, respectively. The non-availability of sufficient information is important for the broad discrepancy in both values of R. Khanam et al. 42 investigated the thermal and mechanical characteristics of Linear low-density polyethylene nanocomposites reinforced with 1–10 wt.% of graphene nanoparticles using ANN along with prediction and optimization. The processing was carried out from the screw extrusion process of varying speed. The optimization of mechanical and thermal characteristics was performed under different applied procedure cases via ANN. The outcomes of the ANN further confirm as a method to determine the material characteristics before manufacturing to save effort, time, and money. Therefore, it can be examined that ANN was a beneficial tool for modeling the influence of certain crucial materials factors on the characteristics of polymer laminate, most specifically with a sufficient quantity of practical information. The back-reproduction neural network with a 3-5-1 structure was applied to determine abrasive wear characteristics of graphite-reinforced and unreinforced carbon fabric epoxy laminate under different testing cases. The LM (Levenberg Marquardt) confirms exceptional among the different network-operating methods established. A trained neural network and a well-predicted LM training program were established to forecast the wear rate as a formulation of sliding distance, normal load, filler concentration. 43 The predicted information is completely persistent when compared with the experimental outcomes. Prasad et al. 44 forecasted coconut fiber laminate’s three-point flexural, tensile, and microhardness test characteristics using ANN. The forecasted quantities were examined to contest the experimental results in their early investigation.
Many investigations have been observed on the forecast of the mechanical characteristics of nanocomposites using the factorial-based, genetic Algorithm, Taguchi, and response surface methodology models. 39 Furthermore, the utilization of the ANN forecasting method for Giant Reed fiber PET polymer composite has not been examined in any published literature. While comparing the other forecasting methods, ANN can investigate the hidden connection among the information without demanding any shield on the input parameters. The back reproduction method of the ANN supports reducing the forecasting error. Thus, the model can be enhanced using the iteration process. It also apprehends the complex and nonlinear connection between the input factors and changes it into the stated output. This study will aid the fabrication companies in utilizing the ANN methods to forecast material characteristics preceding laminate fabrication and advancement. It delivers a cost-efficient, reliable decision-making, and fast tool for the development of nanocomposites. It supports to preclude the complex problems associated in experimental decision to describe the interaction of consolidation of factors on the mechanical and thermal characteristics of giant reed fiber reinforced PET laminate products after the fabrication. In contrast, PET thermoplastics have various benefits like high-cost performance ratio, higher resistance to fatigue, lower processing temperature, and good processability compared with thermosets. In addition, the capability to prevent chemical attacks and provide consequent decrements in smoke, toxicity, and flammability performance; because of the combined benefits of both plant fibers as reinforcement material and thermoplastic as a matrix, their laminates determine broad utilization in different sectors consisting of different types of reusable containers, plastic components, stationary components, textiles, laboratory equipment, automotive parts, and packaging materials. Considering the principles mentioned earlier, a method has been developed for the polymer composite by incorporating giant reed fibers in the PET matrix. The reason may be assigned to a lower price and higher performance and applied as a sheet, fiber, and packaging matter with good electrical insulation, hardness, rigidity, solvent, and abrasion resistance.45,46 The present investigation aims to interpret the usefulness of low-environmental impact and bio-based laminates incorporated with fibers separated from the leaf of Arundo Donax L. The addition of these fibers is convenient to enhance the mechanical properties and decrease the cost of the fabricating material because it is readily abundant throughout the world. A scanning electron microscope (SEM) observed the morphology of interfacial bonding between the PET matrix and Giant reed fiber kept from an SEM image.
Materials and methods
Extraction of giant reed fiber
The Arundo donax L (giant reed fiber) contains culm that grows till 6 m, where the leaves are placed in every internode of 10–30 cm space, and every culm hoists up to 25 leaves. However, every leaf can attain 80 cm and 7 cm of length and width, respectively.
47
In this investigation, leaves ranging from 22 to 24 cm were isolated from the culms promptly after gathering the new species from a plantation in Presidency University, Banglore, Karnataka, India. Then, reed fibers (density of single giant reed fiber as 693.25 kg/m3) of length between 18 and 22 cm with a diameter of 2.5 mm were separated from the leaf by mechanical carding machine from conventional combing technique with a metal teeth cross-section brush. The SEM image of extracted giant reed fiber is shown in Figure 1. The collected fibers were then dried in a heating furnace at 105°C for 5 h to reduce the internal moisture content. The giant reed fiber was utilized without any chemical surface modification and reinforced in its native form. For this condition, the fiber diameters extracted from the leaf of giant reed fiber were evaluated from optical examination with the help of polarized optical microscope model DP72 at 10 different positions and the single thread. The possible cross-sectional area of every fiber was then estimated by assigning a circular cross-section and, as observed from the literature .48,49 Scanning electron microscope microstructure of giant reed fiber.
Fabrication of giant reed fiber/PET composites
Non-woven networks of PET (tensile strength of 35 MPa, melt flow index of 3.3 g/10 min, and density of 0.9 g/cm3) were applied as a matrix of the polymer composites. The PET was procured from Indian Oil Corporation Limited, Bangalore, Karnataka, India. Four types of PET laminates were fabricated by varying the fiber concentration as 5, 10, and 20 wt.%, and the length of randomly oriented fibers was between 10 and 12 cm. Aluminum foil has been used on the top and bottom of the die to avoid sticking on the compression mold. Three layers of PET web and two giant reed fibers (layers have been stacked together, as presented in Figure 2. Fabrication of giant reed fiber-PET biocomposite.
Composite boards were fabricated by compression molding process; extracted carded fibers were impregnated with the PET matrix in a mold possessing dimensions of 300 × 300 × 3 mm with a pressure of 13.79 MPa and temperature of 180°C for 2 min. After the process, cold water of 20°C was passed into the compression mold to cool, and laminate was taken out. Later, a power hack saw machine would be samples of tensile, flexural, water absorption, Vickers hardness, thermal conductivity, and flame resistance characteristics. The fabricated composites can be denoted as PET, PET1, PET2, and PET3 for pure PET, reinforced 5, 10, and 20 wt.% of giant reed fiber.
Composite characterization
Physical properties
According to ASTM D 570 standard, a water absorption experiment was performed with a 76 × 26 mm sample size. The samples were examined by the process of 4 plus 24 h of soaking. Fiver samples of every laminate were measured at controlled room temperature by regulating the temperature of 24 ± 2°C with 60% relative humidity.
The micro Vickers hardness test measures the resistance or hardness of material to penetrate when little portions in a laminate specimen are examined. It can also offer detailed and accurate data about the surface characteristics of materials with a refined microstructure. The test was carried out at room temperature (24 ± 2°C) according to the ASTM D785 standard. The experiment was performed by setting the investigated specimen under the diamond indenter of the digital micro Vickers hardness tester with a resolution of 0.01 μm. Then, a force was given to the specimen using the indenter. The experiments were repeated 20 times, and an average value was calculated.
Mechanical properties
The tensile experiment was conducted according to ASTM D 638-14 standard in Universal Testing Machine, Instron, equipped with a 1 kN load cell with a 50 mm/min crosshead speed. The fabricated composite sample dimensions for the tensile test were 165 mm (length) × 19 mm (wide). The flexural sample of 203 mm (Length) × 76 mm (width) was carried and experimented with following ASTM D 790-15 standard with a 10 mm/min crosshead speed. The test was performed under a controlled room temperature of 24 ± 2°C and 55% of relative humidity. For tensile and flexural strength, 20 specimens have experimented with every case, and the average is reported. The experimented tensile and flexural samples are shown in Figure 3(a) and (b), respectively. Experimented giant reed fiber–PET composite (a) tensile and (b) flexural.
Morphological properties
The fabricated giant reed fiber–PET composites’ surface morphology and the flexural fracture were examined using a high-resolution Hitachi SU 3500 scanning electron microscope with an accelerating voltage of 15 kV. The samples were coated with gold–palladium and placed on the aluminum holder with carbon tape.
Thermal properties
The thermal conductivity of the specimens was determined using EKO thermal conductometer according to JS1412-2 standard. The specimen dimensions as 200 mm × 200 mm were experimented with, and the mean quantity was recorded under room temperature.
The UL-94 vertical burning experiment was evaluated as per the ASTM D 3801 standard from burning equipment. The sample’s dimension for this test was 125 mm × 13 mm s 1.6 mm, and the sample was placed vertically above the burning equipment and measured the time to extinguish reported. Also, any dripping of the sample was examined. Five samples were performed for every condition, and flammability ratings were ascribed depending on the period of self-extinguishing the flame. The various terminologies observed for specimen may not burn for more than 10 s, 30 s, and even more than that with some ashes as V0, V1, and V2, respectively.
The thermogravimetric analysis of pure PET, PET1, PET2, and PET3 composites specimen was performed with the TG 4000 equipment. During the experiment, temperature was ranged between 35 and 600°C with a heating rate of 15 °C/min under a nitrogen atmosphere.
Artificial neural network
Problem statement
Giant reed fiber is acknowledged as the filler to enhance the mechanical characteristics of polyethylene terephthalate composites. This material will be applied in automobile applications, especially for the crumple energy absorber equipment. 50 The material scientists must attain a combination of mechanical characteristics that will be adequate for the craved utilization. Conventionally, this method is adept by performing many experiments of the random samples. The product managers try to determine the proper filler concentration by estimating the physical, mechanical, and thermal characteristics like water absorption, flexural strength, modulus, tensile strength, modulus, Vickers hardness, and thermal conductivity for certain specimen giant reed fiber/PET composite. This process is complex and expensive. The primary issue is the non-linearity of the relationship between the examined physical, mechanical, and thermal characteristics. The present work exhibited here aims to promote an ANN model which can determine the optimum concentration of giant reed fiber in the PET laminate while considering the given physical, mechanical and thermal characteristics. The model is trained depending on the random experimental information of the giant reed fiber concentration PET laminate to generate a relationship between the physical, mechanical, and thermal characteristics.51,52 This will permit the selectors to do the inventive product design by eradicating the manual experimentation for all the available ranges. The generated model is helpful to determine the optimum filler concentration depending on the earlier investigation. The scientists can formulate their characterization method intelligently for approving the targeted characteristics as per the requirement of the product.
Configuration of ANN
Essential procedure for the development of ANN model
It is proved that attaining the targeted mechanical characteristics cited will not be a direct method by inspecting the information. The issue for the regression is the shortage of information, this classical optimization or regression techniques will not be applicable for this forecasting. At the same time, the ANN model has enough hidden layers that contain neurons that can be trained from proper learning methods like the backpropagation technique to achieve the activation and desired weight formulations that are the primary components for the model. The primary issue of constructing this model will be determining the appropriate structure like batch size, epoch, number of hidden layers, etc., of the generated model. In this type of machine learning, generally, the quantities of the factors such as bias, weights, and nodes are studied from the backpropagation and forward procedure.
Furthermore, there are undoubtedly other factors whose quantity is applied to regulate the learning method termed a hyper factor. It is essential to converge these nervous factors so that the generated ANN model can optimally clarify the issues from machine learning efficiently. The hyper factor tuning technique like a grid inspection in MATLAB can be applied to determine an adequate structure. Figure 4 exhibits the strategic procedures to generate the proposed ANN models and their performance experiments. The methods used to construct the appropriate ANN model for the designated work of this present investigation are briefed in the upcoming sections. To generate the ANN model depending on the collected experimental and material properties information, the three processes are observed: pre-processing of data, constructing and training the prediction models, and verifying the model. Procedure for Artificial Neural Network model development and prediction.
Pre-processing of information
Initially, the collected information must be pre-processed, and before that, it should be free from deviation like errors, outliers, and missing data information. Then, the characteristic separation is essential to analyze the independent parameters for the input models. In this condition, seven different characteristics (water absorption, tensile strength, tensile modulus, flexural strength, flexural modulus, Vickers hardness, and thermal conductivity) were established to forecast the dependent, giant reed parameters fiber concentration in the PET matrix. Hence, there will be seven input nodes and one output node in the input and output layers, respectively, as observed in Figure 5. After the pre-processing and selecting characteristics, separating the information set into the training and experiment is needed. In this condition, the fitting app (from nnstart) in MATLAB is applied for separating the information. The subdivision of training and testing is used to construct the model and utilize the model on unknown information respectively to determine the model’s performance. The layered scheme of Artificial Neural Network for predicting the optimal condition.
Constructing and training the forecasting models
The ANN model is developed from three different layers as input, output, and hidden, and the ANN model’s layered scheme is presented in Figure 5. The hidden layer contains two or more layers for its efficient utilization, and every layer includes many neural components. The bottom portion of the Figure 5 exhibits one neural feature and the interlink between the input


Validation of model
The trained ANN model should be checked with the validation from the experimental information that was initially extracted. In this condition, random 15% of data sets for testing and validation, and the remaining 70% is applied for training. It is observed that because of the shortage of data, the k-fold cross-verification technique was used for dividing the collected information into three sets, where a specific random selection for the combination of validation and train was utilized many times. The performance estimated observed from the kfold cross-verification was the mean of the values calculated from the loop. This method does not misuse lots of information that is a dominant benefit in issues like a reverse solution, where the quantity of specimen is comparably less. The generated ANN model to obtain the optimal amount of giant reed fiber in the forecasting period depends on the targeted physical, mechanical, and thermal characteristics. The information that includes targeted characteristics was provided into the model to observe whether it can determine the optimum content of the fabricated composite. The generated ANN model was applied many times to verify the predicted optimum giant reed fiber concentration’s reliability, robustness, accuracy, and precision. The estimated standard deviation exhibited how broadly quantities are distributed from the mean portion.
Statistical analysis
The statistical analysis has been carried out with IBM SPSS 2018 software to determine the significant difference between the mean characteristics of the fabricated giant reed fiber PET composites. A significant difference can be observed under the confidence level of 95%, with a probability value that should be less than 0.05.
Results and discussion
Effect on water absorption characteristics
Figure 6(a) exhibited the water absorption characteristics of the three different types of fabricated giant reed fiber PET composites. The graph recommends that water absorption pursues Fick’s law of diffusion that forecasts that the quantity of absorbed water improves straightly with the square root of time and finally maintains attaining equilibrium.
55
Fick’s law is generally applied to forecast the evolution of water absorption over a period because of its integrity and capability to explain the diffusion of water content in the laminate.
56
It is observed from Figure 6(b) that water absorption capacity incremented with the soaking time from 4 to 24 h. The trend affirms that the incrementing water absorption characteristics with fiber loading showed the PET3 composite highest water absorption of 25% after 4 h. The PET2 composites showed better water absorption capacity when compared with PET1 because of better interfacial bonding within the PET and giant reed fiber. After 24 h, the outcomes exhibit that giant reed fiber–PET composite signifies lower water absorption with 22%, 24%, and 38% for PET2, followed by PET1 and PET3 composites, respectively. The giant reed fiber–PET composites’ higher water absorption capacity indicates the micro-channel production, which assigns to the higher water absorption and offers water capability to transform through pores on the fiber surface.
57
This depends on the previous investigation of untreated outcomes for oil palm-based composites. It was examined that there was an identical tendency in water absorption capacity due to natural fiber’s hydrophilic behavior. To reduce the water absorption capacity, the sugarcane bagasse can be applied. Because of the wettability region, the compatible feature of sugarcane fiber enhances the fiber capillary principle for carrying the void an irregularity in the interface between giant reed fiber and PET matrix. It was examined that the loading of sugarcane fiber can compact the structure and reduce porosity and voids on the surface area of the laminates.
58
In this context, hybridization of fiber helps in reducing the moisture absorption in the laminate due to the voids replete during the manufacturing of PET laminate. As per Munoz et al., a large water absorption capacity was influenced by the higher exposed surface portion and higher gap of fiber resistance.
59
Physical properties of giant reed fiber–PET biocomposite (a) water absorption characteristics, (b) Water absorption, and Vickers Hardness.
Effect on Vickers hardness
Micro Vickers hardness is the characteristic of a material to prevent indentation, abrasion, and penetration. The calculated micro Vickers hardness quantities of the investigated specimens were given in Figure 6(b). From these outcomes, the specimen PET2 exhibits the highest hardness value among all the fabricated specimens. The micro Vickers hardness of the PET2 is 15.79% greater than the PET3 and PET1 composites. The addition of 10 wt.% of giant reed fiber in the PET polymer improves the PET polymer’s cross-linking density, limiting the movement of the polymeric network and concluded in incremented hardness value.60,61
Further addition of giant reed fiber up to 20 wt.% decreases micro Vickers hardness since giant reed fiber reinforcement at an adequately higher concentration obstructs the cross-linking of a PET polymeric network, as was observed from other investigators.62–64 Possibly, the reduction in the micro Vickers hardness can be assigned to the non-uniformity of giant reed fiber reinforcement in the laminates and the gap production during the specimen production of the laminates with a higher concentration of giant reed fiber.65,66
Effect on mechanical properties
The effect of giant reed fiber concentration on tensile and flexural characteristics of PET composites was evaluated, and the stress–strain graphs are presented in Figure 7(a) and (c), respectively. The tensile and flexural strength of the laminates was improved by incrementing the concentration of giant reed fiber. The higher tensile and flexural strength at 10 wt.% of giant reed fiber was 5.4 MPa and 26 MPa, respectively. The tensile and flexural modulus of the laminates also followed the same trend as tensile and flexural strength. The laminates’ highest tensile and flexural modulus were 8343 and 6300 MPa, respectively, as shown in Figure 7(b) and (d). The highest values of mechanical characteristics exhibited by 10 wt.% of fiber loading laminate may be explained in terms of homogeneity and fibers’ orientation within the PET matrix. In this condition, PET fibers attain the most significant mix uniformly and orientation within the PET polymer. When the force is applied, stress is homogeneously dispersed among the giant reed fiber. Under lower fiber concentration, insufficient giant reed fiber shares lower load transfer capability among the matrix. As an outcome, accumulation of strength happens at various laminate points, and strains are also observed highly in the PET matrix.67,68 This shares bad mechanical characteristics of the laminates under a lower concentration of giant reed fiber. Agglomeration occurred within the PET matrix under a higher level of giant reed fiber, creating non-uniform stress transfer capability. Besides, various giant reed fiber ends develop micro-crack production at the interface. As an outcome, the laminate’s modulus and strength were reduced again.69,70 This study shows that the giant reed fiber can be applied as a reinforcement to the PET matrix under lower loading conditions for the enhancement in the mechanical properties of the composites. Mechanical properties of giant reed fiber–PET biocomposite (a) Tensile stress–strain, (b) Tensile properties, (c) Flexural stress-strain, and (d) Flexural properties.
Figure 8(a)–(c) presents the SEM micrographs of flexural fracture of the sample PET1, PET2, and PET3, respectively. Figure 8(a) exhibited that the surface of 5 wt.% of giant reed fiber composites showing more holes, void, smoother texture, and fiber breakage from the matrix when the force is applied, which leads to poor interfacial bonding within the PET and giant reed fiber. From this poor interfacial bonding, the composite possesses lower tensile and flexural characteristics. The PET2 laminate showed a surface fracture and fiber pullout, which depicts the better interfacial adhesion between the giant reed fiber and PET matrix (Figure 8 (b)), which improved the flexural and tensile strength of the composite. Figure 8(c) depicts the fiber pullout, gaps, weaker interfacial adhesion bonding between the giant reed fiber and PET matrix, which reduced the tensile and flexural characteristics.
71
Flexural fracture of giant reed fiber–PET biocomposite (a) PET1, (b) PET2, and (c) PET3. PET: polyethylene terephthalate.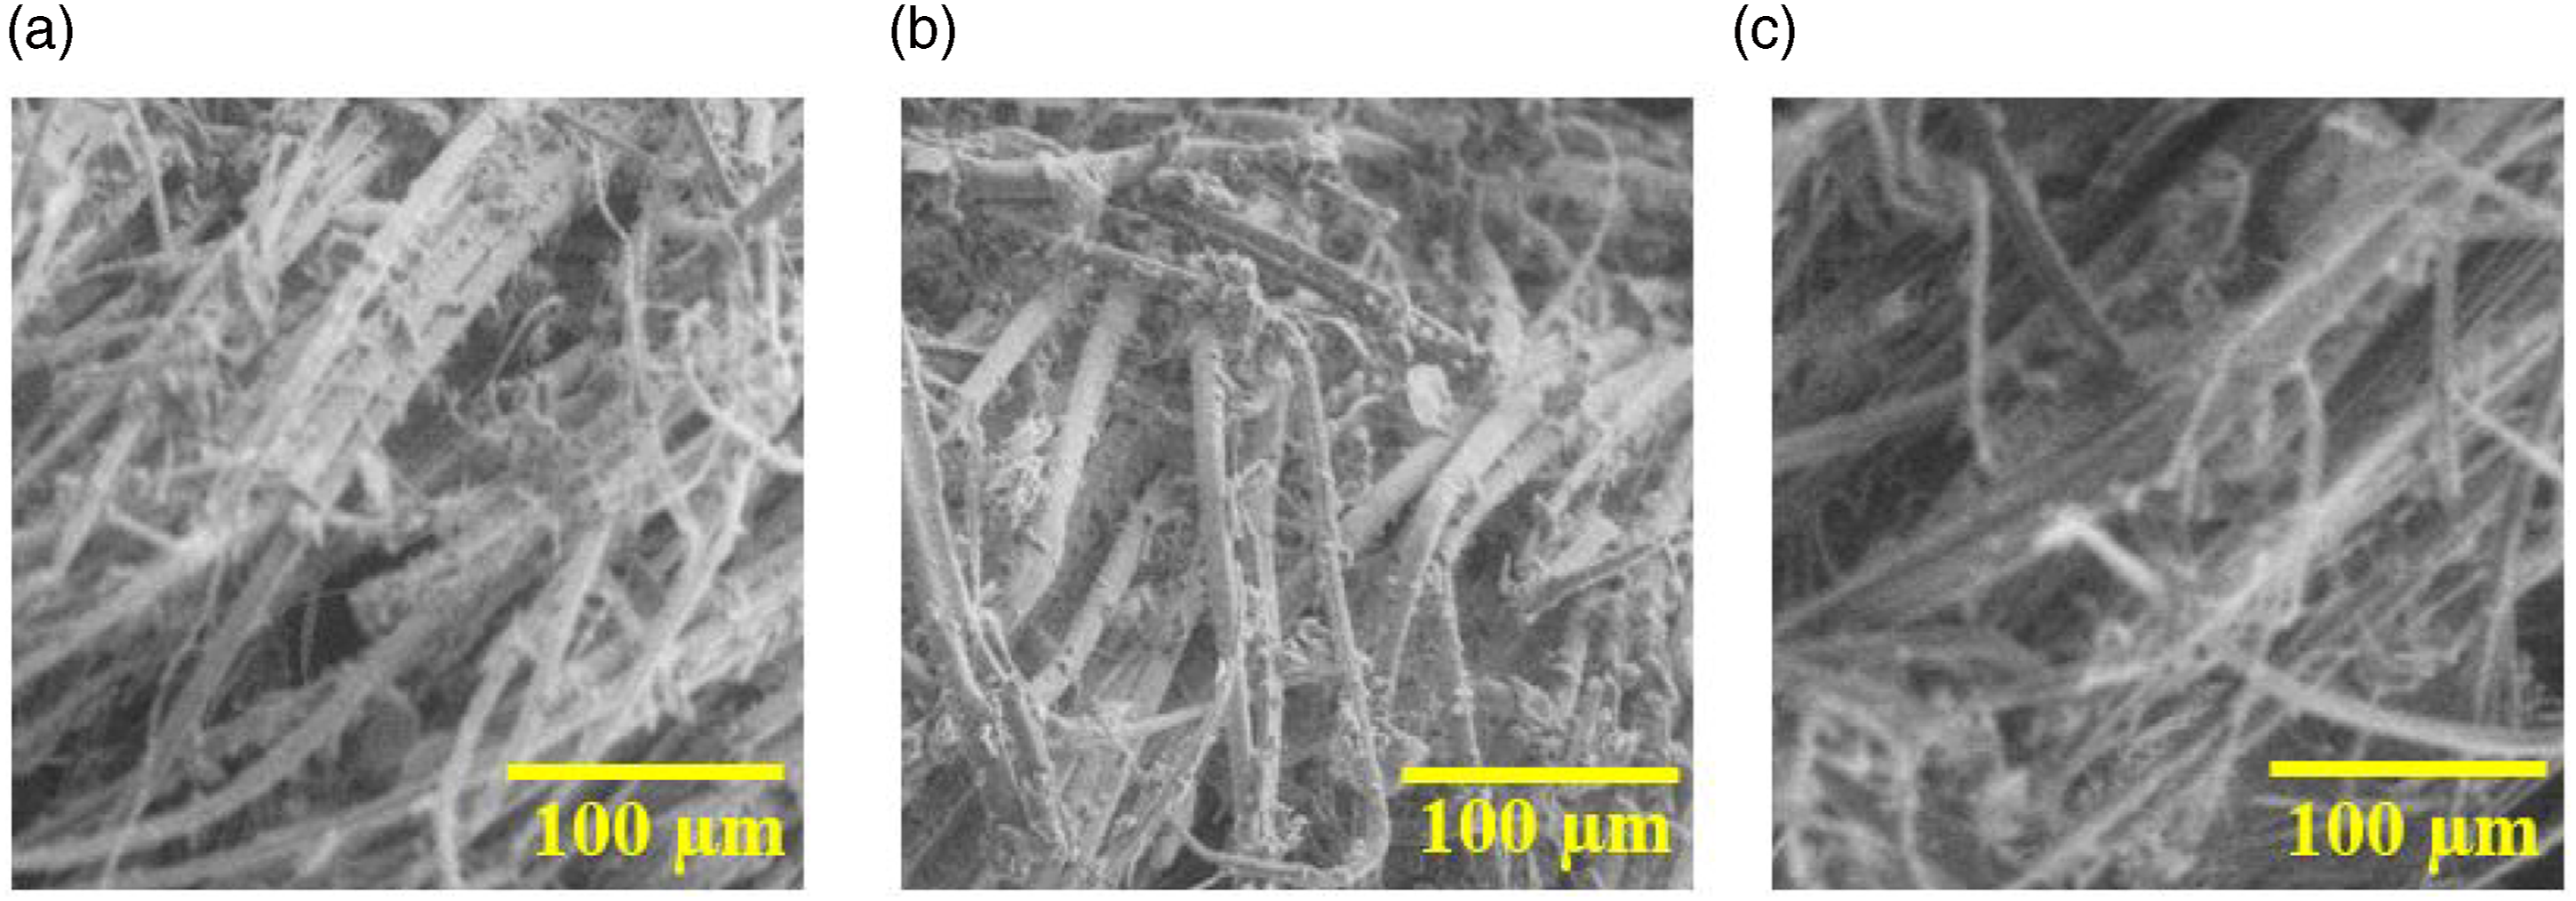
Effect on thermal characteristics
Thermal conductivity
The thermal conductivity of PET laminates under different fiber concentrations of 5 wt.%, 10 wt.%, and 20 wt.% is presented in Figure 9. The PET3 composite exhibits a thermal conductivity of 0.139 W/mK, similar to the quantities examined by other investigators.72,73 The thermal conductivity of PET laminates improved with the loading of 10 wt.% of giant reed fiber in the PET polymer. Under the maximum concentration of 20 wt.% of giant reed fiber, the thermal conductivity attained 0.199 W/mK lower than 4.78% of the PET2 composite. The thermal conductivity achieved 0.209 W/mK at 10 wt.% of giant reed fiber improved by 50.36% compared with PET3 composite. This can be described that giant reed fiber with a greater aspect ratio may produce well-established networks and subsequent increment of interfacial bonding between the giant reed fiber in the polymers.74,75 In this context, the discontinuity of giant reed fiber networks in the perpendicular path tends to slightly enhance thermal conductivity as incrementing the fiber concentration up to 10 wt.%.
76
Thermal conductivity of giant reed fiber–PET biocomposites.
Flame characteristics
Flame resistance characteristics of giant reed fiber–PET composites.

PET: polyethylene terephthalate.
Thermogravimetric Analysis
From Figure 10, it can be examined that all the fabricated laminates consist of giant reed fiber initiate decomposition at 55°C temperature because of evaporation of moisture content from the reed fibers.
30
At the same time, the pure PET decomposes around 251°C as it does not possess any reinforcements. The second stage of decomposition is assigned to loss of weight around the temperature of 343°C, 351°C, and 347°C for PET1, PET2, and PET3 composites respectively, which is comparably lower than the pure PET (498°C).
78
Furthermore, the degradation of all fabricated laminates has occurred after 560°C. The reason may be assigned to incorporating fibers that improve the laminates’ thermal stability.
30
It is observed that PET2 laminates present higher thermal stability when compared with other manufactured PET composites and lastly deteriorate at 630°C, and there is no degradation from this temperature. Thermogravimetric analysis of giant reed fiber–PET composites.
Artificial neural network results
Forecasting of the targeted optimal giant reed fiber content
The generated ANN model determined the optimal giant reed fiber concentration in the PET matrix, depending on targeted characteristics. The model could construct a sturdy connection between the physical, mechanical, and thermal characteristics and the quantity of giant reed fiber concentration in the studied laminate. It is observed that traditional simulations could not offer fortunate outcomes because of the significantly nonlinear grouping among the independent parameters. The network search hyper factor adjusting technique was applied to locate the optimal hidden layers, epoch, and neuron in this condition. During factor adjustment, it was examined that an epoch (15,000) and huge neurons (350 in every hidden layer) were essential to improve the model efficiency. The model’s sturdiness was calculated depending on validation and training loss formulations from mean square error values. The epoch and huge neurons signify the connection amidst the independent factors; in this condition, the dependent factor’s physical, mechanical, and thermal characteristics were varied. Hence, the optimal giant reed fiber concentration is based on physical, mechanical, and thermal characteristics because of data points. Frequently, huge neurons with lower information may tend to under or over-fitting the model. To protect these positions, the drop-out technique was applied with the dense layer during the training, which ranged the active neurons in the input to eliminate undesirable biases.
Optimum formulation of the ANN model.

ANN: artificial neural network; PET: polyethylene terephthalate.
Outcomes of confirmation experiment under the optimal condition from ANN model.
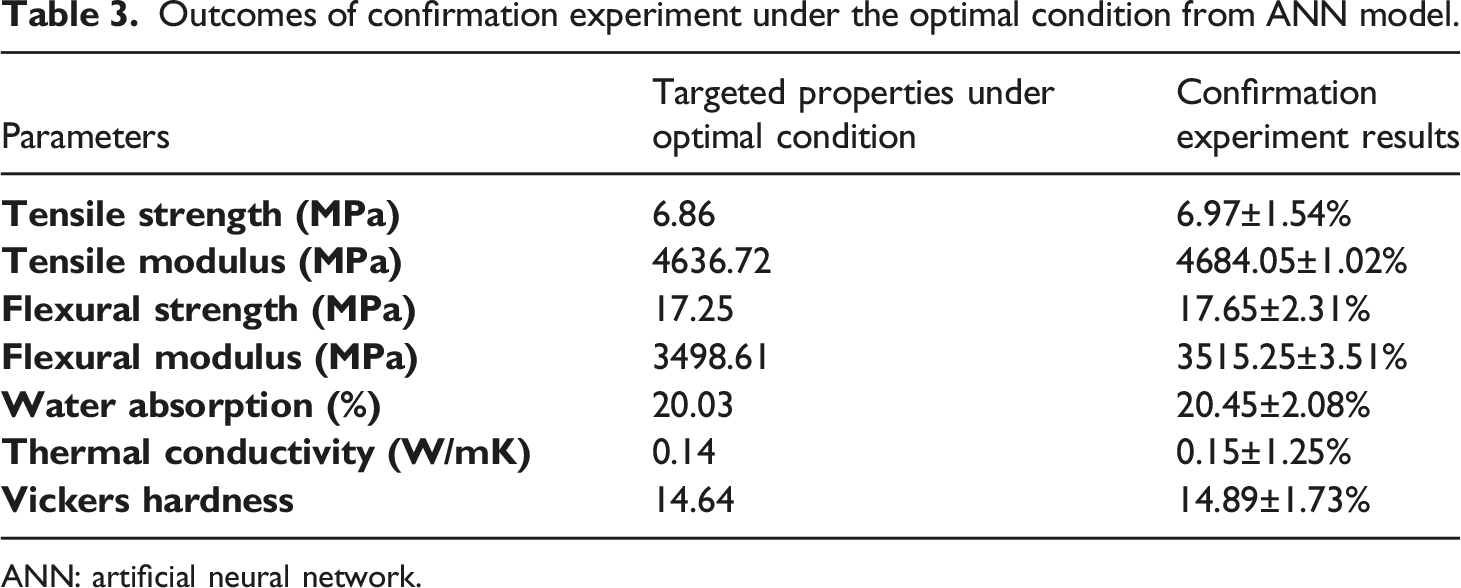
ANN: artificial neural network.
Performance curves
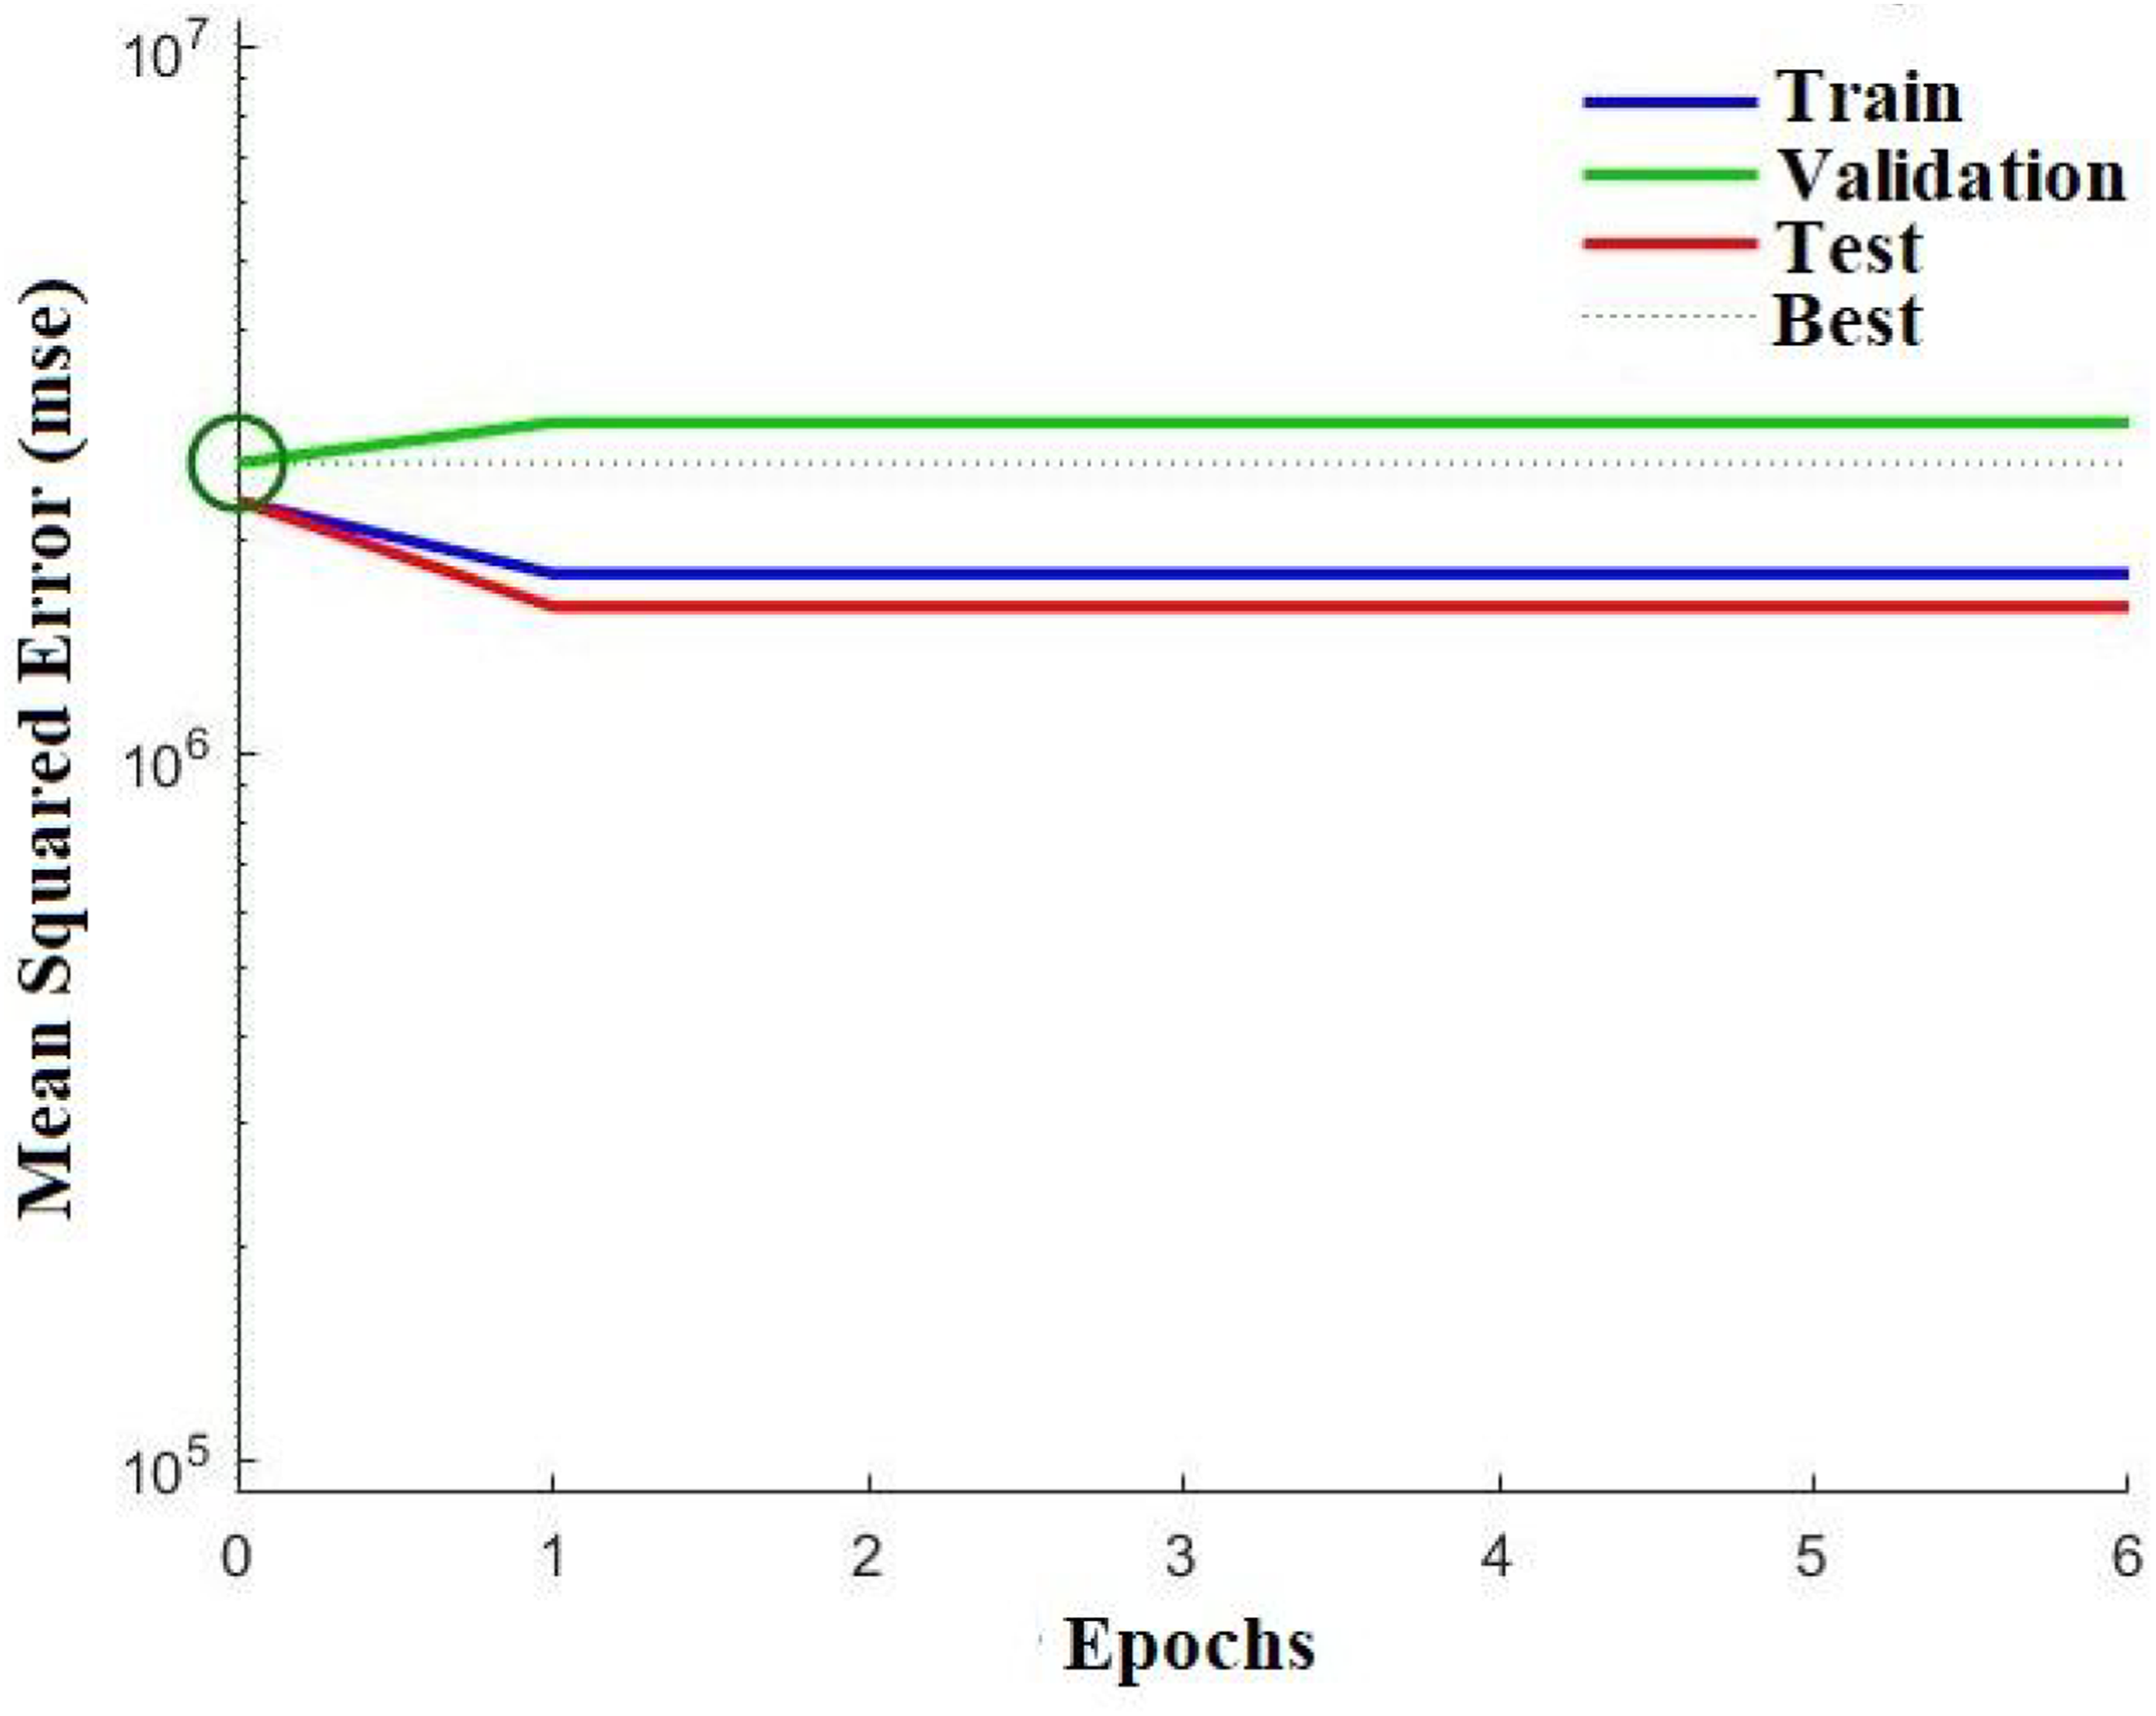
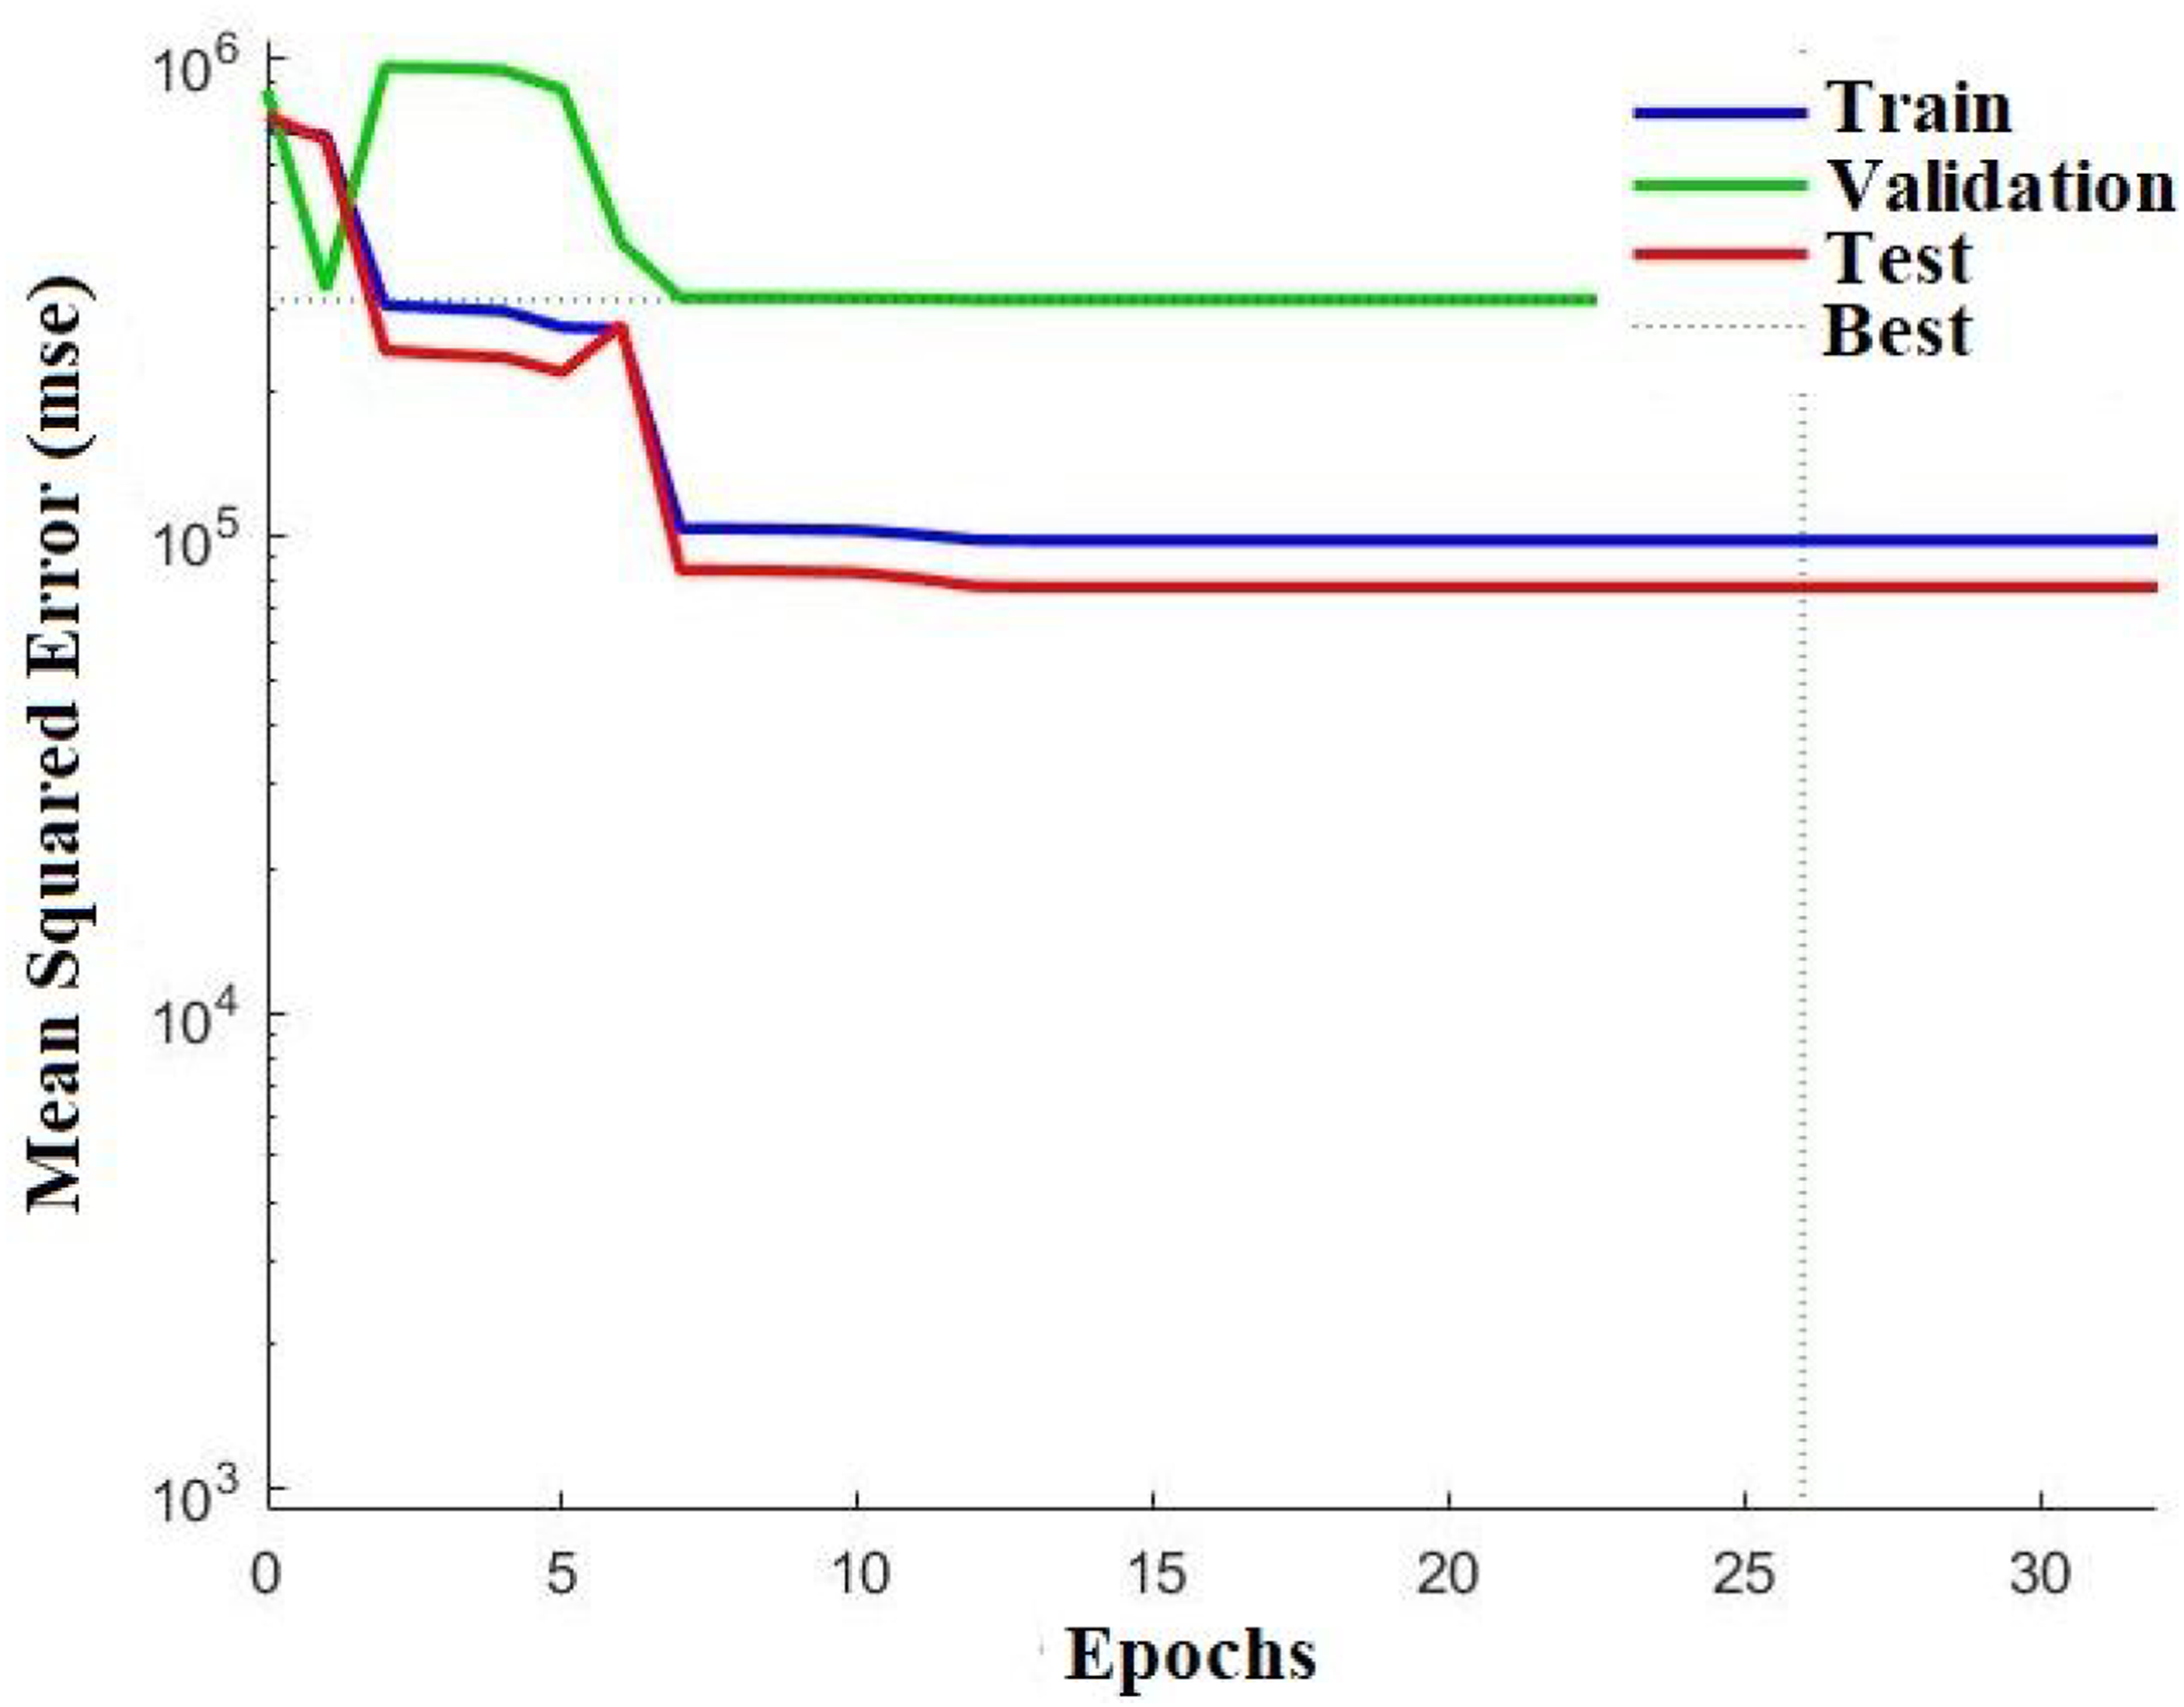
The input factors such as giant reed fiber and PET matrix and targeted properties like water absorption, tensile strength, tensile modulus, flexural strength, flexural modulus, Vickers hardness, and thermal conductivity are inserted in the ANN model, where the optimal giant reed fiber as the output. This was constantly trained from the LM and feed-forward with the backpropagation method. The performance curve of targeted, −15% and +15% of targeted characteristics are presented in Figures 11–13, respectively. The performance aspect is to assure which bias and weights are ascribed to the buds of the connection. As mentioned earlier, the performance goal curve, which shows the appropriateness or differently of the trained relation, is the contact when the training line divides across the target horizontal line as presented in Figures 9–11. This signifies that the ANN model has been effectively trained and interacted with the input information for forecasted aspire. The procedure is iterative, and the network scheme can be adapted till the performance goal is confronted. The amount of the mean squared error for the 255 iterations was 0.0035. The mean squared error is a network performance formulation that examines the network’s performance as per the average squared errors. The inconsequential quantity of the mean squared errors signifies the vast degree of interaction among input parameters and a trend for a better optimum target. Similar results have also been observed by other investigators.
79
Performance curve of Artificial Neural Network for predicting the optimal condition for targeted properties. Performance curve of Artificial Neural Network for predicting the optimal condition for +15% of targeted properties. Performance curve of Artificial Neural Network for predicting the optimal condition for −15% of targeted properties.
Regression curves
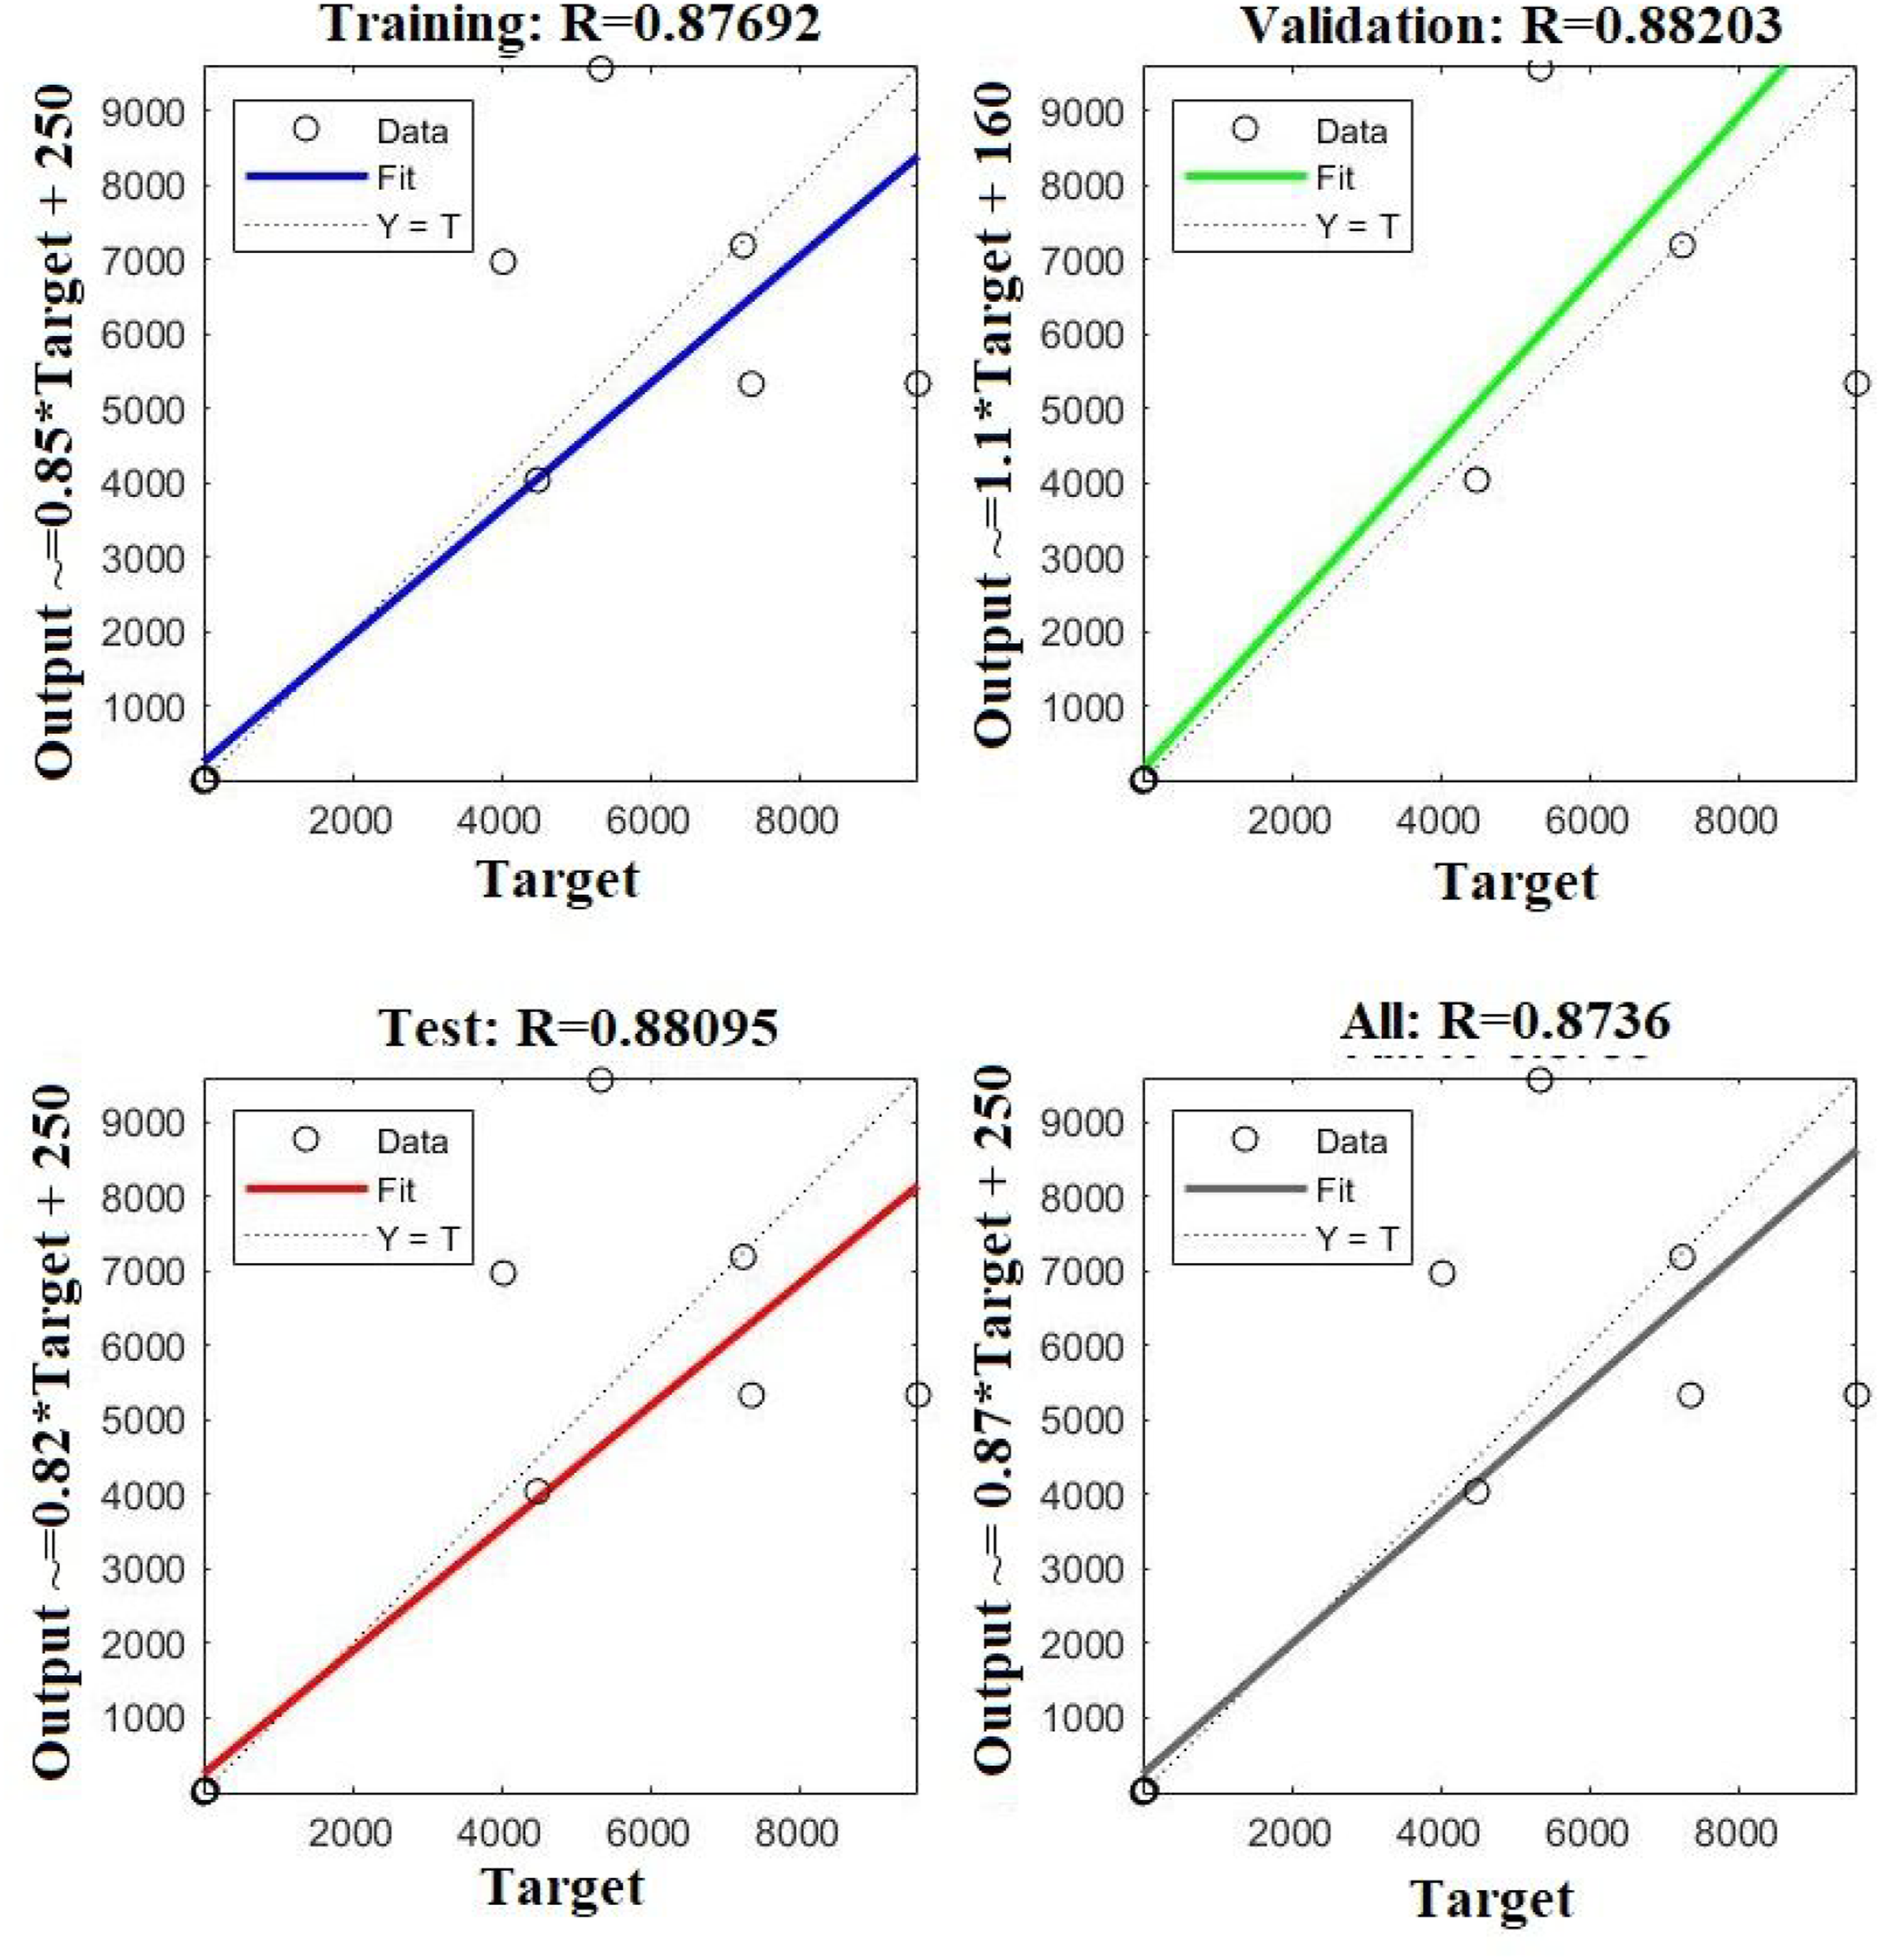
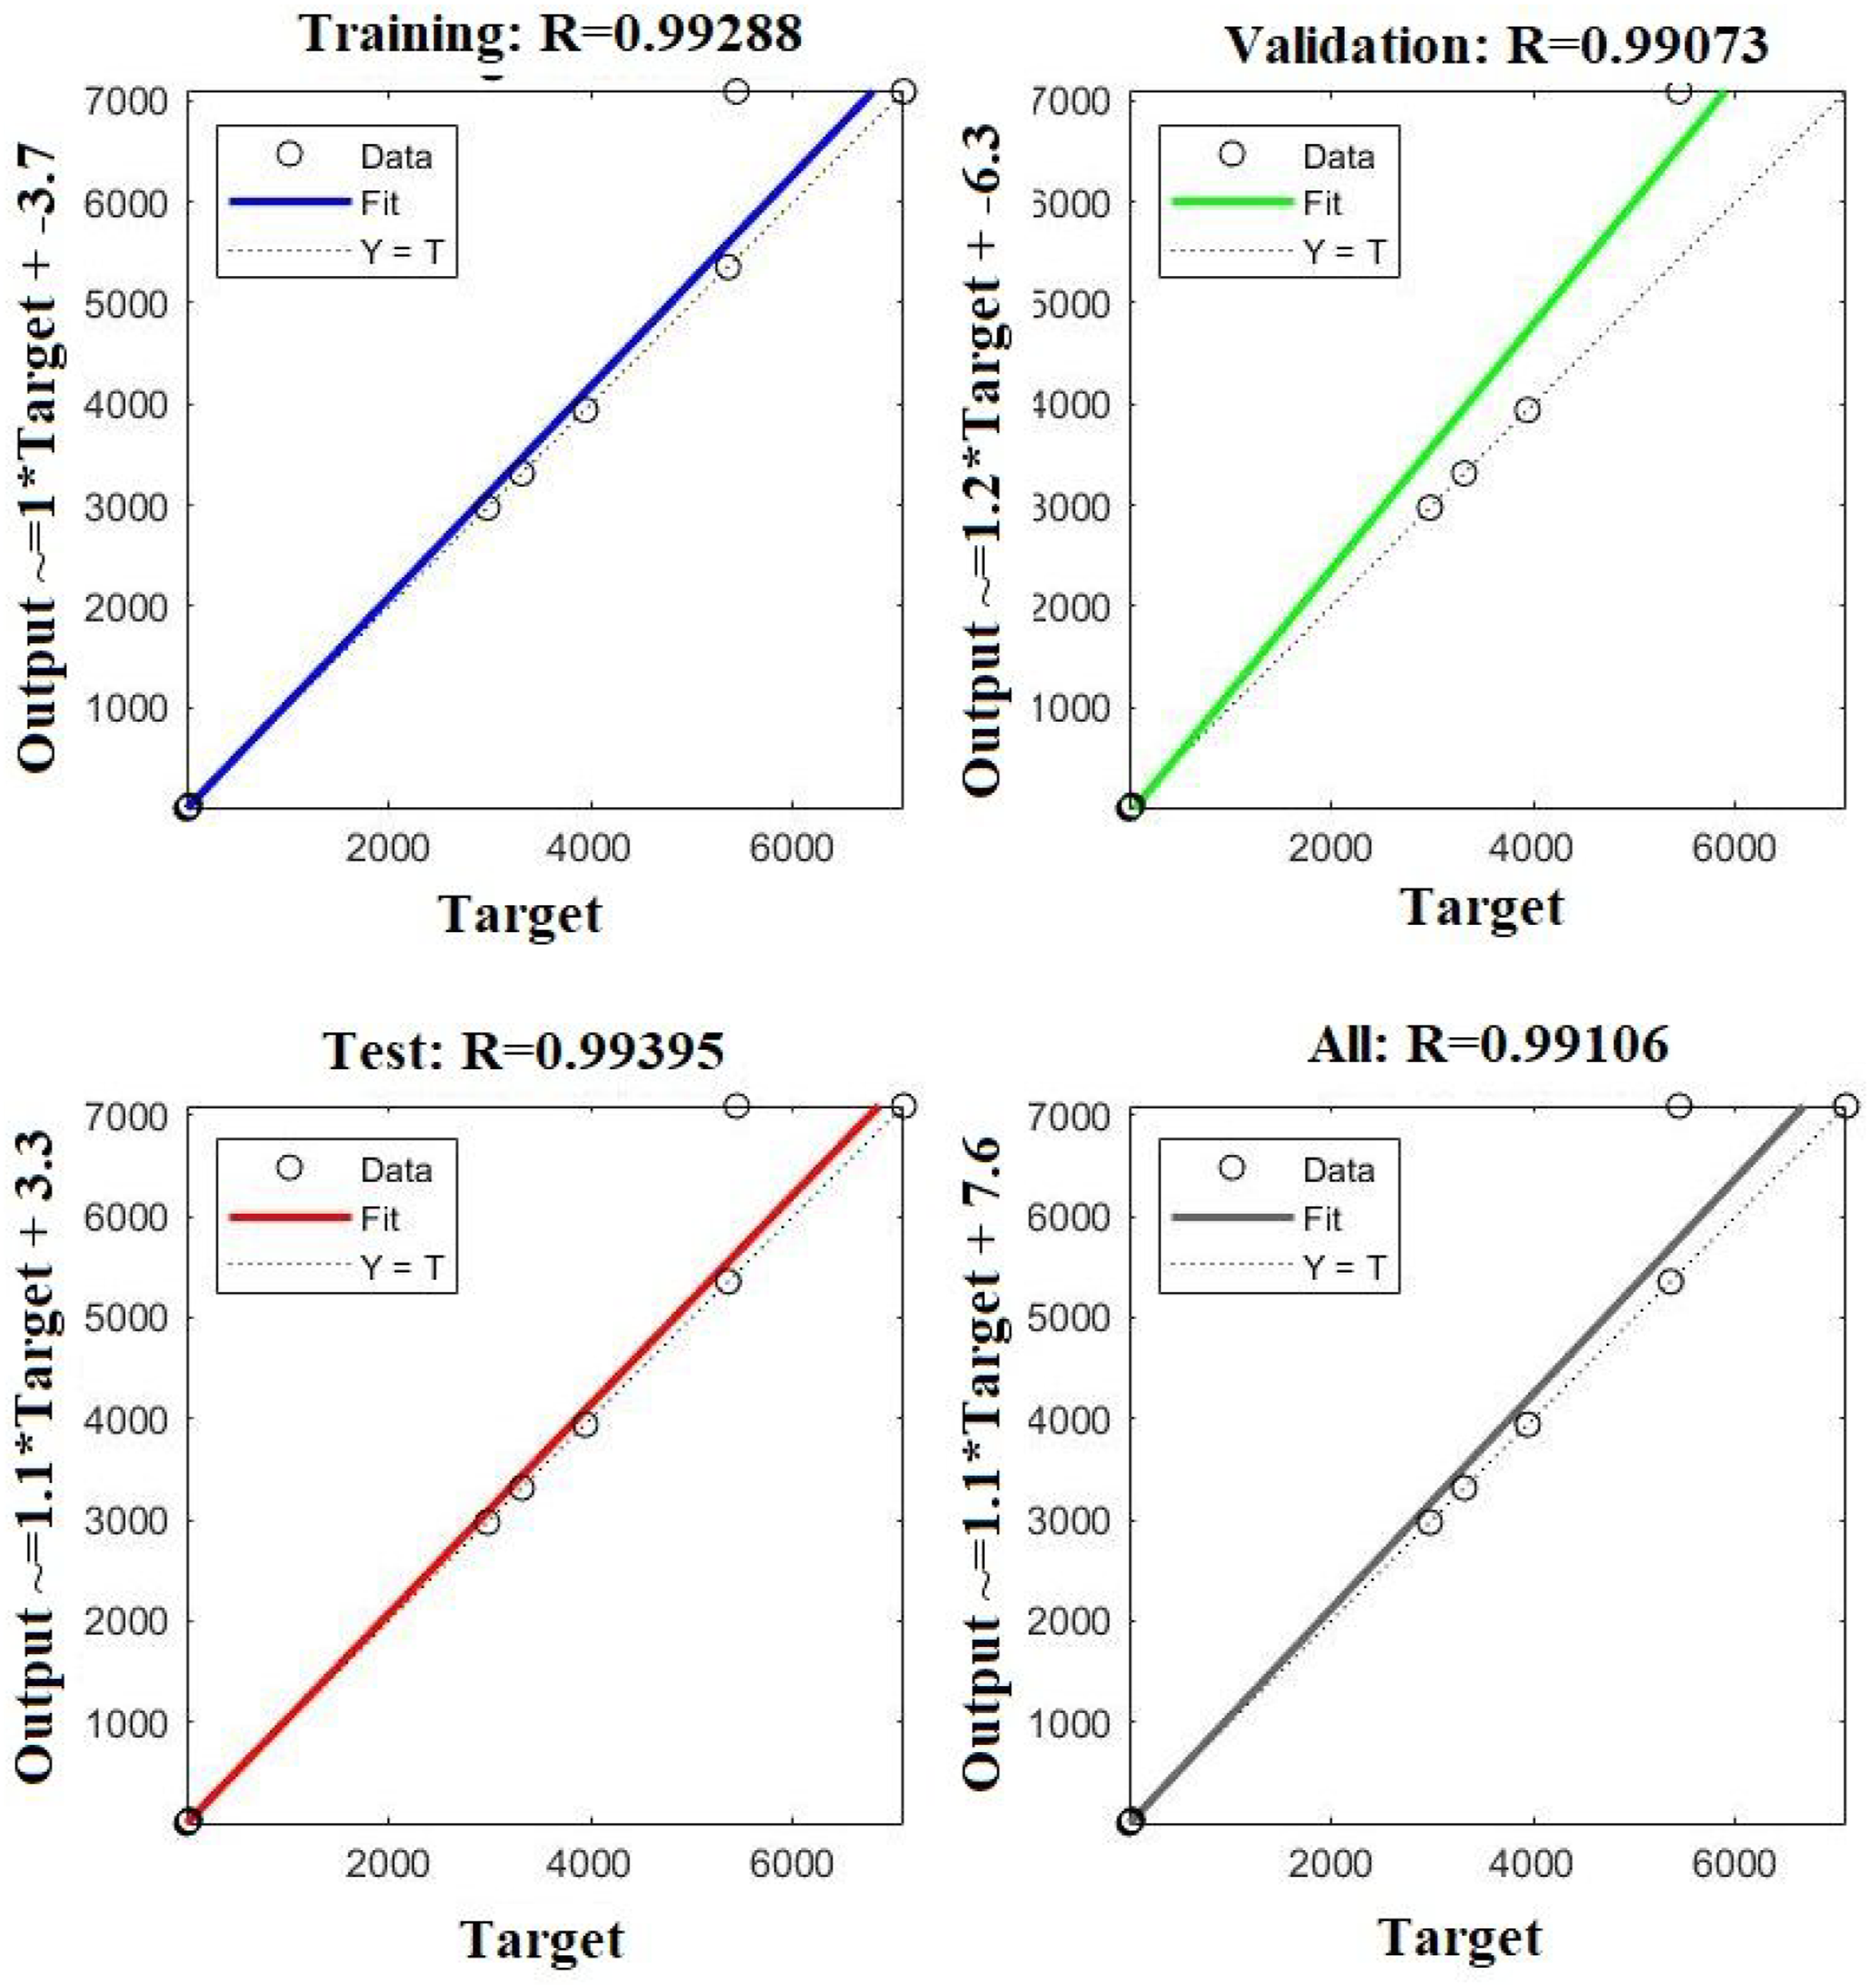
Figures 14–16 exhibits the regression curves that correlate the connection’s output to the predicted targets. The procedure of network verification created the regression curves, which are applied as support of correlation for the indicated targets and the network output. The interaction coefficients for the three regression curves were 0.974, 0.874, and 0.991 for the targeted, −15%, and +15% of the targeted characteristics, respectively. These quantities are near to 1, which entails advancing a better model with predictive and correlative capacity. The regression curves exhibit a higher arrangement between the best and information points line for the expected target and network output. The regression curves for the validation and training demonstrate higher predictive and correlative capacity as signified from the proximity of the formulation coefficient R up to 1 instead of the regression curve for testing. There are 120 total data sets, in that 84 data sets for training, remaining 18 data sets for testing and validating the ANN model. From Figures 14–16, most of the data sets are merged, which seems like few data only presented. This suggests that the network performance enhances upon fine-adjusting the connection using modifications and iterative training of biases and weights. The outcomes collected from the predicted outputs and tests using ANN are given in Table 4. Regression analysis for predicting the optimal condition for targeted properties. Regression analysis for predicting the optimal condition for +15% of targeted properties. Regression analysis for predicting the optimal condition for −15% of targeted properties. Material properties (independent parameters) for various prediction conditions. PET: polyethylene terephthalate.

The verification of the generated network was conducted using unplanned quantities within the variation of the input factors for the giant reed fibers and PET matrix. Arbitrary specific amounts of the giant reed fiber and PET matrix between the interpretations of the testing input factors were randomly chosen and provided as input to the generated network. The feedback from the network in terms of physical, mechanical, and thermal characteristics was examined to plunge within the variation of the predicted and experimented values using the interpolation technique. This affirms that the generated network is sufficiently trained for predictive and correlative desires. Employing the mean classification error of water absorption (0.0025), tensile strength (0.0021), tensile modulus (0.0023), flexural strength ((0.00027), flexural modulus (0.00022), Vickers hardness (0.00033), and thermal conductivity (0.0037). The quantities are less and slight, indicating a higher arrangement range within the predicted and experimental values of characteristics. This also focuses on the principle that the generated model is adequate for predictive utilization and efficiently trained. However, the model generated for forecasting characteristics exhibits higher predictive capability accuracy than the model for ±15% of targeted characteristics.
Impact of targeted characteristics
Table 4 follows the optimal giant reed fiber in the PET matrix for the targeted characteristics. The other part of the column follows the modification in the optimum giant reed fiber concentration, where all the characteristics were incremented by 15%. Later, the consecutive seven rows present the influence of modifying every characteristic by 15% greater than the initial condition. It can be examined from Table 4 that specific particular characteristics (water absorption, tensile strength, tensile modulus, flexural strength, flexural modulus, Vickers hardness, and thermal conductivity) have positive influences on giant reed fiber concentration.
This detailed data can support the excellent product manager to twist the classified characteristics for attaining more efficient laminate materials from any giant reed fiber concentration. The recommended strategic steps of generating the ANN model for determining the optimum giant reed fiber concentration can be efficiently used for other composites if the testing quantities of the physical, mechanical, and thermal characteristics are available to the product investigators. The researchers can draft their tests and examination earlier to complete the necessary characteristics using the generated forecasted ANN models.
Statistical analysis
Statistical analysis of giant reed fiber–PET composites.

PET: polyethylene terephthalate.
Conclusion
The giant reed fiber reinforced PET laminates were manufactured successfully with the increment of giant reed fiber loading 5, 10, and 20 weight%. It was found that incorporating giant reed fiber in the PET matrix enhanced the mechanical characteristics significantly, and the highest enhancement was observed for 10 wt.% of giant reed fiber loading. In contrast, it exhibited a reducing trend beyond that. From the flame resistance test, the samples PET1 and PET2 had no rating in the UL-94 test due to the wicking action of giant reed fiber, which could increase the burning sensation, and no dripping occurred. The thermal conductivity of laminates reinforced with 10 wt.% of giant reed fiber improved to 0.209 W/mK and then decreased at higher loading. Based on the overall outcome collected, the PET2 exhibited the best characteristics.
The predictive ANN model was also generated from the nnstart feed-forward backpropagation using MATLAB software to determine optimum giant reed fiber concentration in PET matrix composites on targeted characteristics. The hyper factor adjusting technique was applied to search the optimal ANN scheme, and the controls drop-out technique was used during the training period to prevent overfitting. The generated models were fortunate to determine the desired giant reed fiber concentration (12.70 wt.%) depending on the targeted physical, mechanical, and thermal characteristics while employing the ambitious targets.
Moreover, the model as a device permits the user to intuitions into the effect of critical factors on the desired fabricated composites. Also, the determination of the ANN method in forecasting physical, mechanical, and thermal characteristics will support effective decision-making and cost-efficient.
Footnotes
Declaration of conflicting interests
The author(s) declared no potential conflicts of interest with respect to the research, authorship, and/or publication of this article.
Funding
The author(s) received no financial support for the research, authorship, and/or publication of this article.