
Abstract
For 20 years, antibacterial functionalization has been one of the most attractive research fields in the textile industry. Nowadays, globalization has spread the microorganisms everywhere and produced many epidemics and pandemics such as smallpox, cholera, tuberculosis, yellow fever, Spanish flu, and coronavirus. The textile materials treated with triclosan would be a strong alternative to obtain antibacterial function against microorganisms for the medical applications, such as face masks, lab coats, and wound dresses. This study aimed to investigate the characterization, antibacterial properties, and durability of triclosan on polyester, polyester/cotton, and cotton surfaces. The pure triclosan and presence of triclosan in solutions were detected by gas chromatography–mass spectrometry chromatograms. It can be seen that surfaces were homogeneously covered by triclosan on scanning electron microscope micrographs, and there were new bands on Fourier transform infrared spectra after treatments. Large inhibition zones around all surfaces were observed, and antibacterial activity slightly increased depending on increasing chemical concentrations. The samples demonstrated strong biocidal activity to bacteria for 3 h. They lost their antibacterial properties after washing, but they showed good antibacterial (bactericidal) properties and satisfactory durability to washes. The results show that triclosan is a highly effective and durable chemical on polyester and cotton surfaces for medical textile applications.
Introduction
In recent years, there has been a lot of news about outbreaks and diseases in the world, which negatively affects human life, including coronavirus, influenza, hepatitis, Salmonella, and Escherichia coli infections.1–3 Therefore, consumers focused extremely on medical products and then, as a natural consequence, the use of textiles on medical, hygiene, and health care fields has become significantly widespread with new antimicrobials, functional fibers, new chemical finishes, and technologies. 4 As a result of all these, Medical Textiles Market is estimated to be valued at 10.5 billion USD by 2022, 5 and medical textiles are one of the most dynamically growing sectors because of changes in demographics, aging, growth of population, global warming, and health risks. Furthermore, the applications in medical textiles are also fairly extensive, for example, biocompatible tissues and implants, bandages and wound dressings, and prosthetics.6–11 For medical textiles, the textile industry has focused on developing novel antibacterial chemicals, fibers, and materials since the demand for antibacterial products is growing in including hospitals, military, and personal care products.
The textile materials and also human skin can support the growth of microorganisms, transmission, or cross-infection of diseases. Natural fibers such as cotton have been particularly known as a suitable environment to accelerate the growth of microorganisms, and therefore, microbial attacks easily occur on these surfaces. Synthetic fibers such as polyester strongly resist attacks by microorganisms owing to their molecular and hydrophobic structure. However, synthetic fibers and their blends cause more perspiration wetness, and as a result, microbial growth on the human body and textile surfaces occurs quickly. Meanwhile, the functionalization of inert surfaces such as polyester is also a big challenge because of the lack of tethering groups. Consequently, the antibacterial applications for synthetics have become extremely important, and the antibacterial agents used in textiles have also dramatically increased for the last years. For getting antibacterial activity, chemical agents such as chitosan, quaternary ammonium salts (quats), N-halamines, and halogenated phenols have been extensively used in surface functionalization, with antibacterial and fungicidal properties.12–21 Antibacterial applications have also been reported in other systems22–26 and also poly(ethylene terephthalate) (PET) surfaces could be a promising matrix for metacomposites with negative electromagnetic parameters.27–30
Triclosan is a member of halogenated phenoxy phenols31,32 and also an aromatic compound that has ethers, phenols, and chlorines in its structure. It shows broad-spectrum antibacterial and antifungal activities. For example, sutures with triclosan reduced the infection rate by 30%. Therefore, many healthcare products, such as toothpaste, soaps, and creams, include triclosan. Detergents, including 2% triclosan, are generally tolerated, and handwash goods do uncommonly have allergic reactions. Triclosan is also extremely recommended for textile wet treatments because of its low toxicity to human skin.15,16,21,33–38
In this study, the antibacterial properties and durability of triclosan on polyester, polyester/cotton, and cotton surfaces for medical applications were investigated. Triclosan was treated on surfaces with different concentrations through pad-dry method. The presence of triclosan in the chemical solution was investigated by gas chromatography–mass spectrometry (GC-MS). The structure of treated surfaces was characterized by Fourier transform infrared (FTIR), and the morphological changes were observed by scanning electron microscope (SEM). The antibacterial performances and durability of triclosan and treated surfaces were also studied according to different standard methods against S. aureus and E. coli.
Materials and methods
PET (90 g/m2) as polyester, polyester/cotton blends (PET/CO, 50/50, 110 g/m2), and cotton (CO, 120 g/m2) fabrics were obtained from Testfabrics Inc. All starting chemicals, pure triclosan (TCS 1, Cas number 3380-34-5), and its derivative (TCS 2, mixture of diphenylalkane and triclosan) were taken from Sigma-Aldrich and Rudolf Duraner.
For getting antibacterial property on textiles, the solutions of TCS 2 were prepared as 45, 60, and 80 g/L of chemical concentration with water/methyl alcohol mixtures (80/20) and they were applied to fabrics (~6 g) by the pad-dry process with Mathis rollers. The samples were dried at 90°C for 6 min. The weight change on polyester, polyester/cotton, and cotton fabrics after treatments were determined as 0.023, 0.026, and 0.038 g, respectively.
The TCS 1 and TCS 2 were analyzed by Agilent GC-MS 6890, and carrier gas was helium.
The morphological changes on the surface were investigated with JEOL 6060 SEM, and all surfaces were coated with gold for 200 s before running.
The surface spectra were taken from Thermo Nicolet iS50 FTIR spectrometer. The scanned frequencies, number of scan times, and resolution were from 4000 to 400 cm−1, 32, and 2 cm−1, respectively.
For TCS 1 and TCS 2, minimum inhibitory concentration (MIC) and minimum bactericidal concentration (MBC) were calculated according to the CLSI M07 A9. During studies, the corresponding supplementary sheets were strictly followed. Tests were applied on 96-well plates. Each well was filled with 100 mL of defined antibacterial dilution and 10 µL of bacteria. The turbidity in wells after 24 h was evaluated as to whether bacteria are present or not. For the determination of the MBC, the solution in the wells was transferred onto agar and evaluated for growth after 24 h.
For qualitative antibacterial evaluation, the tests were run according to ISO 20645. The activity was measured by microbial growth around the surface. For quantitative antibacterial evaluation, the tests were run according to ASTM 2149. The efficiency was calculated by the percentage reduction rate (R) of bacteria. S. aureus (ATCC 6538) and E. coli (ATCC 35218) were used in all antibacterial tests. Reduction rate (R%) of bacteria was calculated using the formula (equation (1))

where A is the number of bacteria recovered from inoculated treated test sample in jar incubated for 24 h, and B is the number of bacteria recovered from inoculated treated test sample at “0” contact time.
The durability of chemicals on surfaces against repeated washing cycles was tested according to AATCC 61. Samples (2.54 cm × 5.08 cm) were subjected to repeated washes in vessels with 50 balls and 150 mL (of 0.15% AATCC detergent) solution. Vessels rotated at 42 r/min and 50°C for 45 min. This one washing cycle is equivalent to five machine washing cycles. After washings, samples were tested according to ASTM 2149.
Results and discussion
The triclosan-containing chemicals were analyzed by GC-MS. TCS 1 and TCS 2 were dissolved in 1 mL of methyl alcohol with 1, 5, 10, 20, 40, and 80 µL concentrations, and these solutions were shaken for 2 min. The gas chromatograms, gas spectra, and mass spectra values were given in Figures 1 and 2 and Table 1, respectively. For TCS 1, the peak has sharply emerged around 12.02–12.18 min, which means the main peak of triclosan (Figures 1(b) and 2(b), Table 1). While focusing on TCS 2, four peaks represented by different chemicals such as diphenylalkane and triclosan in the TCS 2 solution at different retention times. The peak at 12.04 min can be thought of as triclosan (Figures 1(a) and 2(a), Table 1). This result confirmed that triclosan was present in the TCS 2 solution.

Gas chromatogram of (a) TCS 2 and (b) TCS 1.

Gas spectra of (a) TCS 2 and (b) TCS 1.
Mass spectra values of TCS 1 and TCS 2.

TCS: triclosan.
The morphological changes were observed by SEM, and pictures are given in Figure 3. PET fibers in Figure 3(a) had around a relatively smooth, uniform, and cylindrical surface morphology, but some residuals can be viewed on the fiber surfaces. It can be clearly seen from Figure (c) that PET/CO surfaces have more impurities because of the cotton fibers in their own structure while comparing the PET fibers in Figure 3(a). CO fibers in Figure 3(e) had naturally rougher, more residuals, visible grooves, and irregular shaped cross-sections on the surfaces. The fiber surfaces were homogeneously covered by TCS 2 after treatments. The coating effect on the fibers could be seen in Figure 3(b, d, f) because triclosan can quickly crystallize.
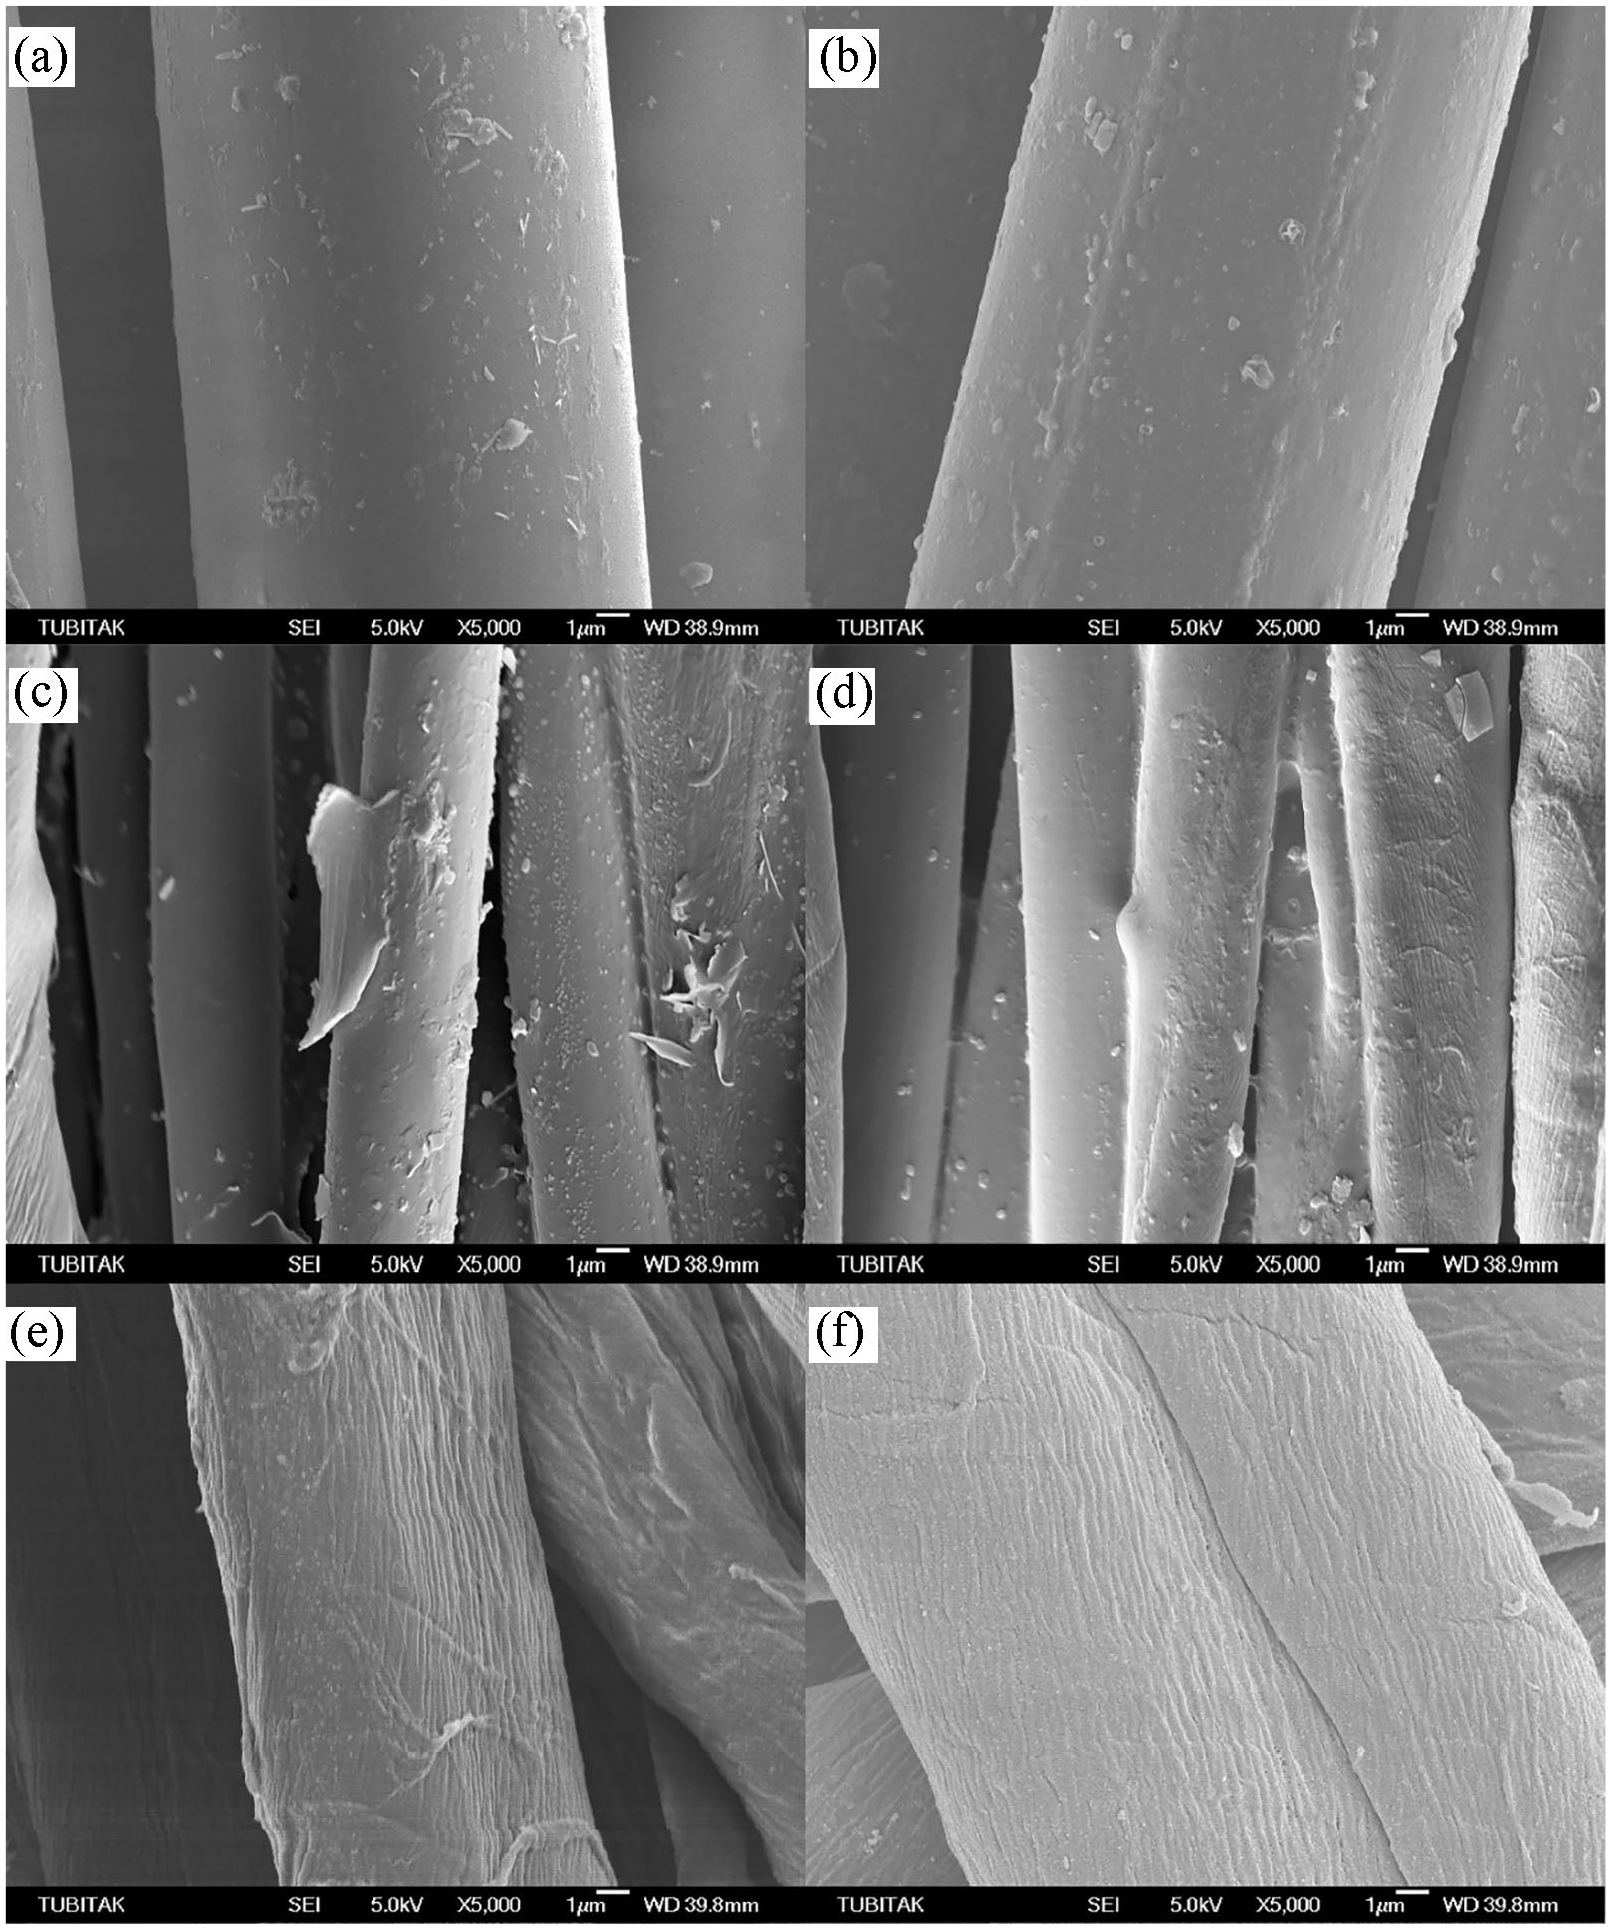
SEM pictures of (a) PET, (b) PET treated with TCS 2, (c) PET/CO, and (d) PET/CO treated with TCS 2, (e) CO, and (f) CO treated with TCS 2.
The changes on the surface after treatments were analyzed by FTIR, and spectra and specific wavenumber are shown in Figure 4 and Table 2, respectively. The FTIR spectra of TCS 2 were only given for avoiding repetition here since similar results are obtained after treated with TCS 1. The aromatic rings in the structure are easily detected from C–H and C=C–C vibrations. According to TCS 2 spectrum in Figure 4(a), the peaks between 1596 and 1348 cm−1 were the result of C–C stretching in the benzene ring, when the peaks between 1286 and 1098 cm−1 corresponded bending of the aromatic ring C–H bonds. 39 Triclosan might precisely be identified through the peaks at 1473 and 862 cm−1, which referred to the vibration of hydrogen atoms in the aromatic ring and C–C stretching of benzene rings. The carbon-halogen bond has strong absorption, and the major bands of aromatic compounds occur between 1000 and 670 cm−1. The C–Cl stretching should theoretically occur in the range 746–720 cm−1. Meanwhile, the interaction with C=C in chlorinated aromatics can raise as high as 845 cm−1. 40 Previous studies had reported the C–Cl stretching mode at 890 cm−1.41,42 The peaks at 1348, 1098, 862, and 792 cm−1 can be attributed to aromatic C–Cl stretching, while O–H in-plane bending was linked in the peaks at 1420 and 1348 cm−1. The large band occurred at 2866 cm−1 and this can be linked to C–H bond in diphenylmethane in TCS 2.
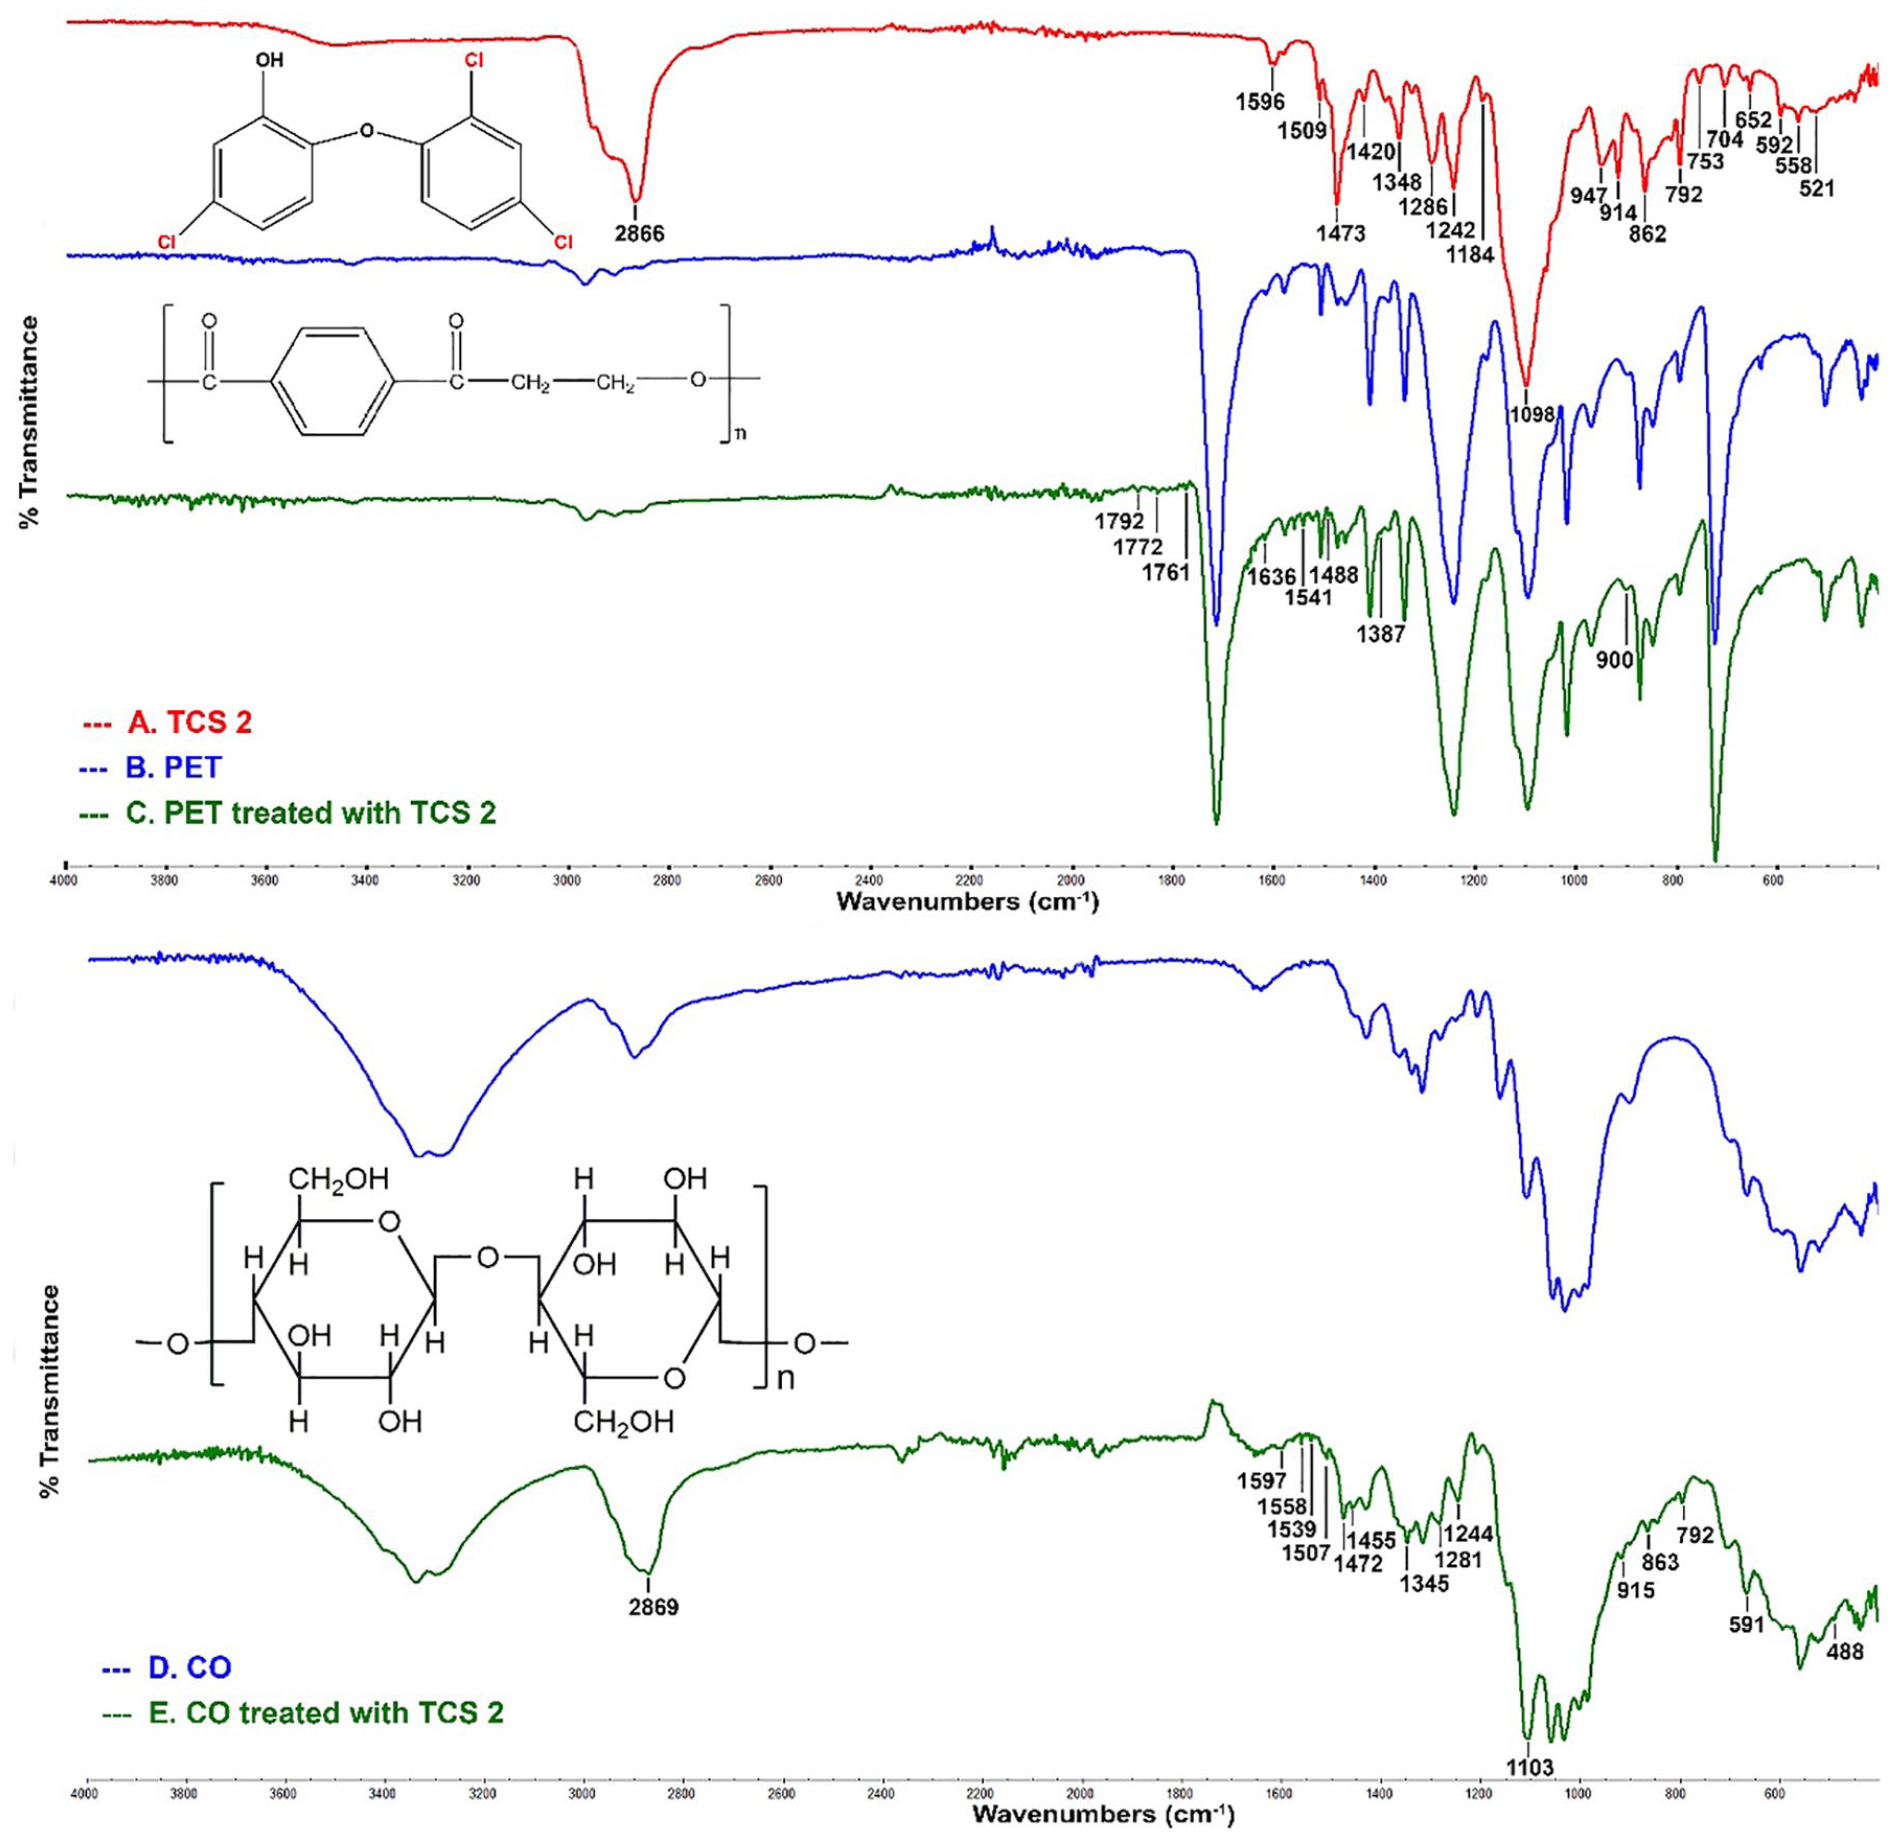
FTIR spectra of (a) TCS 2, (b) PET, (c) PET treated with TCS 2, (d) CO, and (e) CO treated with TCS 2.
FTIR absorption bands representing structural features.

CO: cotton; FTIR: Fourier transform infrared; TCS: triclosan; PET: poly(ethylene terephthalate).
For PET in Figure 4(b), the aromatic ring vibrations typically occurred at peaks of 1578, 1505, 1408, 1242, 1016, 872, 847, 792, and 722 cm−1, respectively. The PEt also has the following main vibration peaks at 2968 (C–H stretching); 1712 (C=O stretching); 1471, 1455, and 1339 (O–C–H and CH2 bending, CH2 wagging); 1095 (C–O stretching); and 969 cm−1 (O–CH2 stretching and C(=O)–O stretching). After treating with TCS 2 in Figure 4(c), the aromatic groups and C–Cl vibrational stretching bands of TCS 2 could not clearly be distinguished since they overlapped with the carbonyl stretching bands of the PET. However, new peaks were detected between 1792 and 1761, 1653, 1636, 1541, 1488, 1438, 1387, and 900 cm−1. The shifted and wider band at 900 cm−1 was detected after treated with TCS 2 and this band attributed to the C–Cl vibrational bands of TCS 2. In Table 2, these new bands can link to TCS 2 on the surface of PET.
It has been known that CO has numerous hydroxyl groups (Figure 4(d)). The broad peak around 3300 cm−1 and a weak band at 1640 cm−1 are appointed to a hydroxyl group and by the water of hydration, respectively. After treatment (Figure 4(e)), the new peaks appeared at 1597 and 1244 (1472) cm−1, which can be attributed to benzene ring vibrations. CO showed the typical peak at 1160 cm−1, but this spectrum changed when TCS 2 is deposited on CO because of C–O–C in cellulose at 1103 cm−1. The intense peaks of TCS 2 on CO were visible in the spectra at 1345, 1103, 863, and 792 cm−1. These new C–Cl stretching peaks confirmed that TCS 2 had been successfully coated onto CO surface after treatments and SEM pictures also supported them. The stretching bands also lost their intensity after treatments. This can be because TCS 2 is attached to surfaces.
MIC and MBC values are important to determine the resistance of microorganisms to an antibacterial agent. In vitro, triclosan shows bacteriostatic activity at lower concentrations, 43 and it also has bactericidal activity at higher concentrations 44 since it causes enormous damage to cell membranes and disrupts protein and lipid by inhibiting the enzyme enoyl reductase.33,34 Meanwhile, the activity is also higher to Gram-positive bacteria than Gram-negative bacteria. 45 Previous studies showed that MIC values of TCS 1 tested in broth and agar generally range between 0.01 and 4 mg/L against S. aureus,36,46,47 and between 0.09 and 8 mg/L against E. coli.33,48 However, the concentration in commercial products vary, and it is usually used in liquid soaps of 2–5 mg/L, in hand disinfectants of 2–20 mg/L, and in toothpaste of 3 mg/L.49,50
For determining MIC and MBC, TCS 1 and TCS 2 were prepared in concentration of 10 mg/L, and results tested in broth and agar are shown in Table 3 and Figure 5. MIC and MBC values for TCS 1 were obtained from 0.1 to 5.0 mg/L, and 0.2 to 5.0 mg/L depending on bacteria. TCS 2 displayed 25-, 2-, 12.5-, and 2-fold increased MIC and MBC values against S. aureus and E. coli, respectively. Both chemicals are effective on bacteria when studied in concentrations common in practice. Comparing with S. aureus, E. coli generally have higher MIC and MBC. The study showed that MIC and MBC results given in here are consistent with the literature previously reported.
MIC and MBC values of TCS 1 and TCS 2 against S. aureus and E. coli.

MIC: minimum inhibitory concentration; MBC: minimum bactericidal concentration; TCS: triclosan.

MIC and MBC of TCS 2 against (a) S. aureus and (b) E. coli.
Antibacterial activity was qualitatively tested according to ISO 20645. For determination, the absence of bacterial growth underneath the sample (20 mm × 20 mm) and the presence of inhibition zone confirm the antibacterial activity. Considering antibacterial protection, the zone should at least be H ⩾ 1 mm. Here, the significant differences between diameters of inhibition zones underneath all samples treated with TCS 2 after taking samples from agar plates were precisely observed. It can also be seen that the zone sizes (antibacterial activity) enlarged with the increase in chemical concentrations, whereas the untreated samples showed no such zones (no antibacterial activity) (Table 4 and Figure 6). Even at the lowest concentrations, samples treated with TCS 2 inhibited the bacteria with the zones of between 13, 17, and 18 for S. aureus and between 12, 13, and 13 mm for E. coli, respectively. Triclosan not only prevented the growth under the surfaces but also leached continuously out from the surface by restricting the growth of organisms. As a result, these studies have indicated that triclosan killed bacteria on the surface and had good antibacterial activity against both bacteria.
Qualitative antibacterial activity according to ISO 20645.
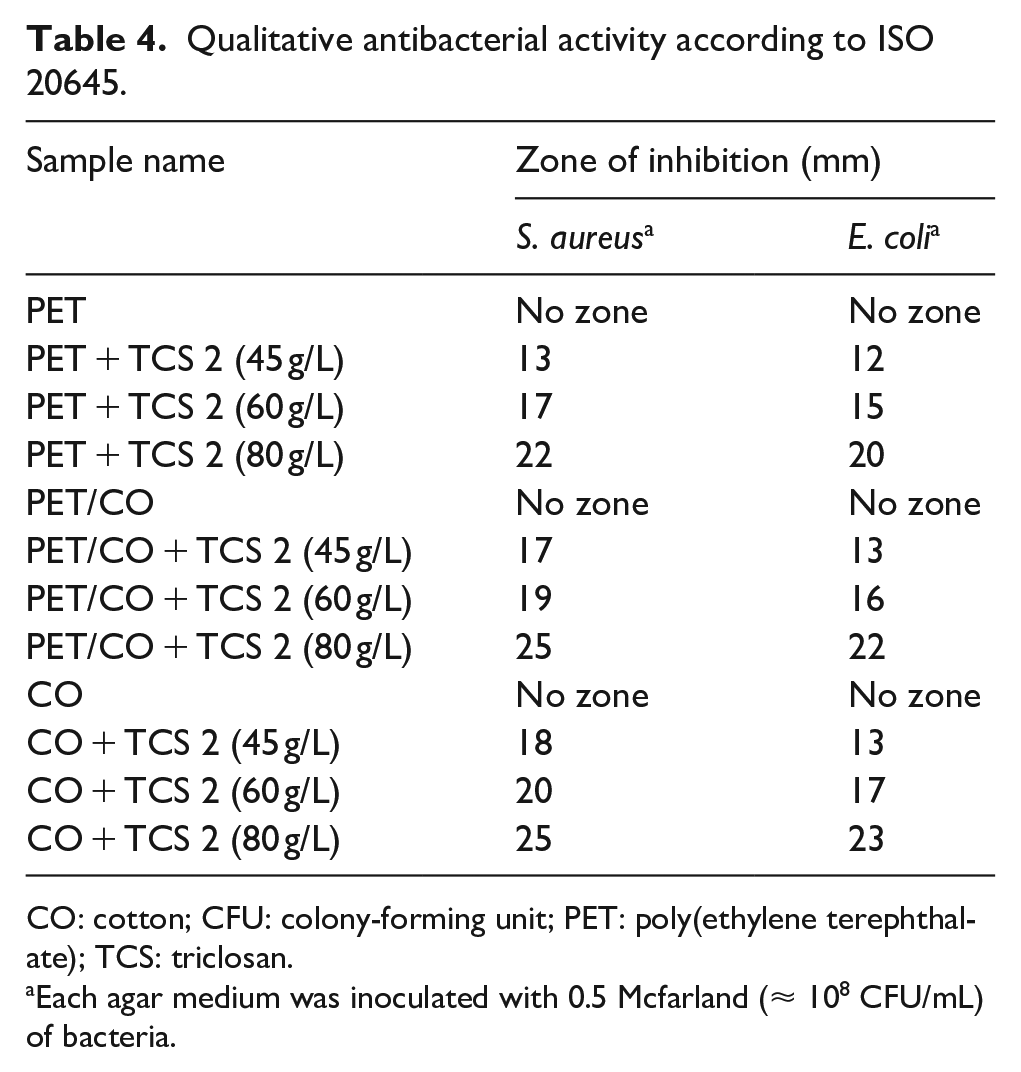
CO: cotton; CFU: colony-forming unit; PET: poly(ethylene terephthalate); TCS: triclosan.
Each agar medium was inoculated with 0.5 Mcfarland (≈ 108 CFU/mL) of bacteria.
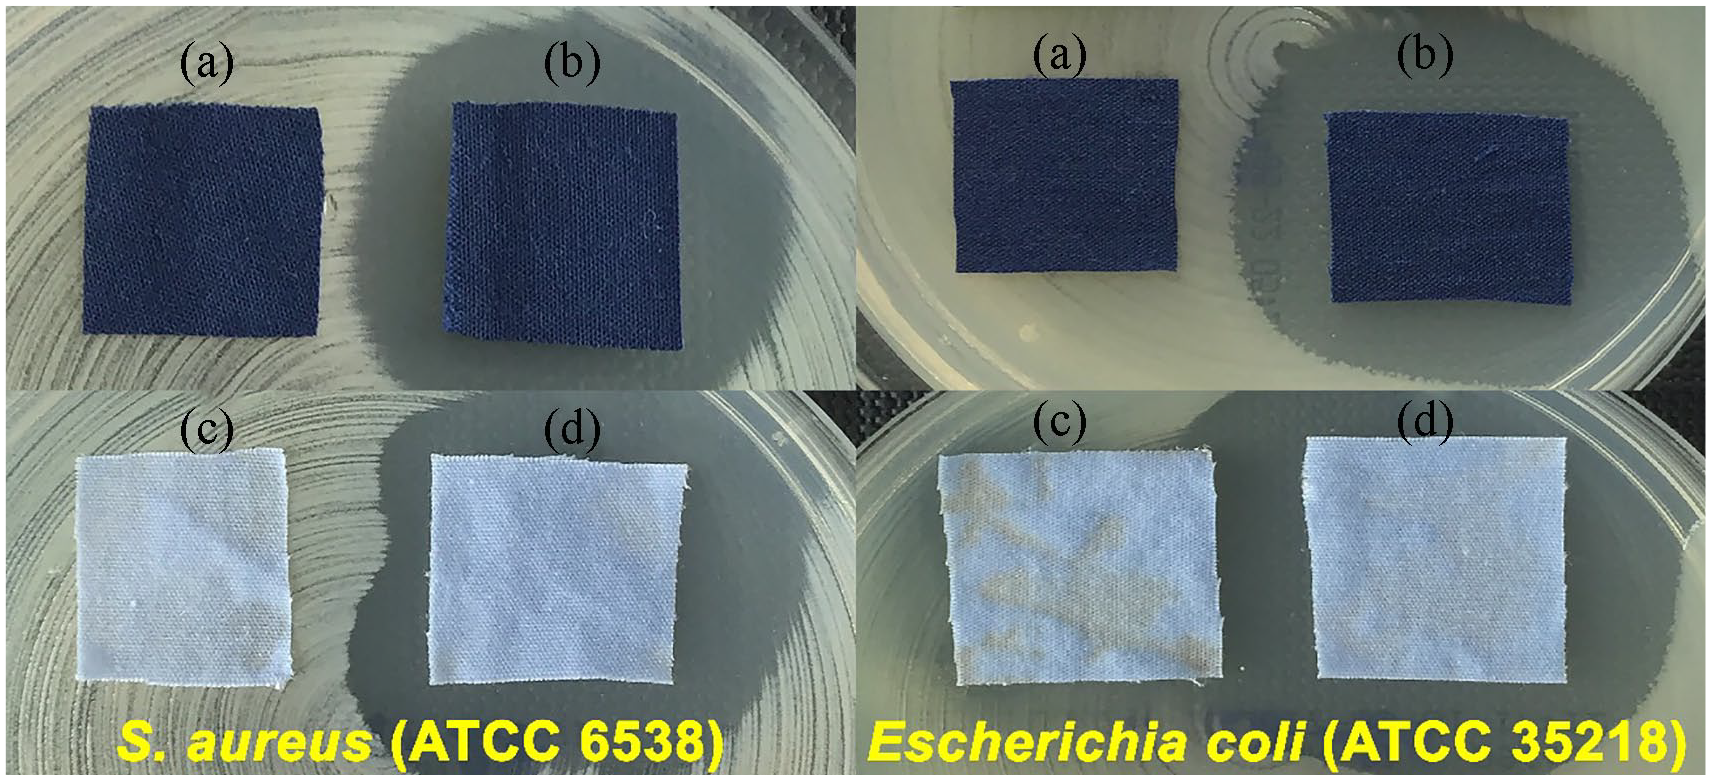
The inhibition zones of (a) PET, (b) PET treated with TCS 2, (c) CO, and (d) CO treated with TCS 2.
Antibacterial activity was quantitatively tested according to ASTM E2149. Considering antibacterial protection, the reduction rate (R) of bacteria should be more than 90%. It can be viewed that untreated PET, PET/CO, and CO samples did not exhibit any significant antibacterial efficacy. The antibacterial property slightly increased depending on chemical concentrations and displayed a remarkable effect on bacteria, even at lower concentrations for 3 h, 95.42%, 96.95%, 97.86%, 91.21%, 92.31%, and 93.41% for bacteria (Tables 5 and 6). It is understood that triclosan targeted fatty acid synthesis by inhibiting the enzyme enoyl reductase, and this inhibition was slow.35,51–54 At higher concentrations, the bisphenol is likely to damage the bacterial membrane. 55 In brief, it was also found that triclosan had good antibacterial and biocidal activities on bacteria and also had more efficiency against S. aureus than E. coli. It is well known that Gram-negative bacteria have an extra outer membrane formed of phospholipids, polysaccharides, and proteins and are therefore known to be generally more resistant to biocides.56,57 These findings are consistent in the literature.
Antibacterial activity against S. aureus according to ASTM E2149.
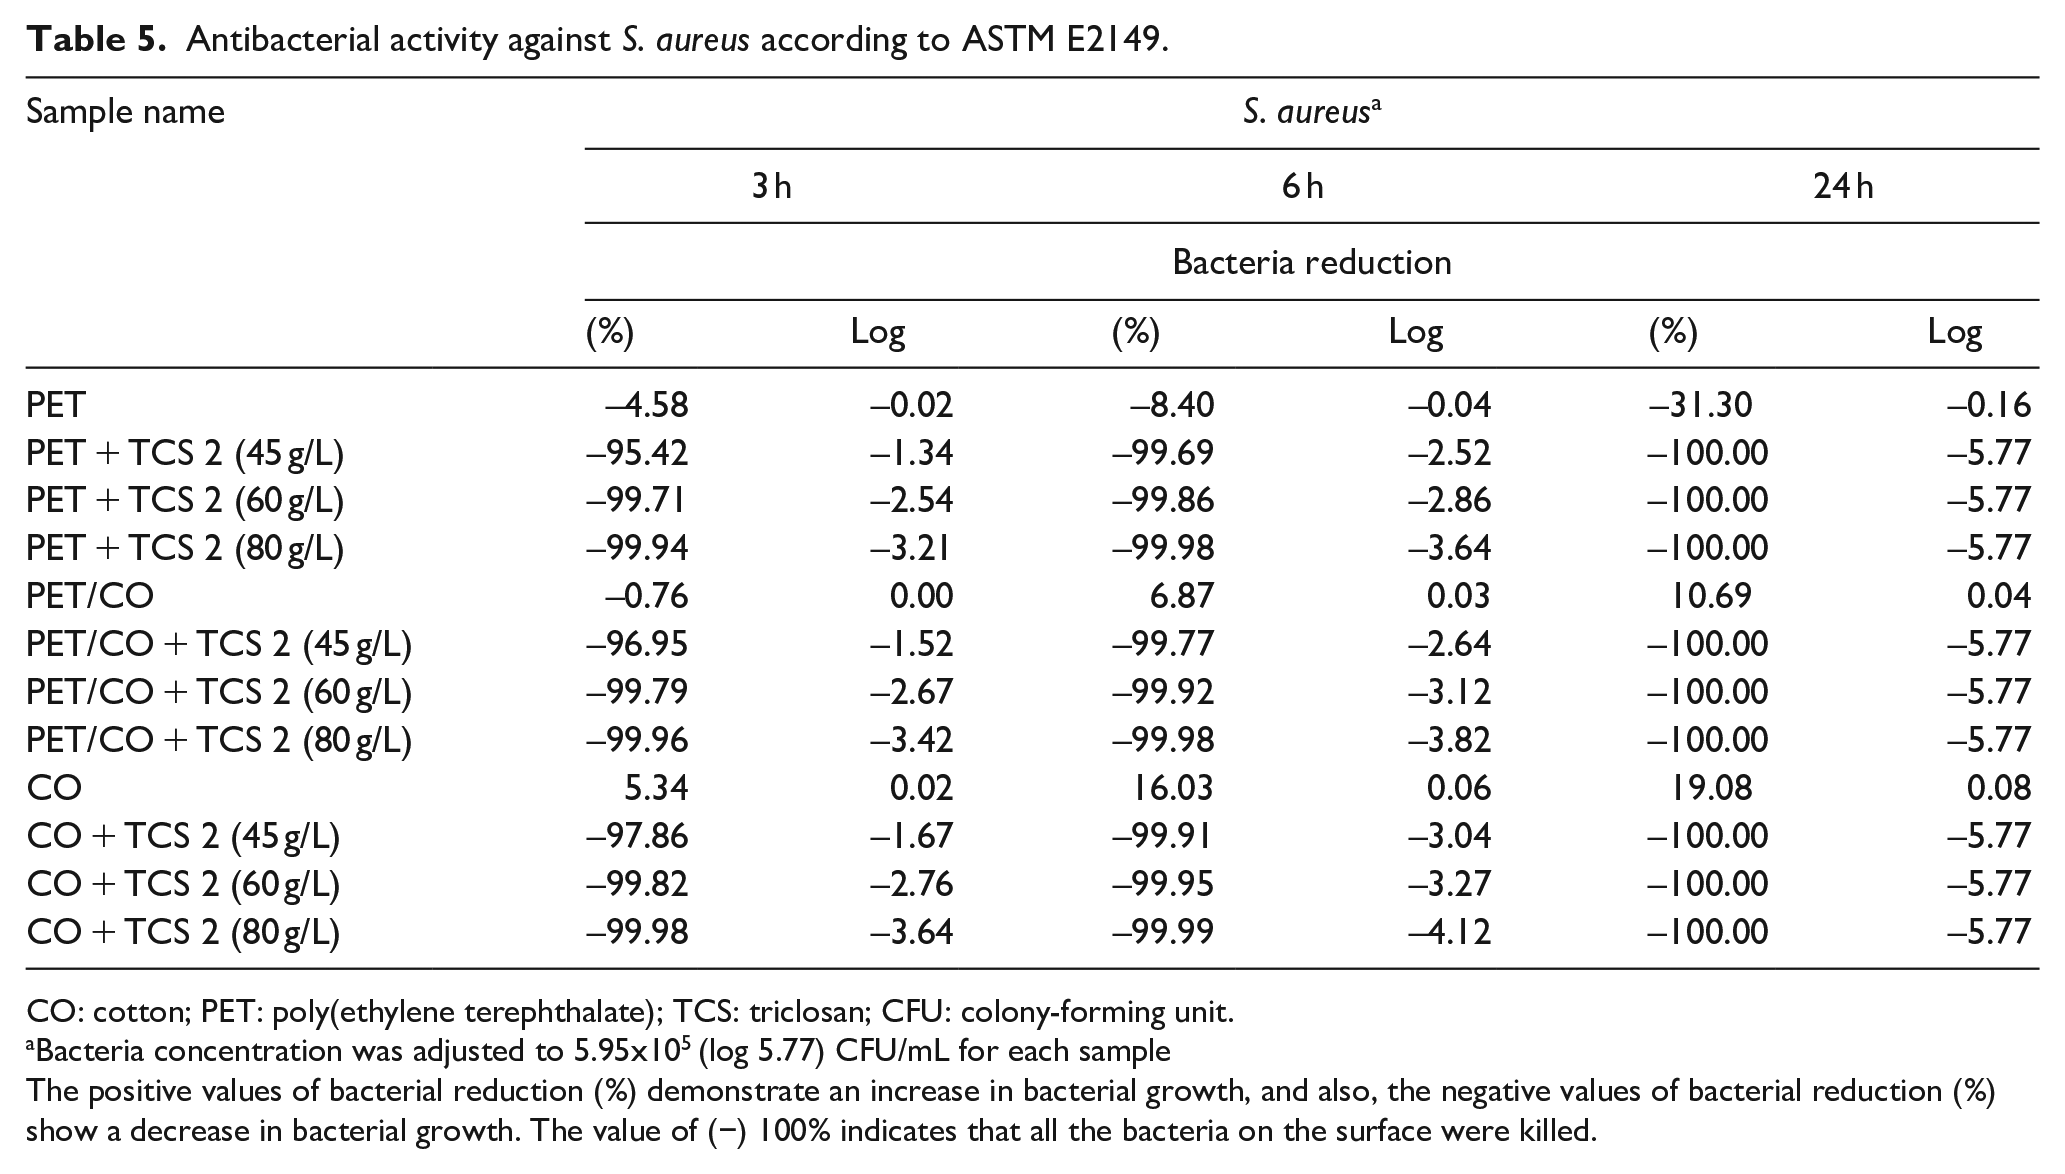
CO: cotton; PET: poly(ethylene terephthalate); TCS: triclosan; CFU: colony-forming unit.
Bacteria concentration was adjusted to 5.95x10⁵ (log 5.77) CFU/mL for each sample
The positive values of bacterial reduction (%) demonstrate an increase in bacterial growth, and also, the negative values of bacterial reduction (%) show a decrease in bacterial growth. The value of (−) 100% indicates that all the bacteria on the surface were killed.
Antibacterial activity against E. coli according to ASTM E2149.

CO: cotton; PET: poly(ethylene terephthalate); TCS: triclosan; CFU: colony-forming unit.
Bacteria concentration was adjusted to 4.14x10⁵ (log 5.62) CFU/mL for each sample.”
The positive values of bacterial reduction (%) demonstrate an increase in bacterial growth, and also, the negative values of bacterial reduction (%) show a decrease in bacterial growth. The value of (−) 100% indicates that all the bacteria on the surface were killed.
For medical applications, the antibacterial efficacy on the surface should remain constant for as long as possible, preferentially for the lifetime of the textiles. The durability to washes depends substantially on the chemical concentration on the surface, and the reduction of concentration results obviously in loss of effectiveness. The treatments were performed before and after washes according to AATCC 61, as presented in Table 7. The treated samples lost their antibacterial properties after washes. The bacterial reductions of S. aureus and E. coli were about 91.60% and 87.91%, respectively, and fabrics showed good antibacterial (bactericidal) properties also after 10 washes. However, the antibacterial properties decreased to about 70.99% and 69.23% for both bacteria after 20 washes, and fabrics exhibited satisfactory antibacterial activity (bacteriostatic) to washes. Consequently, the treated samples showed satisfactory durability to washes.
Washing durability according to ASTM E2149 for 24 h.

CO: cotton; PET: poly(ethylene terephthalate); TCS: triclosan.
Bacteria concentrations were adjusted to 5.95x10⁵ (log 5.77) CFU/mL and 4.14x10⁵ (log 5.62) CFU/mL for S. aureus and E. coli, respectively.
Conclusion
In recent years, the increasing demand for medical textiles and antimicrobial finishings has occurred rapidly because of the increased health and hygiene interests of the consumers. Chitosan, quats, N-halamines, and halogenated phenols have been widely used as antibacterial agents in textile finishing treatments.
In this study, the processing, characterization, and antibacterial activity of triclosan on polyester, polyester/cotton, and cotton surfaces were investigated. SEM and FTIR studies proved that triclosan could be introduced into the surface, and fiber surface was coated by triclosan after treatments. Triclosan was found to be effective and stable on getting antibacterial textile surfaces for medical applications, and triclosan-added surfaces provided significant inactivation and long-term activity against S. aureus and E. coli of about 105 colony-forming unit (CFU)/mL, even at a lower concentration, while the untreated surfaces did not show any antibacterial activity. This study showed that triclosan is one of the most effective antibacterial chemicals, and it gave new opportunities for medical applications, with incorporated bactericidal effects.
Footnotes
Acknowledgements
The author is grateful to Rudolf-Chemie for supplying triclosan chemical.
Author’s Note
Mehmet Orhan is also affiliated with Bursa Uludag University, Bursa, Turkey.
Declaration of conflicting interests
The author(s) declared no potential conflicts of interest with respect to the research, authorship, and/or publication of this article.
Funding
The author(s) disclosed receipt of the following financial support for the research, authorship, and/or publication of this article: This work was supported by the TUBITAK-BIDEB under Grant 2219 and Bursa Uludag University under Grant OUAP(M)-2013/7.