
Abstract
Experiments and theoretical analyses are conducted in an office in Xi’an to study indoor particle concentration through establishing a mass balance equation and real-time monitoring. Meanwhile, the filtration efficiencies for different grades of filter media have been tested and verified by experiments. Studies are conducted on indoor particulate emission source and concentration change in combination with equation of linear regression, linear fitting curve of indoor–outdoor concentration, as well as indoor concentration decay profile. The results indicate that coarse filters G1 to G4 are used in mechanical ventilation to filter larger particles. However, it can only achieve 1.6%–15.2% for PM2.5 filtration efficiency. On the other hand, F7 to H10 filters could reach the high efficiency of 55.6%–69.7%. Furthermore, indoor PM2.5 concentration with a coarse filter using G4 filter can obviously reduce the indoor particulate concentration to 69–75 μg/m3. It ranges from 87 to 90 μg/m3 using a G3 filter, while the outdoor PM2.5 concentration is 135–150 μg/m3.
Keywords
Introduction
The quality of indoor air is directly affected by particles produced by indoor personal activities or importing through intake ducts, open windows, and doors. Indoor air quality has a significant impact on the health of the occupants living. There is solid evidence indicating that the increase of morbidity and mortality is associated with larger exposures to small particles.1,2
In the past several decades, numerous measurements have been reported on the ratio of the indoor to outdoor particle concentration, which to some extent indicates how well the building envelope protects us against outdoor particulate matter.3,4 The effectiveness of air filters for different grades of filter materials in reducing indoor particle concentrations has been rarely reported in the literature. Meanwhile, controlling the indoor particle concentration level could provide help when seeking quantitative estimates of exposure to particles, which indicate how well ventilation systems provide protection against outdoor particulate matter, to minimize exposure.
In this article, a model for controlling indoor particulate matter of mechanical ventilation system is proposed based on the efficiency test of different filter materials, the accuracy of which is tested and verified by experiments. Furthermore, different sources of PM2.5 contributing to indoor concentrations are estimated via a theoretical method combined with the indoor particle concentration decay profile.
Indoor particle dynamic model
Model formulation
Figure 1 shows the particulate concentration model between indoor and outdoor of a mechanical ventilation system. A well-mixed model of indoor volume can be adopted in the mass balance equation as shown in equation (1)

where V is the volume of the air conditioning room, m3; P is the penetration factor (the fraction of PM entering the indoor environment through the building envelope); K is the indoor particle deposition rate, 1/h; Q1 is the volume of return air, m3/h; Q2 is the infiltration volume through the building shell, m3/h; Cout is the concentration of outdoor PM, μg/m3; Cin is the concentration of indoor PM, μg/m3; ηz is the filtration efficiency of air filter, %; and G is the indoor particle generation rate, μg/h.

Indoor particulate concentration model.
The instantaneous value of Cin can be written as
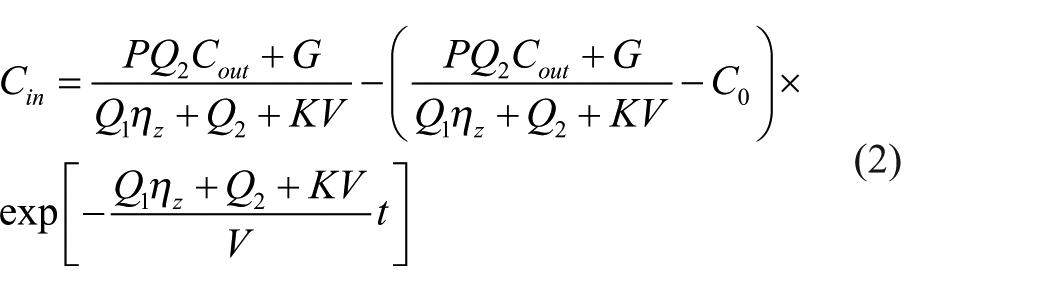
where Co is the initial concentration of indoor PM, μg/m3. The steady-state value of C∞ can be calculated by setting
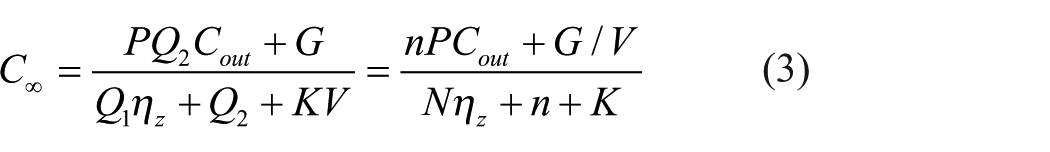
where n equals Q2/V, the air exchanges of infiltration airflow, 1/h; N equals Q1/V, the air exchanges of indoor airflow, 1/h.
For an air contaminant acting on human through inhalation, the dose D can be calculated as shown in equation (4)
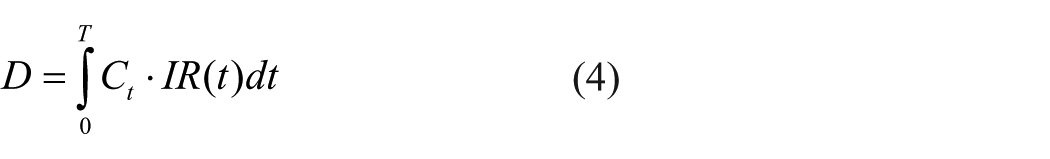
where IR(t) is the alveolar ventilation rate, m3/h.
Methods
Data collection
The study site is located on the 7th floor in an office in Xi’an, China, which is 60 m away from Yanta Road, as shown in Figure 2(a). A certain brand of Variable Refrigerant Volume (VRV) units of side blow fan coils is adopted in the sampling room, as shown in Figure 2(b). The indoor–outdoor concentration was tested simultaneously based on the experimental measurement with different filter materials. The indoor test point was 1.2 m above the ground; the outdoor test point was located outside the open balcony at the same height as the indoor sampling point.
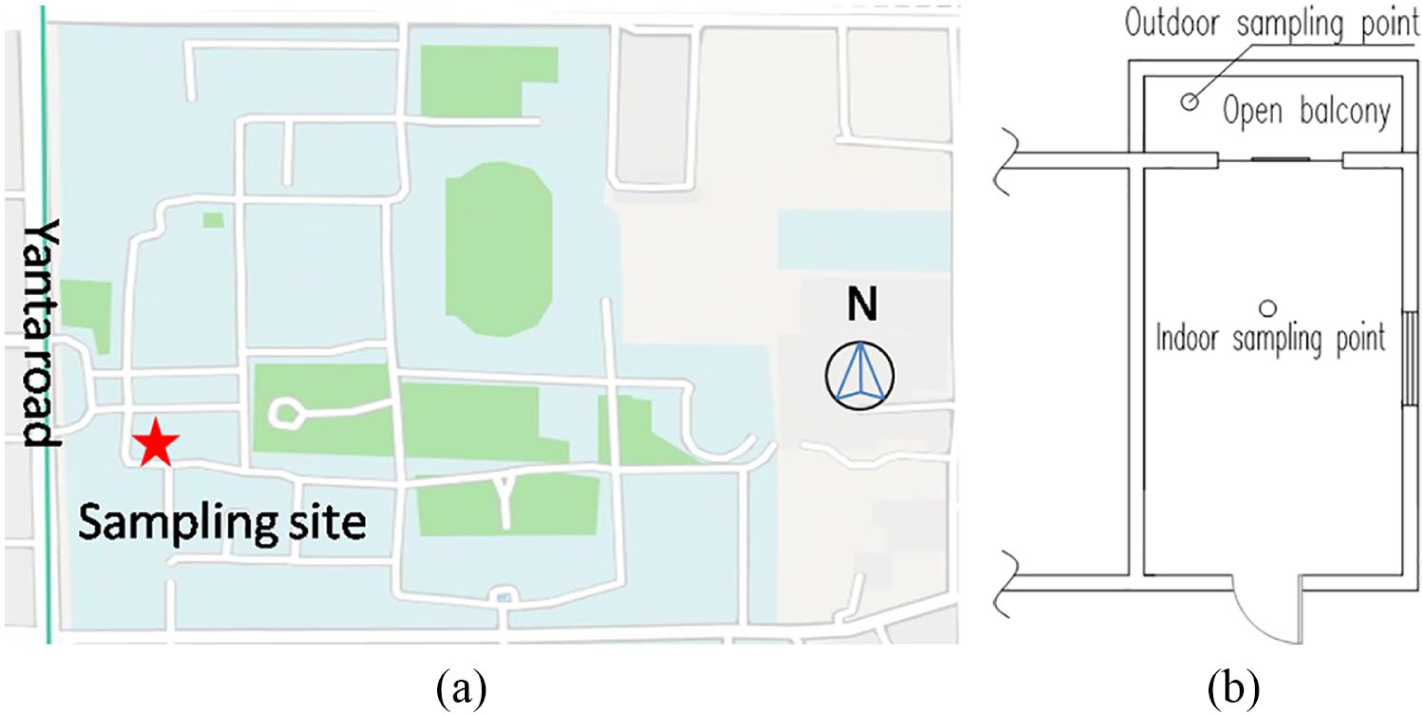
Geographic location of the sampling site in Xi’an. (a) Geographic location of the sampling site and (b) indoor–outdoor sampling point.
The relevant parameters of the office are as follows: room area, 22 m2; ceiling height of each level, ~3.2 m; volume, 71 m3; and circulating flow of air-conditioned room, 640 m3/h when the indoor temperature was set at 27°C.
The filtration performance of different materials was tested in this study, and the test results were applied in equation (1) to estimate the indoor particle emission source. The material and related information of air filters are shown in Table 1. Furthermore, Figure 3 shows a diagrammatic presentation of filters G1 to H10.
Material and technical performance of air filters.


Diagrammatic presentation of G1 to H10 filters.
A schematic diagram of the testing device is illustrated in Figure 4. The main air duct is made of a UPVC pipe with a smooth inner wall and divided into two sections with a diameter of Φ160 mm. The experimental dust source is atmospheric dust.

Filter performance testing device.
Experimental equipment
GRIMM1.109 portable aerosol particle spectrometer is adopted to determine indoor–outdoor concentrations of PM10 and PM2.5 for the building. The concentration is recorded every 30 min during sampling, and the data are analyzed by mean value. The SF6 (sulfur hexafluoride) decay method is employed to calculate air exchanges of infiltration airflow, and the concentration of SF6 is measured continuously.
A steady-weather situation is chosen as the experiment environment in order to make the test data comparable. 5 The temperature ranged from 28°C to 32°C with an accuracy of 0.6°C, while the relative humidity ranged from 65% to 87% with an accuracy of 1%.
The condition of the experiment is set as two people working in the office without any smoker. Staff mainly keep remaining seated or walking around, while the printer is powered off.
Measurement of air exchange rate
Under mechanical ventilation, the windows and doors in the room were generally kept closed, while the windows or doors were open for natural ventilation during the sampling days. Equation (5) was used to calculate the air exchange rate
This equation can be expressed as follows, assuming that the air flow rate is constant
where c0 is the initial concentration at t = 0 and c is the concentration of the SF6 tracer gas.
Analysis and discussion
Test results of efficiency performance
According to the test results, the least-squares polynomial is applied to plot the relationship between filtering wind speed and efficiency, which is illustrated in Figure 5.

PM2.5 filtration efficiency with different filter materials.
Experiment was conducted to study the distribution characteristics of PM2.5 filtration efficiency based on the related information of air filters in Table 1. The results indicate that the filtration speed at the peak filtration efficiency for G1 to G4 filters is mostly smaller than engineering application, and it is recommended to reduce the filtration speed approximately to 1.8 m/s when applying a coarse filter in order to improve its filtration efficiency. However, the variation trend for F7 to H10 filters is that the value drops sharply with filtration speed and then declines gently, which is different from coarse filter.
Table 2 presents the quality standards for indoor PM2.5 in various countries, which shows that it is especially important to determine the PM2.5 filtration efficiency of different grade materials under engineering filtration wind speed.
Indoor PM2.5 quality standards.

The test result of air filter efficiency performance is shown in Table 3.
Test results of air filter efficiency performance.

The coarse filter G1 to G4 could filter large particles and be used in mechanical ventilation, while the filtration efficiency of PM2.5 only reaches the value of 1.6%–15.2%. On the other hand, F7 to H10 filters could achieve higher efficiency ranging from 55.6% to 69.7%. Table 3 shows the recommended PM2.5 filtration efficiency for different grades of filters. The test results can guide designers to choose PM2.5 filter reasonably.
Emission source of indoor particulate matter
Figure 6 shows the completed means of the average values versus simultaneous 10-h mechanical ventilation with G2 filter. The regression analysis led to the fitted line of PM10 that has a slope of 0.16, an intercept of 66.0 µg/m3, and R = 0.26, while the fitted line of PM2.5 has a slope of 0.31, an intercept of 55.5 µg/m3, and R = 0.83. The filtration efficiencies of fan coil unit for PM10 and PM2.5 are 11.08% and 5.3%, respectively, due to the low efficiency of G2 filter for PM2.5 and the resulting correlation is greater than that for PM10.

Test results of particulate matter and SF6 concentration. (a) Experimental data of particulate matter and (b) experimental data of SF6.
Equation (3) can be further simplified as shown in equation (7)

The calculation result of equation (7) could make us better understand the proportion of particles that enter the interior space through the building envelope and the sources of exposure. Table 4 shows the calculation results of penetration rate (P) and indoor particle generation rate (G) in the testing room.
Calculation results of P and G of mechanical ventilation.

The results show that penetration rate for PM10 in the building ranged from 0.54 to 0.92, while it is 0.43–0.74 for PM2.5. The penetration rate determines the proportion of particulates that enter the interior through the building envelope. The published literature provides that the PM2.5 penetration rate ranges from 0.7 to 1.0, which shows that most particles can enter a room through cracks of the doors and windows.8,9 Figure 7 shows a comparison of the experimental and predicted PM2.5 penetration rates, from which it is evident that the experimental data matched well with the theoretical results.

Comparison of the theoretical and experimental PM2.5 penetration rates.
According to the American Society of Heating, Refrigeration, Air Conditioning Engineers Handbook, 7 the infiltration rates typically range from 0.1 to 0.8 air changes per hour (ACH). Due to the tight sealing of the maintenance structure such as windows and doors, the air exchange rates are varied from 0.12 to 0.25 h−1 in this test. For rooms with larger ACH, the particle penetration rate can be calculated by this model as well.
Wallace’s 10 study shows that smoking is the most important indoor particle source for office buildings compared with other kinds of indoor pollutants. The calculation results show that the indoor PM2.5 and PM10 generation rates are 14 and 22 mg per cigarette, respectively, during smoking. In addition, other personal activities such as sitting and walking are 0.95 mg/h for PM2.5 and 2.8 mg/h for PM10. Studies are conducted on indoor particulate emission source and concentration change in combination with equation of linear regression, linear fitting curve of indoor-outdoor concentration, as well as indoor concentration decay profile, it can conduct on indoor particulate emission source and indoor concentration change feature of common office buildings. The average dust emission for PM10 is 7.93–12.48 mg/h and 2.89–4.08 mg/h for PM2.5, as shown in Table 4. Through quantitative estimations considering different sources of pollutants from outdoor and indoor space, it could achieve better understanding of quantifying exposure to indoor particles.
Prediction and experimental of indoor particulate matter
The previous literature provided limited information on the effectiveness of air filter in reducing indoor particle concentrations in office buildings. Quantitative assessment of indoor PM2.5 concentration can be used to get better understanding of the exposure and develop effective strategies for controlling indoor exposures.
Figure 8 shows the experimental studies and theoretical analysis of the variation characteristics of the indoor concentration of mechanical ventilation system with G2 filter. The filtration efficiencies of PM10 and PM2.5 are 11.08% and 5.3%, respectively. Due to serious indoor–outdoor particulate pollution, the highest value of indoor concentration appears at 08:00 when the air-conditioning system is turned on. Kang et al. 11 explain that this phenomenon is caused by air turbulence of the air-conditioning unit. The measured median concentrations during sampling days are 108 μg/m3 for PM2.5 and 180 μg/m3 for PM10, which are significantly higher than the quality standards shown in Table 2. Although the filtration efficiency of the filter is relatively low, it can have a considerable influence on indoor concentration. It shows a significant downward trend, and the theoretical average concentrations for PM2.5 and PM10 are 89 and 101 μg/m3, respectively. The indoor PM2.5 concentration occupies 88% of PM10; thus, the indoor particles are mainly contributed by smaller particles (PM2.5).

Variation characteristics of indoor concentration. (a) Variation of indoor PM10 concentration and (b) variation of indoor PM2.5 concentration.
Austen’s 12 study shows that the personal activities appear to be a substantial contributor to indoor concentration, and the number of particles would greatly increase when people are walking around in the room. Figure 8 shows the variation characteristics of indoor particle concentration. The result illustrates an exponent change and a declining curve along with time. Due to the restrictions of the sampling, the tester moving around in the room and particles penetration through the gap of doors and windows will cause a difference between the test data and theoretical analysis to some extent. Meanwhile, the trend of indoor particle concentration is well consistent along with time, R2 = 0.52 for PM10 in Figure 8(a) and R2 = 0.46 for PM2.5 in Figure 8(b). Although the test room is close to the main road and particles could penetrate the room easily, the indoor particle concentration is not significantly affected by outdoor concentration due to indoor ventilation and purification. 13
Controlling strategy for indoor particulate
Since people are living in many spaces including residence, office, outdoors, and other micro-environments, they would be exposed to particulate matter. Zhipeng et al. 14 have specifically studied the respiratory rate of adults in different environments, as shown in Table 5.
Respiratory rate of adults in different environments.

Figure 9 shows the dose (mg) for PM10 and PM2.5 using two ventilation methods. The dose for PM2.5 with filtering system is generally 0.9 ± 0.13 mg, while that with open windows for natural ventilation is 1.6 ± 0.13 mg. It can obviously be seen that mechanical ventilation systems can significantly reduce personal exposure to indoor particulate.
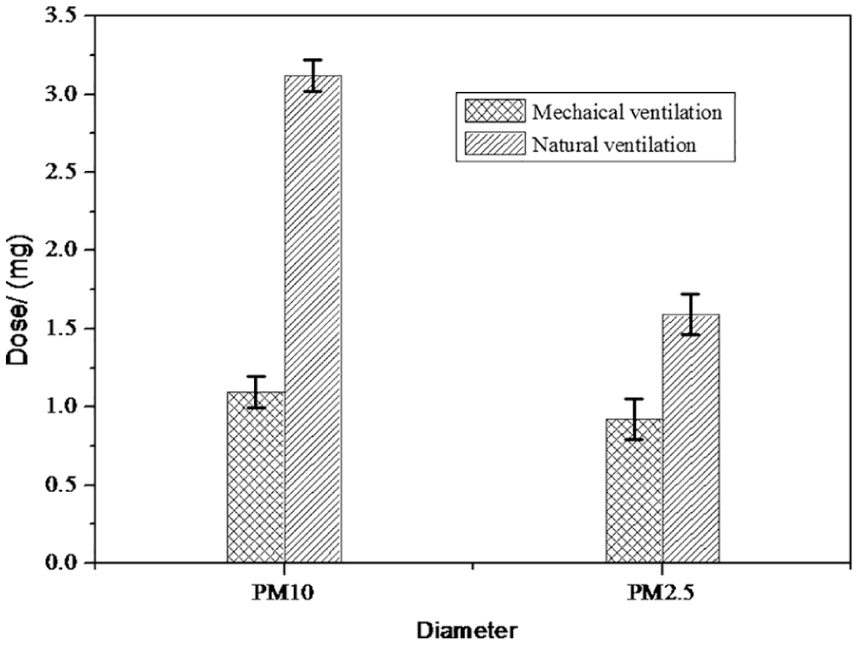
Doses of PM10 and PM2.5 of mechanical and natural ventilation.
A mathematical model for controlling indoor PM2.5 concentration level is developed based on the monitoring data of filtration efficiency. Air-conditioning system for fan coil unit has been widely used because of its advantages of small occupied space and easy adjustment. Due to the limitation of the fan residual pressure,15,16 the conventional filter efficiency configuration cannot be too high. Figure 10(a) shows that air volume decreases accompanied with the increase of residual pressure caused by resistance of filtration. Therefore, the filter efficiency of fan coil unit is limited accordingly.

Theoretical value and experimental data of indoor PM2.5 concentration. (a) Curve of air volume with residual pressure and (b) variation of indoor PM2.5 concentration with filter material for G3 and G4.
The filtration efficiencies for G3 and G4 are 10.6% and 15.2% with initial resistances of 23.1 and 27.5 Pa, respectively. Taking residual pressure 60 Pa as an example, G3 and G4 filters can be used in air-conditioning system. Meanwhile, Figure 10(b) shows that the theoretical value and experimental data of indoor PM2.5 concentration with coarse filter, using G4 filter can obviously reduce the indoor particulate concentration to 69–75 μg/m3. It ranges from 87 to 90 μg/m3 using a G3 filter, while the outdoor PM2.5 concentration is 135–150 μg/m3.
Conclusion
This article presents a model for controlling indoor particulate of mechanical ventilation based on the efficiency test with different filter materials. The accuracy of this model was tested and validated by experiments in a certain office building in Xi’an. Within the scope of this work and cases, the following conclusions can be drawn:
Coarse filters with G1 to G4 are used in mechanical ventilation to filter larger particles. However, it can only achieve 1.6%–15.2% for PM2.5 filtration efficiency. On the other hand, F7 to H10 filter could reach high efficiency of 55.6%–69.7%.
Combining linear regression and linear fitting curve of indoor with outdoor monitoring concentration, it could be calculated that the average dust emission for PM10 in the building is 7.93–12.48 mg/h, while for PM2.5, it is 2.89–4.08 mg/h.
The indoor PM2.5 concentration with coarse filter, using G4 filter can obviously reduce the indoor particulate concentration to 69–75 μg/m3. It ranges from 87 to 90 μg/m3 using a G3 filter, while the outdoor PM2.5 concentration is 135–150 μg/m3.
Footnotes
Declaration of conflicting interests
The author(s) declared no potential conflicts of interest with respect to the research, authorship, and/or publication of this article.
Funding
The author(s) disclosed receipt of the following financial support for the research, authorship, and/or publication of this article: This project was supported by the National Key Project of the Ministry of Science and Technology, China on “Green Buildings and Building Industrialization” through Grant (No. 2016YFC0700500).