
Abstract
There has been a rapid increase in the standard of living and economic development, contributing to the rise of various environmental pollutants, such as PM, NO2, O3, CO, CO2, SO2, and VOCs. Particulate matter is primarily categorized into PM 2.5 and PM10. Prolonged exposure to high concentrations of air pollution and pathogens increases the risk of respiratory diseases. If air pollutants in hospitals can be filtered, indoor air quality can be improved. Therefore, electrospinning technology is used to blend polyimide (PI) and polyetherimide (PEI) to fabricate a polymer fiber membrane under varying operational factors, such as the PI/PEI ratio, flow rate, voltage, and spinning time, for air pollutant filtration testing. The optimal conditions—20 % of PI/PEI, a flow rate of 0.9 mL h-1, voltage of 23 kV, and spinning time of 6 h-yielded a filtration efficiency of 91.86 % and a filtration quality of 0.0273 Pa-1.
Introduction
The development of the medical and hospital industries has progressed rapidly due to the swift advancement of technology, similar to other industries, which has improved living standards and contributed to economic growth. However, this progress has also led to the emergence of various environmental pollutants, such as particulate matter (PM), nitroxides (NOx), Ozone (O3), carbon oxides (CO), carbon dioxides (CO2), sulfate oxides (SOX), and volatile organic carbons (VOCs), along with environmental issues such as greenhouse gases (GHGs), which affect global temperatures and contribute to rapid climate system changes.1–3 PM was primarily categorized into PM2.5 and PM10, with a particle size smaller than 2.5 µm, which can enter the inhalation system and reach the gas exchange interface of the lungs. PM10, with a particle size around 10 µm, can reach the lower respiratory tract. The impact of COVID-19 in the past three years has increased the number of confirmed cases due to airborne transmission of viruses and bacteria, leading to worsened air quality.4–6
To address health hazards associated with indoor air quality, the Environmental Protection Agency (EPA) in Taiwan announced the Indoor Air Quality Standards in 2012 to manage indoor air pollution. 7 The EPA also proposed strategies for policy and project management to efficiently maintain indoor air quality and protect public health. Historical research shows that the primary sources of bacteria and fungi during summer and fall are anthropogenic activities, air conditioning systems, and indoor air pollutants in hospitals. However, outdoor air pollutants significantly impact indoor air quality through window and ventilation exchange systems.8,9 Additionally, changes in the outdoor environment can influence the concentration of microorganisms, as fluctuations in relative humidity and temperature strongly affect indoor fungal levels.10,11 Air pollution in hospitals included PM, CO, CO2, bioaerosol, and VOCs. Prolonged exposure to high concentrations of air pollutants and bacteria increases the risk of respiratory diseases. Accordingly, this study employed the electrospinning process to generate a polymer fiber membrane by mixing polyimide (PI) and polyetherimide (PEI) for filtering air pollutants in hospitals due to its high filtration efficiency for micrometer-sized air pollutants and low manufacturing process. Moreover, before and after filtration tests could be used to evaluate progress of air quality in hospitals.
Methods
Sample of polymer materials
Polyimide is a thermal-resistant material known for its high thermal stability and highly stable physical properties. It also possesses excellent mechanical properties, proper conductivity, superior radiation resistance, and stable particle size for further applications on semiconductor and photoelectric materials.12,13 Polyetherimide also exhibits exceptional conductivity, high mechanical strength, and outstanding thermal stability, accompanied by a density of 1.27 g cm-3, so there is no damage caused by continuous use under environmental conditions of 170°C. Moreover, PEI is widely applied in processing and manufacturing industries due to its high strength and rigidity.14–17 In addition to the above applications, PEI is broadly used in printed circuit boards and electronic component materials because of its stable electrical properties. Due to its high thermal stability, excellent mechanical properties, and strong acid and alkali resistance, PEI is also used in aerospace and automobile industries, such as for vehicle headlights and airplane seats. 18 Both of PI and PEI are reagent grade, and PI and PEI were purchased from Biosynth company and Sigma-aldrich company, respectively.
Electrospinning process
There are five elements in the electrospinning facility, including a high DC voltage supplier, injection pump, injector, spinneret, and collector plate. Figure 1 shows a flow chart of the electrospinning process.
19
The process is described as follows: the polymer solution is filled in an injector equipped with a spinneret (a metal needle), while the anode with high DC voltage is connected to the spinneret, and the cathode is linked to the collector plate. Meanwhile, a high DC voltage field provides an electric attraction force to the polymer solution, causing the solution at the spinneret tip to interact with the surface tension. This interaction forms a Taylor cone when the electric force and surface tension are balanced.
19
When the electric attraction force exceeds the surface tension, the polymer solution emits multiple continuous flows. Each flow acquires a positive charge, leading to a whipping phenomenon, where the flow oscillates up and down before solidifying as a nanofiber membrane on the collector plate. The electrospinning process uses an external electric field applied to a polymer solution to form a polymer fiber membrane with a diameter ranging from micrometers to nanometers. Due to its high specific surface area and low pore diameter, the polymer fiber membrane is widely used in various applications, such as nano-catalyst, tissue engineering, protective coatings, filtration, biomedicine, pharmaceutical manufacturing, optical electronics, healthcare, national defense, and environmental engineering.20,21 Flow chart of the electrospinning process
19
.
Moreover, several operating parameters affect the electrospinning process, such as flow rate, applied voltage, spinning time, and the distance between the collector plate and the spray nozzle. These parameters influence the characteristics of the electrospun materials, including specific surface area, porosity, mechanical strength, and morphology. In addition, many polymer solutions have been used to produce fiber membranes due to the simplicity and flexibility of the electrospinning process. Examples include poly(lactic acid),22–25 polyurethane,26–28 polycaprolactone,29–34 and polytetrafluoroethylene,35–37 which can be spun into nanometer-sized materials.
Particulate matter monitor system
Air pollutants in the hospital include CO, CO2, PM, bioaerosol, and VOCs. The aerosol monitor used to measure PM levels was the TSI 8530 DustTrak II Desktop Aerosol Monitor. The analytical principle of this monitor is light scattering. When the sample passes through the inlet of the inspection area, a laser dioxide emits a light beam onto the sample. Due to the varying particle sizes, the light scatters at different angles. The scattered light is collected by a spectrometer using a concave mirror, and the mass concentration of the sample is calculated through parameter mapping. The experimental process began by turning on the monitor to allow warming and to remove residual material from the previous test. Next, the sample was measured using an appropriate measurement mode and operation time. As dust entered the monitor inlet, the concentration was displayed on the monitor, and the variation in PM concentration was determined by analyzing the collected sample data.
Carbon dioxide capture system
Carbon dioxide tends to absorb infrared, making it widely used for detecting CO2 concentrations in the atmosphere. According to the regulations on indoor air quality inspection management from the Ministry of Environment, the infrared method (NIEA A448.11 C) is the standard method for CO2 detection. This method includes two types based on the light source: the non-dispersive infrared method and the gas filter correlation infrared method. If the light source is non-dispersive infrared, it is referred to as the non-dispersive infrared method. If a gas filter (containing high concentrations of CO2/N2) is installed along the light source path, it is called the gas filter correlation infrared method. 38 The CO2 analytical detector is a portable device that measures CO2 concentration in the atmosphere using infrared. This detector features a fast response time (less than 2 min) and a detection limit of 1 ppm. The specifications of this detector are as follows: detection range (0−6000 ppm), temperature detection range (−20−60°C), and humidity detection range (10−95% RH).
Thermal stability analysis
Based on conventional thermoanalytical theory, differential scanning calorimetry (DSC, Mettler TA8000 system) is a commonly used method to examine the decomposition behavior of a sample. The principle of DSC involves performing temperature-programmed screening experiments using a measuring cell that can withstand relatively high pressures of up to approximately 100 bar (DSC 821e). DSC and STARe software were used to obtain thermal curves. Thermal equilibrium was evaluated using DSC at four heating rates (b): 2.0, 4.0, 8.0, and 16.0°C min-1. Samples weighing 3.0–10.0 mg were used in the experiments. The temperature was increased from 30.0 to 350.0°C, a range previously determined under various preset conditions,39,40 and this setting was used to perform dynamic scanning.
Thermogravimetry (TG) is widely employed to evaluate the decomposition process of a sample with temperature variations. A Pyris 1 TG analyzer (PerkinElmer Taiwan Corporation) was used to measure the sample’s mass loss during decomposition, with operating conditions set at a scanning rate of 20°C min-1, a temperature range of 30 to 800°C, and a sample weight of 5.0–10.0 mg.41,42
Results and discussion
Thermal analysis of fiber membrane via thermal calorimeter
Thermal analysis is a general method used to evaluate the thermal stability of a sample, which is critical for assessing its long-term service life. Common techniques include thermogravimetry (TG) and DSC. Additionally, fiber membrane formation is influenced by the thermal resistance of the material. Therefore, in this study, TG was conducted under a heating rate of 10°C min-1 in a nitrogen atmosphere to the thermal resistance of fiber membranes with different PI/PEI ratios. DSC, also at a heating rate of 10°C/min, was used to measure the glass transition temperature (Tg) of the fiber membranes. As shown in Figure 2, significant massive mass variations for different PI/PEI ratios were observed at approximately 150°C and 500°C according to the TGA results. The weight loss around 150°C was attributed to the evaporation of residual organic compounds and solvents, while the major weight loss at around 500°C was due to molecular chain degradation. The weight loss curves for different PI/PEI ratios showed similar patterns, indicating that PI/PEI possesses high-temperature resistance. Furthermore, the DSC test revealed that the Tg of the PI/PEI ratio of 1:9 reached a maximum value of 215°C. Slight variations in Tg were observed for other ratios, such as 211°C and 207°C for PI/PEI ratios of 2:8 and 3:7, respectively. These results suggest that PI/PEI fiber membranes exhibit thermal stability under high-temperature conditions. Weight loss (a) and heat flow variation (b) of PI/PEI with different ratios by TGA and DSC.
Morphology appearances of PI/PEI with different ratios by SEM
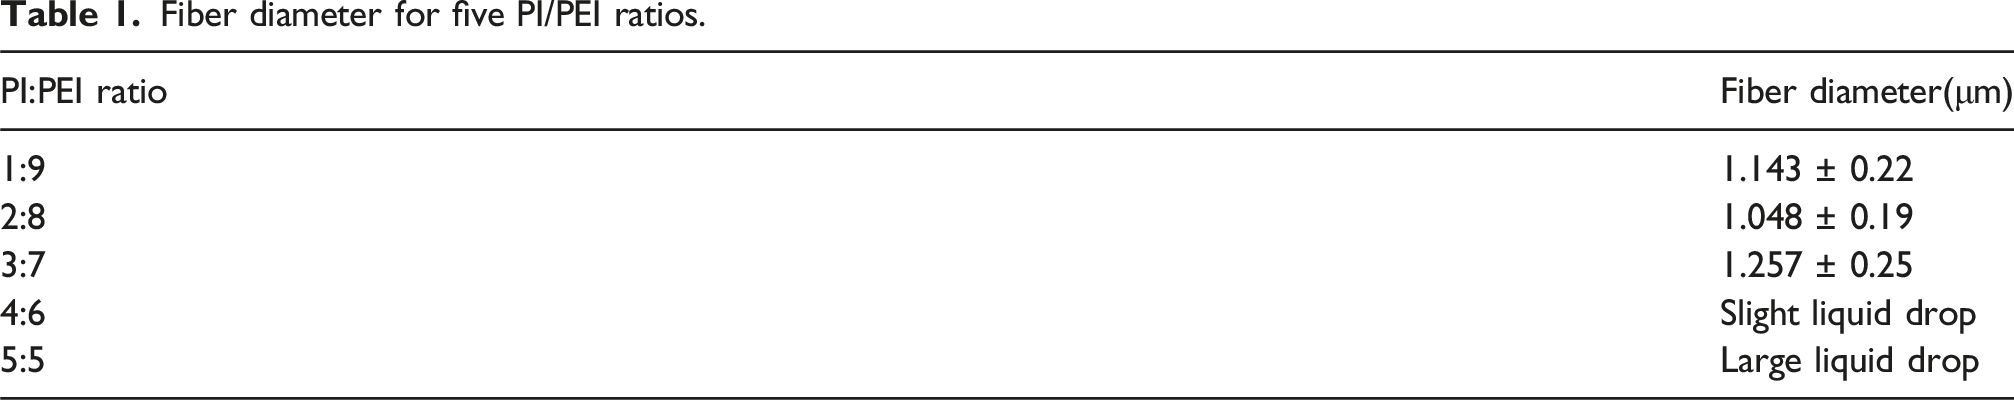
Different PI/PEI ratios, such as 1:9, 2:8, 3:7, 4:6, and 5:5, were used to observe the morphology variation of fiber membranes. Figure 3 shows that the Taylor cone in front of the needle was not stable during the electrospinning process when the PI ratio adjusted above 4, and the emitted flow appeared discontinuous, inducing liquid drops on the fiber membrane. When the PI ratio increased to 5:5, many liquid drops appeared on the surface of the fiber membrane. As a result, PI ratios adjusted below 3:7 generated integrated fibers without liquid drops. Furthermore, Table 1 shows that the fiber diameters were 1.143, 1.048, and 1.257 µm for PI/PEI ratios of 1:9, 2:8, and 3:7, respectively, which corresponded to the SEM results, as unintegrated fiber generation occurred when the PI/PEI ratio increase to 4:6 and 5:5. The smallest fiber diameter was observed at a PI/PEI ratio of 2:8, so this ratio was used for further tests. Morphology of PI/PEI with five ratios by SEM analysis. (a) 1:9 (b) 2:8 (c) 3:7 (d) 4:6 (e) 5:5. Fiber diameter for five PI/PEI ratios.
Variation of fiber membrane generation via Orthogonal Array

Filtration analysis of various fiber membranes with four factors and three levels using the Orthogonal Array of L9(3 4 ).

Equation (1) shows the calculation of filtration quality, where Qf, P, and ΔP denote filtration quality, penetration efficiency, and pressure loss, respectively.
Evaluation of S/N ratios and the order of influence of each factor.

Filtration quality and filtration efficiency test of fiber membrane
Evaluation of S/N ratios and the order of factor influence on filtration quality.

Evaluation of S/N ratios and the order of factor influence on filtration efficiency.

Multiple tests of filtration efficiency and filtration quality at different operating times.

PI/PEI: 20wt%, Flow: 0.9 ml/hr, Voltage: 23 kV, Time: 2, 4, 6h.
Filter efficiency and quality comparison of different materials.


Penetration tests of the fiber membrane at different operating times. (PI/PEI: 20wt%, Flow: 0.9 ml/hr, Voltage: 23 kV).
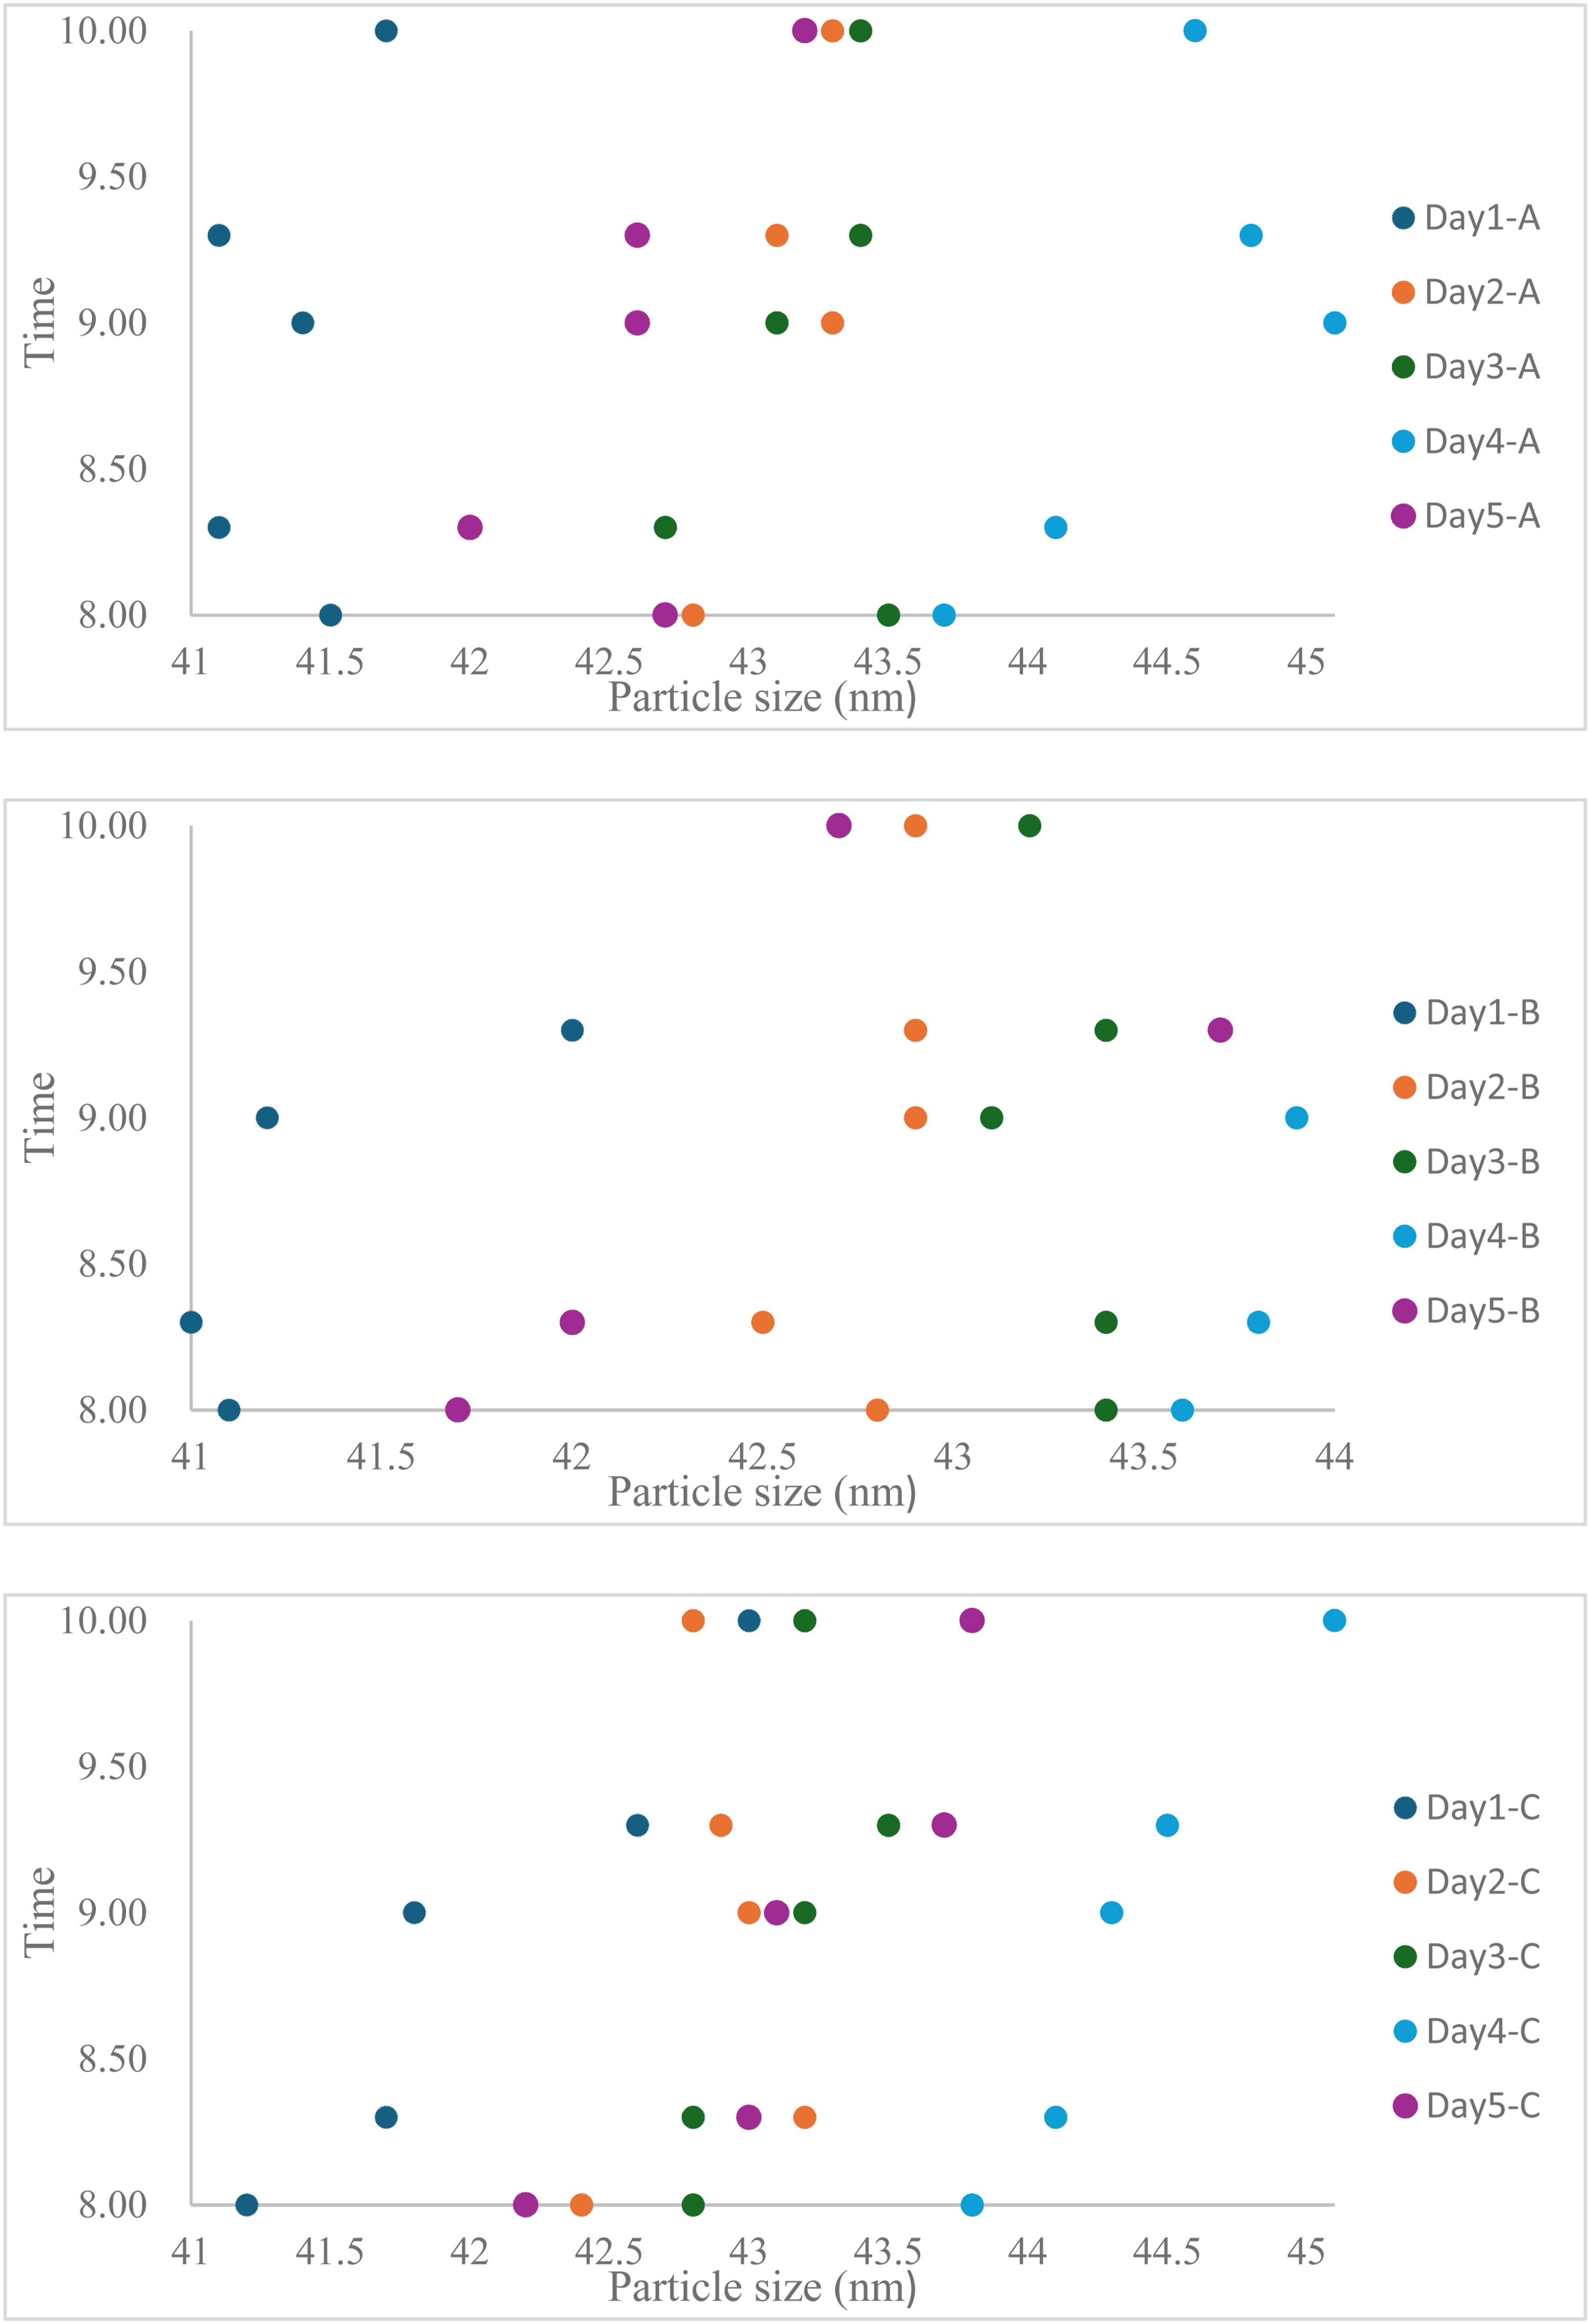
Particle size distribution over time at three locations. (Location A-C: Entrance area; Observation area; Emergency area; Time record: 8:00, 8:30, 9:00, 9:30, 10:00 AM).
The CO2 distribution over time changed substantially at places A to C, ranging from 500 to 1600 ppm, as shown in Figure 6. Most CO2 measurements at place A were below the indoor air quality index of 1000 ppm.
48
However, the mode CO2 levels at places B and C exceeded 1000 ppm. The CO2 distribution varied noticeably from place A to C due to the geographic characteristics of the locations. The gas circulation at place A changed more rapidly than at places B and C because of frequent gas air exchange between the outdoor environment and place A, resulting in most CO2 levels at place A remaining below the indoor air quality index of 1000 ppm. However, the air at places B and C was primarily indoor air, leading to slower gas circulation and higher CO2 concentrations, with the mode values exceeding the air quality index of 1000 ppm. Therefore, enhancing gas circulation could be considered to address the issue at places B and C. CO2 distribution over time at three locations. (Location A-C: Entrance area; Observation area; Emergency area; Time record: 8:00, 8:30, 9:00, 9:30, 10:00 AM).
Conclusion
Based on the demand for air pollution elimination, this study developed a polymer fiber membrane via the electrospinning process to filtrate air pollutants. Thermal calorimetry tests, including DSC and TG, were applied to evaluate the thermal stability of the fiber membrane. From the DSC test results, the Tg of the PI/PEI ratio of 1:9 reached a maximum value of 215°C, and the Tg value slightly changed with variations in the PI/PEI ratio, such as 211°C and 207°C for PI/PEI ratio of 2:8 and 3:7. Moreover, TGA results showed that significant weight loss occurred at a heating temperature of 500°C, indicating that the PI/PEI membrane had high-temperature resistance.
In summary, the PI/PEI fiber membrane demonstrated thermal stability at elevated temperatures and thus exhibited high potential for application. In addition, SEM tests showed morphological variations in the PI/PEI fiber membrane, and a PI/PEI ratio of 2:8 produced fiber with the smallest diameter.
The Orthogonal Array of L9(3 4 ) was used to determine the most suitable operational factors for generating a fiber membrane with excellent filtration efficiency and quality. Accordingly, 20 % of PI/PEI, a flow rate of 0.9 mL h-1, 23 kV of voltage, and a spinning time of 6 h were identified as optimal conditions, achieving a filtration efficiency of 91.86 % and a filtration quality of 0.0273 Pa-1.
This study applied three different operating times (2, 4, and 6 h) with the above optimal operational conditions to produce three fiber membranes in order to obtain the best penetration efficiency. A spinning time of 6 h filtered the mode air pollutant at a particle size above 30 nm. Therefore, this fiber membrane demonstrated potential for the filtration of air pollutants. The air pollution sample consisted of particles exceeding 30 nm, confirming that the fiber membrane produced in this study was effective.
However, the CO2 distribution exhibited different trends at places A to C. Most CO2 levels at place A were below the indoor air quality index of 1000 ppm, while the mode CO2 values at places B and C exceeded 1000 ppm. This variation was likely due to the geographic characteristics of the locations. The gas circulation of place A changed more rapidly than at places B and C due to more frequent gas circulation between the outdoor environment and place A. Therefore, enhancing gas circulation could be considered to address the issue at places B and C.
This study demonstrates a sustainable approach to produce PI/PEI fiber membrane with enhancement of air polution reduction, directly contributing to UN SDG 9 (Industry, Innovation, and Infrastructure) and SDG 11 (Sustainable Cities and Communities) through great performace of air pollution elimination.
Footnotes
Funding
The authors disclosed receipt of the following financial support for the research, authorship, and/or publication of this article: Lo-Hsu Medical Foundation, Lotung Poh-Ai Hospital, Smc113-E-03.
Declaration of conflicting interests
The authors declared no potential conflicts of interest with respect to the research, authorship, and/or publication of this article.