
Abstract
This study systematically investigates the prognostic value and clinical significance of PANoptosis-related genes in bladder cancer (BC). By integrating the TCGA and GEO databases, two PANoptosis molecular subtypes with significant survival differences were identified, with the C2 subtype demonstrating a more favorable prognosis. A prognostic model comprising nine key genes was constructed, demonstrating robust risk stratification capabilities in both training and validation sets. Further analysis revealed that high-risk patients exhibited distinct immunosuppressive microenvironment characteristics, including enrichment of Treg cells and M2 macrophages. Single-cell sequencing analysis elucidated the cell-type-specific expression patterns of these genes within the tumor microenvironment. Experimental validation confirmed the significant overexpression of KCNJ15, FASN, and ADAMTS12 in BC tissues. The prognostic model established in this study provides a novel tool for risk stratification of BC patients while simultaneously establishing the foundation for in-depth exploration of PANoptosis mechanisms in BC.
Introduction
Bladder cancer (BC) ranks as the second most common urogenital malignancy after prostate cancer. This disease demonstrates high recurrence rates and significant mortality, contributing to substantial public health challenges and imposing a considerable socioeconomic burden on health care systems globally (Bhanvadia, 2018; Lopez-Beltran et al., 2024). Based on histological characteristics, BC is primarily classified into non-muscle-invasive BC (NMIBC) and muscle-invasive BC (MIBC) (Seidl, 2020). NMIBC is confined to the urothelium and lamina propria, typically managed clinically with transurethral resection of bladder tumor combined with Bacillus Calmette-Guérin instillation therapy, resulting in a favorable prognosis. In contrast, MIBC infiltrates the detrusor muscle layer or beyond, usually requiring radical cystectomy, urinary diversion, or trimodal therapy (maximal endoscopic resection, radiosensitizing chemotherapy, and radiotherapy), with poor clinical prognoses generally (Lenis et al., 2020; Lopez-Beltran et al., 2024; Pettenati & Ingersoll, 2018). Although novel therapeutic strategies such as immune checkpoint inhibitors, targeted therapies, and antibody–drug conjugates have shown clinical benefits in BC in recent years, marked variability in treatment efficacy persists due to the high molecular heterogeneity of BC and the complexity of drug resistance mechanisms. Consequently, some patients still face a high risk of recurrence and progression (Konala et al., 2022; R. Li, Hensley, et al., 2024; Patel et al., 2020; Yu et al., 2023). An urgent need exists to elucidate the molecular mechanisms underlying BC initiation and progression, identify potential biomarkers and key regulatory networks, and advance more precise molecular classification, risk stratification, and individualized prognostic assessment.
Programmed cell death (PCD) is a critical mechanism for maintaining cellular homeostasis and regulating disease pathogenesis, assuming a key role in tumorigenesis and development (F. Peng et al., 2022; Tower, 2015; Yuan & Ofengeim, 2024). PANoptosis has emerged as a prominent research focus as an integrated PCD modality that combines characteristic features of pyroptosis, apoptosis, and necroptosis (Sun et al., 2024). PANoptosis demonstrates a distinct regulatory mechanism compared with traditionally defined PCD pathways. This integrated cell death process operates through the PANoptosome complex, which recruits key molecular components from multiple cell death pathways—including ZBP1, AIM2, RIPK1, and NLRP12—to coordinate immune activation, pathogen clearance, and tumor cell elimination (Z. Qi et al., 2023; Sun et al., 2024; P. Zhu, Ke, et al., 2023). A study suggests that PANoptosis may regulate cell growth, proliferation, development, and drug resistance in various malignancies (Xiong, 2023). Multiple studies indicate that PANoptosis may reshape the tumor immune microenvironment (TIME) by modulating immune cell infiltration, thereby influencing immunotherapy efficacy (Jiang et al., 2024; Y. Li & Wu, 2024; Wang et al., 2023). Systematic assessment of PANoptosis-related genes (PRGs) in tumors is of key theoretical value and clinical translational significance for advancing tumor understanding and uncovering novel biomarkers. Currently, although the relevance of PANoptosis in tumor immunity and treatment response is increasingly recognized, its molecular mechanisms and clinical significance in BC remain inadequately explored. In particular, the relationship between PRGs and BC patient prognosis is not yet clear.
This study aims to systematically evaluate the expression profiles and prognostic value of PRGs in BC. We integrated data from TCGA database and the GEO database to analyze differential expression and survival associations of PRGs. Molecular subtypes were identified through consensus clustering. We constructed prognostic models by combining WGCNA, LASSO, and other methods, and validated their robustness in external datasets. The associations of the model with immune infiltration, immunotherapy response, and clinical characteristics were explored. scRNA-seq data were utilized to analyze the distribution and expression of key genes to offer distinct methods for precise molecular typing and personalized therapy in BC.
Materials and Methods
Data Acquisition and Preprocessing
Two BC datasets were obtained from the TCGA database (https://portal.gdc.cancer.gov/) and the GEO database (https://www.ncbi.nlm.nih.gov/geo/), designated as the training set (TCGA-BLCA), comprising 412 BC tumor samples and 19 normal samples, and the validation set (GSE13507) with 165 BC tumor samples, respectively. In addition, a BC single-cell dataset (GSM4307111) was retrieved from GEO. We conducted quality control, normalization, principal component analysis (PCA) dimensionality reduction, and t-SNE visualization through the “Seurat” package (Cao et al., 2023). 65 PRGs were sourced from previous research (J. Zhu, Huang, et al., 2023), including 32 apoptosis genes, eight necroptosis genes, and 25 pyroptosis genes (Supplemental Table S1).
Differential Expression Analysis and Screening of Prognosis-Related PANoptosis Differentially Expressed Genes
We performed differential expression analysis on the 412 BC tumor samples and 19 normal samples in the training set using the “edgeR” R package (Chen et al., 2025). Genes with |logFC| ≥ 0.585 and false discovery rate (FDR) < 0.05 were regarded as significantly differentially expressed genes (DEGs). Subsequently, DEGs were intersected with the known PRGs utilizing Venn analysis to obtain differentially expressed PRGs relevant to BC. Univariate Cox regression analysis was employed to assess the correlation of these genes with prognosis, identifying the prognostic PRGs with statistical significance (p < .05).
Identification of PANoptosis-Related Subtypes and Functional Enrichment Analysis
In light of the prognosis-related PRGs, the “ConsensusClusterPlus” R package (Zhang et al., 2024) was leveraged to perform consensus clustering analysis on BC samples in the training set. The optimal cluster number was selected for subtyping to identify molecular subtypes with distinct PRG expression profiles. Subsequently, we assessed survival differences within subtypes and plotted Kaplan–Meier (K-M) survival curves to visualize prognostic heterogeneity. The “edgeR” package was employed for differential expression analysis between the two subtypes, with the threshold set at |logFC| ≥ 0.585 and FDR < 0.05, to recognize DEGs between subtypes. These DEGs were then intersected with the DEGs obtained from comparing tumor tissue with normal tissue, yielding a set of key genes that are both closely related to PANoptosis subtyping and markedly abnormal expression in BC tissue. Employing these key genes, KEGG and GO enrichment analyses were implemented via the “clusterProfiler” R package (W. Peng, Yang, et al., 2024) to preliminarily explore their possible biological functions and signaling pathways.
WGCNA
To further identify key gene modules associated with BC, a WGCNA was implemented, taking these genes obtained from the intersection of the two DEG sets. First, the expression matrix of the intersection genes was preprocessed utilizing the “WGCNA” R package (Langfelder & Horvath, 2008), including sample clustering detection and outlier removal. Subsequently, employing the function “pickSoftThreshold,” the scale-free topology fit index was calculated across multiple soft-thresholding powers. Power = 4 was selected as the optimal soft threshold to meet the scale-free network criterion. Following adjacency matrix construction and topological overlap matrix transformation, gene modules were identified through hierarchical clustering. The one most relevant to tumor samples was screened via module–trait correlations. Genes in this module were designated as candidate key genes for the following analysis.
Screening of Prognosis-Related Genes, Mutation Analysis, and Prognostic Model Creation and Verification
The candidate key genes obtained from WGCNA analysis were subjected to univariate Cox regression analysis to recognize genes markedly related to BC prognosis (p < .05). Concurrently, a mutation waterfall plot was generated to visualize the mutational landscape of these candidate genes in BC samples. To avoid overfitting and improve prediction performance, candidate genes were refined via LASSO Cox regression to construct the prognostic model. Its discriminatory performance was evaluated utilizing time-dependent receiver operating characteristic (ROC) curves, with area under the curve (AUC) quantification at 1, 3, and 5 years.
To further validate the robustness and predictive power of the prognostic model, the risk score was calculated for all samples in the training/validation set, as well as single-cell dataset. Samples were divided into high-/low-risk groups via the median risk score. Subsequently, the distribution of survival status (Alive vs. Dead) was compared across risk groups in the training and validation sets. Scatter plots depicting risk scores versus survival outcomes were generated to visualize this relationship. In the single-cell dataset, a t-SNE plot was generated to illustrate the model’s stratification effect. In addition, K-M survival curves were generated in the two sets to compare overall survival discrepancies across risk groups, evaluating the model’s survival stratification capability.
Analysis of Independent Prognostic Factors
To verify the independent prognostic value of the constructed model in BC patients, univariate and multivariate Cox regression analyses were performed on the training set samples. The risk score was incorporated with all clinical characteristics (e.g., age, gender, stage) in the regression analysis to assess whether the risk score could serve as an independent prognostic factor.
Mutation Analysis and Immune Infiltration Assessment
To figure out discrepancies in mutational characteristics between different risk groups in BC, mutational spectrum analysis was performed on two risk groups based on gene mutation data from the training set using the “maftools” R package (Awasthi et al., 2024). Waterfall plots were generated to visually display the types, positions, and frequencies of frequently mutated genes in each group. To evaluate differences in the TIME between risk groups, the CIBERSORT algorithm was employed to analyze immune cell infiltration and immune function enrichment for each sample in the training set. The CIBERSORT algorithm implemented in R was employed to calculate the relative abundance of various immune cell types and scores for immune function. Differences in the two groups were compared. Bar plots of the relative composition of immune cells were plotted to visualize the immune infiltration characteristics of the different risk groups.
The Tumor Inflammation Signature Score Analysis
Tumor inflammation signature (TIS), composed of 18 genes, represents the gene expression signature of T-cell inflammation across various tumor types and is commonly utilized to evaluate the clinical benefit of immune checkpoint inhibition therapy (Ayers et al., 2017; Damotte et al., 2019). We collected the 18 representative TIS genes (Supplemental Table S2) and calculated the TIS score for each sample employing the “GSVA” package (Su et al., 2024). Samples were divided into high/low TIS groups by the median TIS score, with subsequent survival analysis to examine associations between TIS, immune infiltration, and risk scores.
Association Analysis of Risk Score With Clinical Features, Immune-Related Gene Prognostic Index, and Immune Subtypes
To clarify the association between the constructed risk model and the clinical characteristics of individuals with BC, we analyzed the distribution discrepancies of two risk groups across T, N, M, and overall clinical stage. Visualization and statistical tests were employed to evaluate the model’s discrimination ability between patients at different clinical stages, thereby verifying its potential application value in stratified management.
To validate the effectiveness of our model, we introduced a previously reported immune-related gene prognostic index (IRGPI) of BC (Tian et al., 2020) as a reference for comparison. This model was conducted based on six immune-related genes (CTSE, CXCL10, FAM3B, MMP9, OLR1, and S100P). We calculated the IRGPI value for each sample following the published method and divided the training set into IRGPI-high and IRGPI-low groups according to the median IRGPI value. Subsequently, within the training set, the proportion of patients in different clinical stages within each IRGPI group was analyzed to evaluate the relevance between the IRGPI index and BC clinical progression.
In addition, to figure out the association between the immune characteristics represented by the IRGPI index and different tumor immune subtypes, we adopted the classification system of six immune subtypes (C1–C6) proposed by Vésteinn Thorsson et al. (2018). The system categorizes tumor immune phenotypes into six subtypes: C1: Wound Healing, C2: IFN-γ Dominant, C3: Inflammatory, C4: Lymphocyte Depleted, C5: Immunologically Quiet, and C6: TGF-β Dominant. These subtypes exhibit noticeable differences in immune cell infiltration characteristics, Th1/Th2 ratio, tumor heterogeneity, aneuploidy, neoantigen load, cell proliferation activity, immunomodulatory gene expression, and prognosis. We obtained the “Model-based Immune Subtype” dataset (Subtype_Immune_Model_Based.txt, version: 2018-04-03) containing immune subtype information of 9126 samples from the UCSC Xena platform (Pan-Cancer [PANCAN] project) (Supplemental Table S3). Within the training set, we analyzed the distribution differences of the two IRGPI groups across multiple immune subtypes to understand the possible link between IRGPI and TIME.
Immunotherapy Response Evaluation
Model risk, TIDE (Tumor Immune Dysfunction and Exclusion), and TIS scores were calculated for all training set samples to assess the model’s predictive capacity for immunotherapy response. ROC curves for these three scores were plotted to compare their predictive performance. Discrepancies in the comprehensive TIDE, Immune Dysfunction, and Exclusion scores between the two risk groups were assessed to reveal the model’s probable application in predicting immune response status. Statistical differences between groups were determined using the Wilcoxon rank-sum test.
scRNA-seq Data Analysis
To further elucidate the expression characteristics and potential biological significance of key prognosis-related genes across distinct cell types, we downloaded and analyzed a publicly available BC scRNA-seq dataset (GSM4307111) from GEO. Single-cell analysis was primarily conducted using the “Seurat” R package. First, raw data from GSM4307111 underwent standardized preprocessing. When creating the Seurat object, parameters were set to min.cells = 3 (to retain genes expressed in at least 3 cells) and min.features = 50 (to filter out low-quality cells with very few detected features). The “PercentageFeatureSet” function was then utilized to calculate mitochondrial gene expression proportion per cell (“MT-” prefix used for matching). For quality control, cells with nFeature_RNA < 50 and those with mitochondrial gene percentage >5% were filtered out. The filtered cell data were prepared for subsequent analysis. Violin plots and scatter plots were generated to demonstrate the distribution and correlation of nFeature_RNA, nCount_RNA, and percent.mt, providing an intuitive assessment of data quality. After data normalization and identification of highly variable genes, PCA was performed for dimensionality reduction. Following the determination of the number of principal components, cell clustering analysis was completed leveraging the FindNeighbors and FindClusters functions. Subsequently, cell types were identified by referencing the human cell annotation gene set (ref_Human_all.RData), followed by the annotation of various subtypes. To deeply explore the expression distribution of key prognostic genes across different cell populations, a bubble plot was generated to display the expression of the feature genes included in the prognostic model within various cell subpopulations, revealing their potential cellular origins.
Clinical Sample Collection
This study enrolled five BC patients. All subjects offered written informed consent. Inclusion criteria included age ≥18 years; pathological diagnosis of BC with confirmed pathological type; completion of tissue sample collection prior to receiving radiotherapy, chemotherapy, or immunotherapy; and possession of complete clinical data. Exclusion criteria were: concurrent other malignancies or severe systemic diseases (e.g., severe cardiac, hepatic, renal dysfunction); acute infection, surgical procedures, or other major stress events within 1 month; pregnancy or lactation; and insufficient tissue RNA quality during sample collection or processing. One cancerous tissue sample (BC) and one corresponding adjacent normal bladder tissue sample (NC) were collected from each patient, totaling five paired tissue samples. Fresh tissues underwent immediate liquid nitrogen snap-freezing post-resection prior to RNA isolation.
Cell Culture
The human BC cell line T24 was purchased from Sunncell (SNL-038; Sunncell, China). The cells were cultured in RPMI 1640 medium (11875093; Gibco, USA) supplemented with 10% fetal bovine serum (FBS; 10099141C; Gibco) and 1% Penicillin-Streptomycin (C0222; Beyotime, China), and maintained at 37℃ in a 5% CO₂ atmosphere.
Cell Transfection
si-FASN (RiboBio, China) and negative control (si-NC) (RiboBio, China) were transfected into T24 cells using Lipofectamine RNAiMAX transfection reagent (13778100; Thermo Fisher, USA) for 24 hr.
Western Blot
Proteins were extracted by lysing cells with radio-immunoprecipitation assay (RIPA) buffer (P0013B; Beyotime). Protein concentration was measured using a bicinchoninic acid (BCA) protein assay kit (P0009; Beyotime). Proteins from each group were separated by sodium dodecyl sulfate–polyacrylamide gel electrophoresis (SDS-PAGE) and subsequently transferred onto polyvinylidene difluoride (PVDF) membranes. The membranes were blocked with 5% skim milk at room temperature for 2 hr, followed by incubation with primary antibodies against FASN (1:1000, Rabbit, ab128870, Abcam, USA), N-GSDMD (1:1000, Rabbit, ab215203, Abcam), p-MLKL (1:1000, Rabbit, 91689, CST, USA), MLKL (1:1000, Rabbit, 14993, CST), and GAPDH (1:8000, Mouse, 60004-1, Proteintech, USA) at 4℃ overnight. After washing three times with TBST, the membranes were incubated with corresponding secondary antibodies (Goat Anti-Rabbit HRP [1:8000, 111-035-003; Jackson, USA] and Goat Anti-Mouse HRP [1:8000, 115-035-003, Jackson]) at room temperature for 2 hr. Protein bands were visualized using an ECL kit (34577, Thermo Fisher Scientific, USA), and protein expression was recorded and analyzed.
qRT-PCR
Total RNA was isolated from tissues with TRIzol reagent (Invitrogen) and quantified for concentration/purity utilizing a NanoDrop One microv visible spectrophotometer. RNA was reverse transcribed into cDNA using SuperScript II Reverse Transcriptase (Invitrogen). Quantitative reverse transcription polymerase chain reaction (qRT-PCR) was conducted on an ABI 7500 PCR system (Applied Biosystems, USA) with TB Green® Premix Ex Taq™ II (Takara, Japan). Relative mRNA expression, normalized to GAPDH, was calculated via the 2−ΔΔCt method. Primer sequences are detailed in Table 1.
qRT-PCR Primer Sequences.
Statistical Analysis
Statistical analyses were performed using GraphPad Prism 10.0. Comparisons of expression levels between the two groups were analyzed by t-test. P-value notations: ns, p > .05; *, p < .05; **, p < .01; ***, p < .001; ****, p < .0001.
Results
Identification of PANoptosis-Related Molecular Subtypes and Functional Annotation of Key DEGs
To identify differentially expressed PRGs relevant to BC, we first performed differential expression analysis on the training set samples, yielding 5,894 DEGs (Supplemental Table S4). Subsequently, DEGs were intersected with 65 PRGs from previous studies via Venn analysis, resulting in 15 PRGs differentially expressed in the training set: AKT3, BMF, CASP2, CASP6, E2F1, HMGB2, IGF1, TFDP1, TP73, TRAF2, FADD, BAX, CASP5, CHMP4C, and ELANE (Figure 1A and B). The univariate Cox regression analysis was executed to explore how the 65 PRGs affect BC patient prognosis, revealing that 12 genes were noticeably associated with BC survival: CASP10, CASP6, CASP8, DFFB, IGF1, UACA, FASLG, MLKL, CHMP4A, CHMP4C, IRF1, and IRF2 (p < .05) (Figure 1C). To understand the classification value of these genes in BC, clustering analysis was further conducted in the training set. Ultimately, two PRG-expression-defined molecular subtypes emerged: cluster1 and cluster2 (Figure 1D). K-M survival curves showed that the cluster2 subtype had superior survival compared with cluster1 (Figure 1E). The clustering heatmap revealed certain differences in clinical traits (TNM stage, tumor stage, gender) between the two subtypes, while most genes exhibited higher expression in the cluster2 subtype (Figure 1F).

Identification of PANoptosis-Related Molecular Subtypes and Functional Annotation of Key DEGs.
The DEGs between the two subtypes were intersected with the DEGs obtained from comparison between the tumor and normal tissue in the training set, yielding a set of 894 key genes that were both closely related to PANoptosis subtyping and obviously abnormally expressed in BC tissue (Figure 1G). GO enrichment analysis demonstrated that these genes were primarily engaged in cytokine-mediated signaling pathways, immune regulation (including responses to leukocytes, viruses, and symbionts), regulation of chemotaxis and phagocytosis, as well as structural components related to lipoproteins, collagen, and synaptic membranes, and molecular functions such as receptor binding, chemokine activity, and glycosaminoglycan binding (Figure 1H). KEGG enrichment analysis suggested that these genes were mainly enriched in immune-related pathways (e.g., IL-17, TNF, and chemokine signaling pathways) and cytokine–cytokine receptor interactions, involving mechanisms of immune response activation and regulation (Figure 1I).
WGCNA Screening of Key Module and Construction of BC Prognostic Risk Score Model Based on Feature Genes
WGCNA was constructed using the previously identified 894 genes to identify functional modules significantly associated with BC phenotypes. In the WGCNA analysis, the soft-thresholding power was set to 4 after systematically evaluating the scale-free topology fit index (R2) and mean connectivity across different soft thresholds (ranging from 1 to 20). This parameter ensured that the network met the scale-free topology criterion (R2 > .85) while maintaining high interconnectivity among genes (Figure 2A), effectively balancing network properties and biological relevance. Using a dynamic tree-cutting algorithm, seven distinct gene co-expression modules were identified (Figure 2B). Correlation analysis between modules and clinical phenotypes (tumor vs. normal) revealed that the yellow module exhibited a significant negative correlation with tumor tissues (correlation coefficient R = −.56, p < .05) (Figure 2C) and was therefore selected as the key module for subsequent analysis.

WGCNA Screening of Key Modules.
Univariate Cox regression analysis was implemented within the yellow module to screen for those appreciably related to BC patient prognosis. Thirty-five prognosis-related genes (p < .05) were identified, and their confidence intervals and hazard ratios (HR) were displayed in a forest plot (Figure 3A). To investigate the mutational features of these key genes in BC, we generated a waterfall plot depicting the mutational landscape. The analysis revealed that missense mutations were the most common mutation type. ERBB3 and SACS were among the genes with the highest mutation frequencies (Figure 3B). Subsequently, to construct a stable and effective prognostic risk score model, LASSO Cox regression analysis was applied to these 35 genes. After selecting the optimal λ value (λ = 9) via cross-validation, nine key feature genes (MYC, MT1A, KCNJ15, SCUBE3, FASN, EPHA7, EFEMP1, ADAMTS12, GARNL3) were ultimately screened out and used to build the risk score model (Figure 3C). Preliminary evaluation by ROC curves indicated that the prognostic model had a good manifestation in predictive accuracy, with AUC values at 1-/3-/5-year time points ranging between 0.598 and 0.743 (Figure 3D and E).

Prognostic Model Construction Based on Key Module Genes and Mutation Analysis.
The model formula is as follows:

To deeply assess the robustness and predictive efficacy of the constructed prognostic model, validation analyses were conducted in the two sets. First, samples were divided into high-/low-risk groups by the median risk score derived from the model as the cutoff. A risk score distribution scatter plot was generated (Figure 4A). The same risk score model was applied to the single-cell dataset GSM4307111. Cells were split into high- and low-risk groups based on the median risk value, further supporting the model’s applicability at the single-cell level (Figure 4B). Survival analysis in the two sets showed that individuals with higher risk scores had a worse prognosis (p < .05) (Figure 4C and D). Both univariate and multivariate Cox regression analyses indicated that tumor clinical stage (Stage) and the risk score (Riskscore) could serve as independent prognostic factors for BC patients (p < .05) (Figure 4E and F), further validating the model’s potential application value in clinical prognosis assessment.

Multi-Cohort Validation of the Risk Score Model and Evaluation of Its Independent Prognostic Value.
Analysis of Mutational Spectra, Immune Microenvironment Features, and Prognostic Significance of TIS Scores Across Risk Groups
To investigate molecular and immune characteristic differences between risk groups, a systematic analysis of mutation and immune landscapes in the two risk groups was performed. The two groups were generally similar in terms of major mutated genes, mutation types, and frequency distribution. However, the high-risk group exhibited a modestly elevated overall mutation frequency. Notably, key driver genes like TP53 had appreciably higher mutation rates in the high-risk group, with a particularly marked increase in frameshift deletion mutations (Figure 5A and B). Immune feature analysis revealed that the high-risk group displayed higher levels of immune cell infiltration and function enrichment, specifically manifested as remarkably increased infiltration of Treg cells and M2 macrophages compared with the low-risk group (p < .05) (Figure 5C and D). Taken together, the high-risk group may possess a more active but probably immunosuppressive immune microenvironment state.

Analysis of Risk Score-Related Mutational Spectra and Immune Infiltration Characteristics.
To assess survival differences under various immune cell activation or suppression states and their sensitivity to immunotherapy, weighted linear mean scores for each cell type were calculated according to TIS gene expression. Samples were divided into high-/low-expression groups based on the median TIS score, and survival curves were plotted. Results showed that for the following cell type/functional states, the high TIS expression group had markedly poorer overall survival: resting mast cells, M0/M1/M2 macrophages, memory B cells, and resting CD4 memory T cells. Elevated TIS expression correlated with reduced survival probability in contexts of antigen-presenting cell (APC) co-activation and type II interferon (IFN-γ) response (p < .05). Conversely, for other cell types or functional states, the low TIS expression group had remarkably poorer overall survival: plasma cells, naive B cells, activated CD4 memory T cells, CD8+ T cells, T follicular helper cells, Tregs, dendritic cells, APC co-inhibition/checkpoint, pro-inflammatory, HLA, cytolytic activity, MHC class I, NK cells, T-cell co-inhibition/co-stimulation, T helper cells, Tfh, TH1 and TH2 cells, TIL (Figure 6A and B).

Prognostic Association Analysis of TIS Scores Under Immune Cell and Functional States.
Comprehensive Association Analysis of Model Risk Score with Clinical Features, Immune Subtypes, and Immune Escape Capability
To deeply explore the correlation between the constructed model and BC clinical characteristics, we assessed clinical feature stratification (T/N/M/Stage) between risk groups, visualizing differential representation via heatmap. Compared with the low-risk group, the high-risk group contained more patients with regional lymph node or distant metastasis (N2–N3, M1), larger primary tumors and deeper infiltration (T3–T4), and overall disease stages tending toward advanced (Stage III-IV; Figure 7A). To verify the relevance of the model risk score with other known immune-related prognostic signatures, we introduced a previously reported IRGPI (Tian et al., 2020). This index, based on six immune-related genes (CTSE, CXCL10, FAM3B, MMP9, OLR1, and S100P), has been confirmed to significantly correlate with BC patient prognosis, T, and N stages. We calculated the IRGPI value for each training set sample based on the expression of these genes and divided them into IRGPI-high and IRGPI-low groups according to the median IRGPI value. Analysis of clinical feature distribution revealed that IRGPI-low group patients were enriched in mid-stage (Stage II-III) and C1 (Wound Healing) immune subtype, while IRGPI-high group patients were primarily distributed in mid-to-late stage (Stage III-IV) and C2 (IFN-γ Dominant) immune subtype (Figure 7B and C). The result aligns with the earlier finding that the high-risk group corresponds to poorer clinical outcomes and a more active immune microenvironment. In addition, in the training set, ROC curves for the model risk, TIDE, and TIS scores were plotted. Only the risk score demonstrated promising predictive performance, with an AUC value > 0.7 (Figure 7D). Compared with the low-risk group, the high-risk group exhibited higher TIDE scores, indicating stronger immune escape capability, along with significantly elevated immune dysfunction and exclusion scores (p < .05) (Figure 7E and F).

Association Analysis of Model Score With BC Clinical Stage, IRGPI Index, and Immune Escape Characteristics.
Quality Control, Cell Subpopulation Identification, and Analysis of Key Gene Expression Features in BC Single-Cell Transcriptomic Data
Prior to analyzing the BC single-cell dataset (GSM4307111), rigorous quality control was performed. Violin plots of nFeature_RNA, nCount_RNA, and mitochondrial gene percentage (percent.mt) revealed that most cells had concentrated distributions of detected genes and UMI counts. However, a small number of low-quality cells were present, characterized by too few detected genes or high mitochondrial gene expression, suggesting apoptosis or rupture. Thus, these were filtered out in subsequent analysis (Figure 8A). Feature scatter plots were generated to visualize correlations between key metrics. Results showed no remarkable correlation between nCount_RNA and percent.mt, indicating mitochondrial gene expression was not influenced by sequencing depth. A significant positive correlation existed between nCount_RNA and nFeature_RNA, suggesting good consistency between expression level and detected gene count for most cells, indicating overall high data quality (Figure 8B). Based on PCA dimensionality reduction results, t-SNE was implemented for cell clustering analysis, ultimately identifying 14 distinct cell clusters (Figure 8C). By combining differentially expressed marker genes in each cluster and referring to public databases for annotation, nine major cell types were successfully identified: T cells, epithelial cells, monocyte, endothelial cells, fibroblasts, tissue stem cells, smooth muscle cells, B cell, and common myeloid progenitor (Figure 8D and E).

Quality Control and Cell Subpopulation Annotation for BC Single-Cell Transcriptomic Data.
Furthermore, the expression patterns of the model genes across cell clusters were visualized at the single-cell level. Results indicated that eight model genes showed significantly differential expression across cell types. MYC, MT1A, EFEMP1, and GARNL3 were predominantly highly expressed in endothelial cells. KCNJ15 and FASN were markedly enriched in epithelial cells, while SCUBE3 and ADAMTS12 were specifically expressed in fibroblasts (Figure 9A and B). These results suggest that the model genes exhibit distinct cell type specificity and may play diverse biological roles within the BC microenvironment.
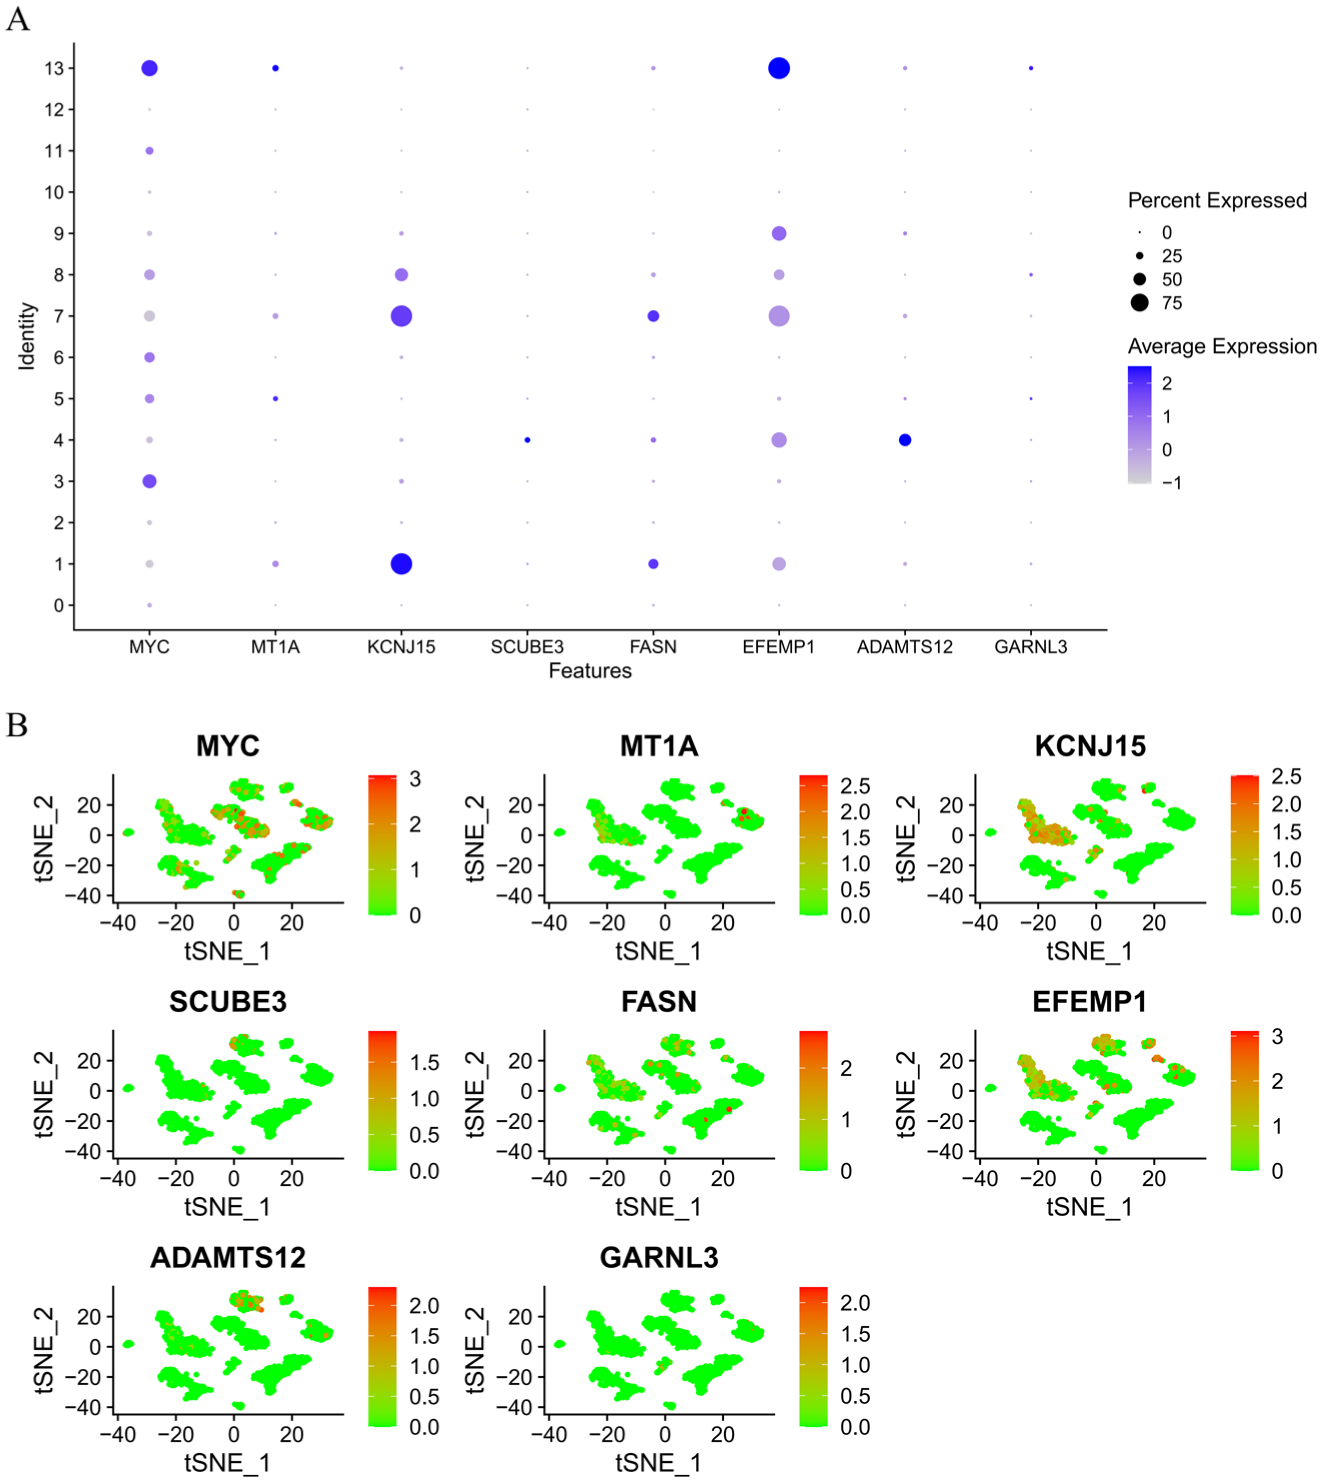
Cell Type–Specific Expression Features of Model Genes at the Single-Cell Level.
Expression and Functional Validation of Model Genes
To verify the differential expression of the nine key risk score model genes in BC, we measured the mRNA expression levels of MYC, MT1A, KCNJ15, SCUBE3, FASN, EPHA7, EFEMP1, ADAMTS12, and GARNL3 in five paired BC tumor tissues and their adjacent normal tissues. In qRT-PCR, compared with the NC group, the expression levels of KCNJ15, FASN, and ADAMTS12 were appreciably upregulated in the BC group, while MYC, MT1A, SCUBE3, EPHA7, EFEMP1, and GARNL3 expression levels showed a downward trend (p < .05) (Figure 10A). These results suggest that RUNX1, NONO, and TSC2 may play oncogenic functions in the initiation and progression of BC. To further investigate the critical role of FASN in pyroptosis, we established a FASN-knockdown T24 cell model. Western blot (WB) analysis revealed that compared with the si-NC group, the protein expression levels of GSDMD-N and p-MLKL in si-FASN T24 cells were significantly upregulated (Figure 10B). This finding was consistent with the observed increase in tumor cell death, suggesting that FASN may promote tumor progression by suppressing the pyroptosis pathway.

Expression and Functional Validation of Model Genes.
Discussion
BC is a highly heterogeneous genitourinary malignancy with complex pathogenesis and limited prognostic prediction tools (Ascione et al., 2023; Kamat et al., 2016; Pilchowski et al., 2011). PANoptosis has emerged as a significant PCD pathway that integrates characteristic features of pyroptosis, necroptosis, and apoptosis. Growing evidence indicates its crucial involvement in reshaping the TIME, mediating drug resistance, and facilitating immune evasion across multiple cancer types, highlighting its potential as a therapeutic target in oncology (Lin et al., 2022; Ocansey et al., 2024). In the present study, we systematically analyzed the expression profiles, subtyping characteristics, and potential application value of PRGs in constructing prognostic risk models for BC for the first time.
Through integrating differential expression analysis with 65 core PANoptosis genes reported, we identified 15 key genes differentially expressed in BC, such as CASP2, BAX, FADD, and AKT3. These genes are known to occupy central positions in cell death regulatory pathways. For instance, FADD, as an adaptor protein in apoptotic signal transduction, mediates the Fas/FasL signaling pathway to initiate the caspase cascade (Davidovich et al., 2023; Gitlin et al., 2020), while BAX plays a crucial role in promoting mitochondrial membrane permeability and triggering apoptosis (Renault et al., 2013).
Based on the 65 PRGs, we further identified two molecular subtypes (cluster1/cluster2) via consensus clustering and found that the cluster2 subtype had a better prognosis. The finding suggests that PANoptosis-related molecular features have molecular subtyping potential, possibly reflecting differences in tumor cell dependence on the PANoptosis pathway. GO and KEGG enrichment results further revealed that the tumor-associated DEGs between the two PANoptosis subtypes were closely related to immune-related pathways (e.g., IL-17, TNF, chemokine signaling). These findings suggest that DEGs may be associated with PANoptosis while simultaneously influencing disease progression through modulation of the immune microenvironment, aligning with established research (Dawoodi et al., 2024; K. Li, Wei, et al., 2024; Wan et al., 2025; Zhou et al., 2024).
By WGCNA, we identified the yellow module, which was markedly negatively correlated with tumor tissue. Based on this, nine key genes (MYC, MT1A, KCNJ15, SCUBE3, FASN, EPHA7, EFEMP1, ADAMTS12, and GARNL3) were screened out to construct a nine-gene prognostic model. To further validate the expression characteristics of these genes, qRT-PCR was performed on the nine genes. The expression levels of FASN, KCNJ15, and ADAMTS12 were significantly upregulated, whereas MYC, MT1A, SCUBE3, EPHA7, EFEMP1, and GARNL3 showed a downregulation trend, largely consistent with bioinformatic analysis and supporting their potential roles in BC pathogenesis. Previous studies have shown that multiple genes in the model play important roles in tumor metabolic reprogramming, immune microenvironment regulation, and malignant biological behaviors. For example, FASN, a key enzyme in metabolic reprogramming, promotes BC cell proliferation and metastasis by activating the Wnt/β-catenin signaling pathway through its overexpression (R. Peng, Ma, et al., 2024). KCNJ15, identified as a key gene associated with the TIME and necroptosis (Nie et al., 2022; Yao et al., 2022), has been confirmed to be significantly related to favorable survival prognosis and may influence immune cell infiltration levels and chemosensitivity. In addition, KCNJ15 has been demonstrated to participate in lipid metabolic reprogramming in BC, regulating tumor cell biology (Sun et al., 2022). ADAMTS12 is considered an oncogenic factor in various tumors. FAK/PI3K/AKT pathway activation through overexpression of ADAMTS12 promotes BC cell proliferation, migration, and invasion and suppresses apoptosis (Xiao et al., 2025).
We further explored the model–TIME association. CIBERSORT analysis results showed that high-risk group patients had remarkably increased infiltration of Tregs and M2 macrophages, suggesting the presence of an immunosuppressive microenvironment, which may lead to the poor prognosis in high-risk patients (Jozwicki et al., 2016; D. Qi et al., 2024). In addition, we combined multiple immune indicators (TIS, TIDE, IRGPI) to predict the immunotherapy response and prognosis of BC patients with different characteristics. When exploring the impact of immune functional states on survival utilizing the TIS score, we found that high TIS expression lacked a consistent association with improved prognosis in survival assessment. Conversely, in various immune cell states (e.g., resting mast cells, M2 macrophages, resting CD4 memory T cells) and functional pathways (e.g., APC co-stimulation, IFN-γ response), high TIS expression correlated with markedly worse survival. Furthermore, low TIS expression within CD8+ T cells was linked with significantly poorer overall survival. This phenomenon may reflect a state of active immune phenotype with functional suppression. Although there is abundant immune cell infiltration within the tumor microenvironment, most cells are in a state of immune tolerance or suppression, failing to effectively exert anti-tumor effects. This observation corresponds with the previously established “immune-excluded” tumor immunophenotype, indicating that elevated TIS scores, as a comprehensive immune activity metric, require concurrent assessment of functional status for accurate interpretation (Wu et al., 2024). Analysis of IRGPI, immune subtypes, and clinical feature distribution revealed that the IRGPI-high group was mainly enriched in mid-to-late stage patients (Stage III-IV) and the C2 subtype (IFN-γ Dominant). Previous research suggests that the C2 (IFN-γ Dominant) represents an immune state of “inflammation active but functionally exhausted,” characterized by high immune cell infiltration and IFN-γ signaling activation but lower survival rates, indicating a potent pro-tumor immune response and poorer prognosis (Thorsson et al., 2018). The concentration of IRGPI-high patients within the C2 immune subtype indicated that while demonstrating partial immune activation, these individuals simultaneously developed substantial immunosuppressive and escape mechanisms, ultimately compromising anti-tumor immune efficacy. The pattern corresponds with both the predominant distribution of IRGPI-high patients in advanced tumors and the clinical outcomes observed in our model’s high-risk cohort, thereby validating IRGPI as an independent immune-related prognostic indicator and corroborating our model’s utility in tumor progression stratification. In addition, elevated TIDE scores in the high-risk group reflected enhanced immune escape potential, attributable to more pronounced immune dysfunction and exclusion mechanisms. These findings collectively demonstrate that high-risk patients maintain an immunosuppressive microenvironment.
In conclusion, we established a nine-gene risk model for BC through systematic analysis of PRG expression patterns and prognostic utility in this study. This model can effectively predict patient survival outcomes and reflect features of the immune microenvironment, providing a potential tool for BC prognosis assessment and precision therapy. However, this study has several limitations. First, the prognostic model constructed from public datasets demonstrated limited predictive performance in the independent validation cohort (AUC < 0.7), and its clinical applicability requires further optimization. Second, although preliminary validation of the model genes was performed via qRT-PCR using clinical samples, the relatively small sample size and lack of external large-scale clinical cohort validation necessitate additional independent cohorts to enhance the model’s generalizability and robustness. Given the technical limitations of the CIBERSORT algorithm in quantifying specific immune cell subsets, future studies should employ more precise immune cell detection methods and larger homogeneous cohorts to validate the immune infiltration results. Although cellular experiments confirmed that FASN knockdown regulates key PANoptosis proteins such as N-GSDMD and p-MLKL, its comprehensive regulatory mechanism in animal models requires systematic validation. Finally, the specific roles of these genes in immunotherapy response remain unclear and warrant further investigation through multi-omics data and functional experiments to elucidate their regulatory functions within the TIME.
Supplemental Material
sj-xlsx-1-jmh-10.1177_15579883251404985 – Supplemental material for Exploration of the Prognostic Value of PANoptosis-Related Genes in Bladder Cancer
Supplemental material, sj-xlsx-1-jmh-10.1177_15579883251404985 for Exploration of the Prognostic Value of PANoptosis-Related Genes in Bladder Cancer by Jichao Tan, Yanjue Wang, Jian Huang, Bo Dong, Tao Liu, Yang Shi, Yuncheng Wu and Lihe Wang in American Journal of Men's Health
Supplemental Material
sj-xlsx-2-jmh-10.1177_15579883251404985 – Supplemental material for Exploration of the Prognostic Value of PANoptosis-Related Genes in Bladder Cancer
Supplemental material, sj-xlsx-2-jmh-10.1177_15579883251404985 for Exploration of the Prognostic Value of PANoptosis-Related Genes in Bladder Cancer by Jichao Tan, Yanjue Wang, Jian Huang, Bo Dong, Tao Liu, Yang Shi, Yuncheng Wu and Lihe Wang in American Journal of Men's Health
Supplemental Material
sj-xlsx-3-jmh-10.1177_15579883251404985 – Supplemental material for Exploration of the Prognostic Value of PANoptosis-Related Genes in Bladder Cancer
Supplemental material, sj-xlsx-3-jmh-10.1177_15579883251404985 for Exploration of the Prognostic Value of PANoptosis-Related Genes in Bladder Cancer by Jichao Tan, Yanjue Wang, Jian Huang, Bo Dong, Tao Liu, Yang Shi, Yuncheng Wu and Lihe Wang in American Journal of Men's Health
Supplemental Material
sj-xlsx-4-jmh-10.1177_15579883251404985 – Supplemental material for Exploration of the Prognostic Value of PANoptosis-Related Genes in Bladder Cancer
Supplemental material, sj-xlsx-4-jmh-10.1177_15579883251404985 for Exploration of the Prognostic Value of PANoptosis-Related Genes in Bladder Cancer by Jichao Tan, Yanjue Wang, Jian Huang, Bo Dong, Tao Liu, Yang Shi, Yuncheng Wu and Lihe Wang in American Journal of Men's Health
Footnotes
Ethical Considerations
The use of tissue samples was approved by the Ethics Committee of The Second Affiliated Hospital of Qiqihar Medical University [No. (2024)01-18].
Informed Consent
All subjects offered written informed consent.
Author Contributions
Jichao Tan contributed to the study design. Yanjue Wang and Jian Huang conducted the literature search. Jichao Tan, Yanjue Wang, Bo Dong, and Tao Liu acquired the data. Jichao Tan, Yang Shi, and Yuncheng Wu performed data analysis and drafted. Lihe Wang, Yanjue Wang, and Jian Huang revised the article. Lihe Wang gave the final approval of the version to be submitted.
Funding
The authors disclosed receipt of the following financial support for the research, authorship, and/or publication of this article: This work was supported by The Qiqihar City Joint Guidance Project for Science and Technology Planning (No. LSFGG-2024050).
Declaration of Conflicting Interests
The authors declared no potential conflicts of interest with respect to the research, authorship, and/or publication of this article.
Data Availability Statement
The data and materials in the current study are available from the corresponding author on reasonable request.
Supplemental Material
Supplemental material for this article is available online.
References
Supplementary Material
Please find the following supplemental material available below.
For Open Access articles published under a Creative Commons License, all supplemental material carries the same license as the article it is associated with.
For non-Open Access articles published, all supplemental material carries a non-exclusive license, and permission requests for re-use of supplemental material or any part of supplemental material shall be sent directly to the copyright owner as specified in the copyright notice associated with the article.