
Abstract
Background
Hepatocellular carcinoma (HCC) is a highly malignant tumor with a particularly poor prognosis. The tumor microenvironment (TME) is closely associated with tumorigenesis, progression, and treatment. However, the relationship between TME genes and HCC patient prognosis is poorly understood.
Methods
In this study, we identified two prognostic subtypes based on the TME using data from The Cancer Genome Atlas and Gene Expression Omnibus. The Microenvironment Cell Populations-counter method was used to evaluate immune cell infiltration in HCC. Differentially expressed genes between molecular subtypes were calculated with the Limma package, and clusterProfiler was used for Gene Ontology and Kyoto Encyclopedia of Genes and Genomes functional enrichment analyses to identify genes related to the independent subtypes. We also integrated mRNA expression data into our bioinformatics analysis.
Results
We identified 4227 TME-associated genes and 640 genes related to the prognosis of HCC. We defined two major subtypes (Clusters 1 and 2) based on the analysis of TME-associated gene expression. Cluster 1 was characterized by increased expression of immune-associated genes and a worse prognosis than Cluster 2.
Conclusions
The identification of these HCC subtypes based on the TME provides further insight into the molecular mechanisms and prediction of HCC prognosis.
Keywords
Introduction
Hepatocellular carcinoma (HCC) is the fifth most common malignant tumor worldwide and the third leading cause of cancer-related death. 1 The burden of HCC is expected to increase continuously over the next few years.2,3 HCC mainly occurs in the background of liver cirrhosis, which is closely related to chronic infections by hepatitis B virus or hepatitis C virus and alcohol-associated, nonalcoholic fatty, or drug-associated disease.3–6 As a result, HCC remains one of the most difficult malignancies to treat. Although several studies have demonstrated the effectiveness of systemic and immune therapies in HCC, specifically for patients who have not received sanative resection or liver transplantation,7,8 the success of these therapies is limited by low response rates. Therefore, treatment strategies for liver cancer need to be further improved.
The tumor microenvironment (TME) is an essential part of cancer, and it is a complex ecosystem that supports tumor growth and metastasis while weakening immune surveillance.9–11 The TME is composed of a variety of immune and non-immune cell types, which secrete cytokines that synergistically promote chronic inflammation, immunosuppression, and angiogenesis. 12 Cancer cells can adapt and grow in this environment, and it becomes difficult to monitor and eradicate them by host immunosurveillance. Recently, increasing evidence has demonstrated that cancer cells closely interact with stromal cells and the extracellular matrix. 13 Dendritic cells (DCs) have a dual function in the TME, and DC dysfunction weakens immune surveillance and prevents the elimination of tumor cells. 14 This leads to the functional impairment of natural killer cells that have infiltrated solid tumors. 15 It was previously demonstrated that the tumor-immune microenvironment of advanced ovarian cancer is intrinsically heterogeneous, and local immune activation could be induced by chemotherapy. 16 Therefore, researching the role of the TME in the pathogenesis of tumors and the potential mechanisms underlying the interactions of the TME with tumor cells is essential.
Several studies revealed that the TME plays an essential role in oncogenesis, tumor metastasis, and liver fibrosis.17,18 Hepatic stellate cells stimulate liver cancer growth and may reduce the extent of central necrosis by activating extracellular regulatory kinase and nuclear factor-ĸB pathways.19,20 Other types of cells in the TME of HCC, such as cancer-associated fibroblasts, lymphocytes, Kupffer cells, and endothelial cells, are considerably important and require in-depth study. At present, systematic studies on the relationship between TME-related genes and the prognosis of HCC patients are limited. Therefore, researching the landscape of HCC based on the TME to recharacterize its molecular subtypes and predict which subtypes have a poor prognosis is of great importance.
In this study, we identified two independent prognostic subtypes based on the TME using data from The Cancer Genome Atlas (TCGA) and Gene Expression Omnibus (GEO). The molecular characteristics of the TME were used as prognostic indicators of clinical outcomes. Cluster 1 was characterized by increased expression of immune-associated genes and a worse prognosis than Cluster 2. The identification of these HCC subtypes base on the TME enables the prediction of HCC prognosis and is a cornerstone for immunotherapy.
Materials and methods
Tumor samples and gene expression datasets
TCGA (https://gdc-portal.nci.nih.gov/) and GEO (https://www.ncbi.nlm.nih.gov/geo/) datasets have been reported previously. 21 GEO is a widely available repository of multi-dimensional clinical datasets and cancer genomics information, including the clinical characteristics, gene expression profiles, and patient prognosis of 445 HCC samples (GSE14520). The datasets for 423 HCC samples from the TCGA-Liver Hepatocellular Carcinoma (LIHC) collection were used for further validation. Genes were removed if they had missing data.
Cancer-specific survival was defined as the period from the date of surgery to the date of cancer-associated death. Progression-free survival was identified as the period between the therapeutic intervention and tumor progression. Disease progression was defined as an increase in stages from T1 or T2 to T3 or T4. Ethical approval was not required as this study used publicly available datasets and was an analytical study of bioinformatics.
Unsupervised clustering analysis for subtype discovery
According to an unsupervised learning approach, the non-negative matrix factorization (NMF) clustering algorithm was used to discover subtypes. Then, we used the K-medoids clustering algorithm. Our optimal number of clusters (k = 2–10) was set in accordance with previously described protocols. 22 The optimal number of gene clusters was determined by indicators, such as the cophenetic coefficient, residual sum of squares, and dispersion. The cophenetic coefficient is obtained based on the consistency matrix and is used for the stability of the cluster obtained from NMF. The residual sum of squares is used to reflect the clustering performance of the model. The smaller the value, the better the clustering effect of the model. In theory, when each sample is clustered into a class, the value is the smallest, but the residual sum of squares cannot be applied alone. Therefore, this parameter needs to be used together with other indicators.
Microenvironment Cell Populations (MCP)-counter method
The MCP-counter method was used to reliably quantify the absolute abundance of different immune cell subsets and stromal cell populations in heterogeneous tissues using transcriptomic data, 23 as described previously. The MCP-counter tool was used to validate the differences in immune scores of cell populations within each subgroup. 24 We also assessed the significance of the variation in expression levels for all genes among the two subtypes.
Identification of differentially expressed genes (DEGs) between subtypes
Based on the RNA seq dataset, the gene with zero value was identified as the missing value after log2 transformation. If the data were missing in more than 30% of the samples, they were removed. The quantiles were normalized, and the gene expression levels in each data set were independently normalized to a mean of 0 and standard deviation of 1 and then combined to produce a large, pooled sample composed of RNA-seq validation queues. The Limma R package was used to screen DEGs based on the negative binomial distribution model. The expression profile centers the median of all samples and uses a classifier to classify the data set. The molecular characteristics of the genes were analyzed in both a discovery and validation cohort. Then, the well-trained clusters were used to identify the different subgroups according to the heat maps. The significance of DEGs was analyzed.
KEGG and GO analysis
The Kyoto Encyclopedia of Genes and Genomes (KEGG) (https://www.kegg.jp/) is a public database for understanding DEGs in biological systems (such as cells, organisms, and ecosystems) at the molecular level (especially large-scale molecular datasets generated by genome sequencing and other high-throughput experimental techniques). The functions and applications of enrichment analysis were described previously. 25
Gene ontology (GO) is a method for standardizing the description of gene products to simply annotate gene products. GO enrichment analysis describes the biological processes, cell component pathways, and molecular functions.
Statistical analysis
All statistical analyses were performed using IBM SPSS Statistics for Windows, Version 22 (IBM Corp., Armonk, NY, USA) and GraphPad Prism 7.0 (GraphPad Software, La Jolla, CA, USA). The Chi-squared test was used to analyze the relationship between DEGs and clinicopathological characteristics. Student’s t-test was performed to analyze the differences between the two groups. The Kaplan–Meier method was used to establish survival curves, and the survival differences were compared using the log-rank test. All statistical results with p<0.05 were considered significant.
Results
Two subgroups of HCC were identified based on the analysis of TME-associated gene expression
The characteristics of the 365 TCGA-LIHC samples and 221 GSE14520 samples selected for analysis are shown in Table 1. To investigate the relationship between the TME and the malignant progression of HCC, the genomic sequence of HCC subtypes was obtained from TCGA. Log2 transformation and quantile normalization were applied to gene expression analyses. Before clustering, we identified 4227 genes (148 genes had no expression profile) related to the TME. Coxph functions in R were used for survival analysis, resulting in the identification of 640 TME-related genes associated with the prognosis of HCC. Then, unsupervised hierarchical clustering analysis was applied to classify the different HCC subgroups based on the TME molecular expression profile rather than clinicopathological factors, such as tumor stages and grades. Clustering analysis was used to classify the two subgroups.
Characteristics of TCGA-LIHC and GSE14520 cohorts.

TCGA-LIHC, The Cancer Genome Atlas-Liver Hepatocellular Carcinoma; OS, overall survival.
The 640 genes associated with the prognosis of HCC based on the TME were used to determine the optimal number of clusters according to indicators, such as the cophenetic, dispersion, and silhouette values. Analysis of the consensus summary statistics indicated that the optimal number of gene clusters was two (Figure 1a, b). The heat map of TME-related genes associated with prognosis in the two subgroups is shown in Figure 1d. Further, we analyzed the prognostic relationship between the two groups, and the results showed that Cluster 1 and Cluster 2 were significantly different (Figure 1c, d; log-rank p < 0.0001). Specifically, we found that Cluster 2 had a longer median overall survival than Cluster 1. Based on the two subtypes, tumors with higher TME-associated gene expression showed a worse prognosis.

Two subgroups of HCC were identified based on the TME. a. The consensus map of NMF was used for subtype analysis. b. The optimal cluster number was two according to the indicators of the cophenetic coefficient, residual sum of squares, and dispersion. c. Kaplan–Meier analysis showing that the overall survival of subtype C1 is significantly worse than that of C2. d. Heat map of TME-related genes between the two molecular subtypes (C1 and C2).
Estimation and comparison of immune cells
Immune cells that infiltrate solid tumors can have a profound effect on the clinical behavior of cancer. Estimating tumor-infiltrating immune cells and researching the interactions between the host immune system and tumors are essential to identify prognostic biomarkers and develop novel therapies. We estimated the abundance of specific immune cell subsets and found significant differences in various immune cell types (CD8 T cells, cytotoxic T cells, lymphocytes, B cell lineage, monocytic lineage, myeloid DCs, fibroblasts, and neutrophils; all p<0.05) between Cluster 1 and Cluster 2. There was no significant difference in the scores of endothelial cells (Figure 2). These results illustrate that the immune signature of different subgroups might provide a prognostic signature. The low immune cell infiltration associated with Cluster 2 may indicate a less invasive tumor phenotype, whereas the poor prognosis of Cluster 1 is associated with increased immune cell infiltration.

Estimation and comparison of the abundance of specific immune cell subsets.
Identification of DEGs between subtypes
To further demonstrate which genes were related to the two subtypes, we integrated mRNA expression data into our bioinformatics analysis. The Limma package was used to calculate the DEGs between Cluster 1 and Cluster 2 molecular subtypes. The results showed that 152 subtype-specific signature genes were downregulated, and the differentially expressed subtype-specific signature genes between Cluster 1 and Cluster 2 were mainly upregulated. The volcano map of the DEGs between Cluster 1 and Cluster 2 molecular subtypes is shown in Figure 3a, and the heat map of the DEGs between Cluster 1 and Cluster 2 molecular subtypes is shown in Figure 3b.

The differentially expressed genes between C1 and C2. a. The volcano map shows an increased number of differentially expressed genes in C1 compared with C2. b. The differentially expressed genes in C1 and C2 are also shown in a heat map.
Differences in upregulated genes between subtypes
To explore the underlying molecular mechanisms contributing to the differences in gene expression, KEGG and GO functional enrichment analyses of 640 upregulated signature-specific genes were performed. Biological processes, including the regulation of the mitotic cell cycle, cell division, negative regulation of cell cycle, cell cycle phase transition, and DNA repair, were significantly enriched (Figure 4a). Cellular component (microtubule organizing center, nuclear chromosome, nuclear chromosome part, chromosomal region, and spindle) enriched pathways were mainly annotated (Figure 4b). The annotated results for molecular functions were also analyzed (Figure 4c). In addition, the enriched KEGG pathways were mainly focused on cellular senescence, microRNAs in cancer, cell cycle, oocyte meiosis, progesterone-mediated oocyte maturation, and others (Figure 4d).
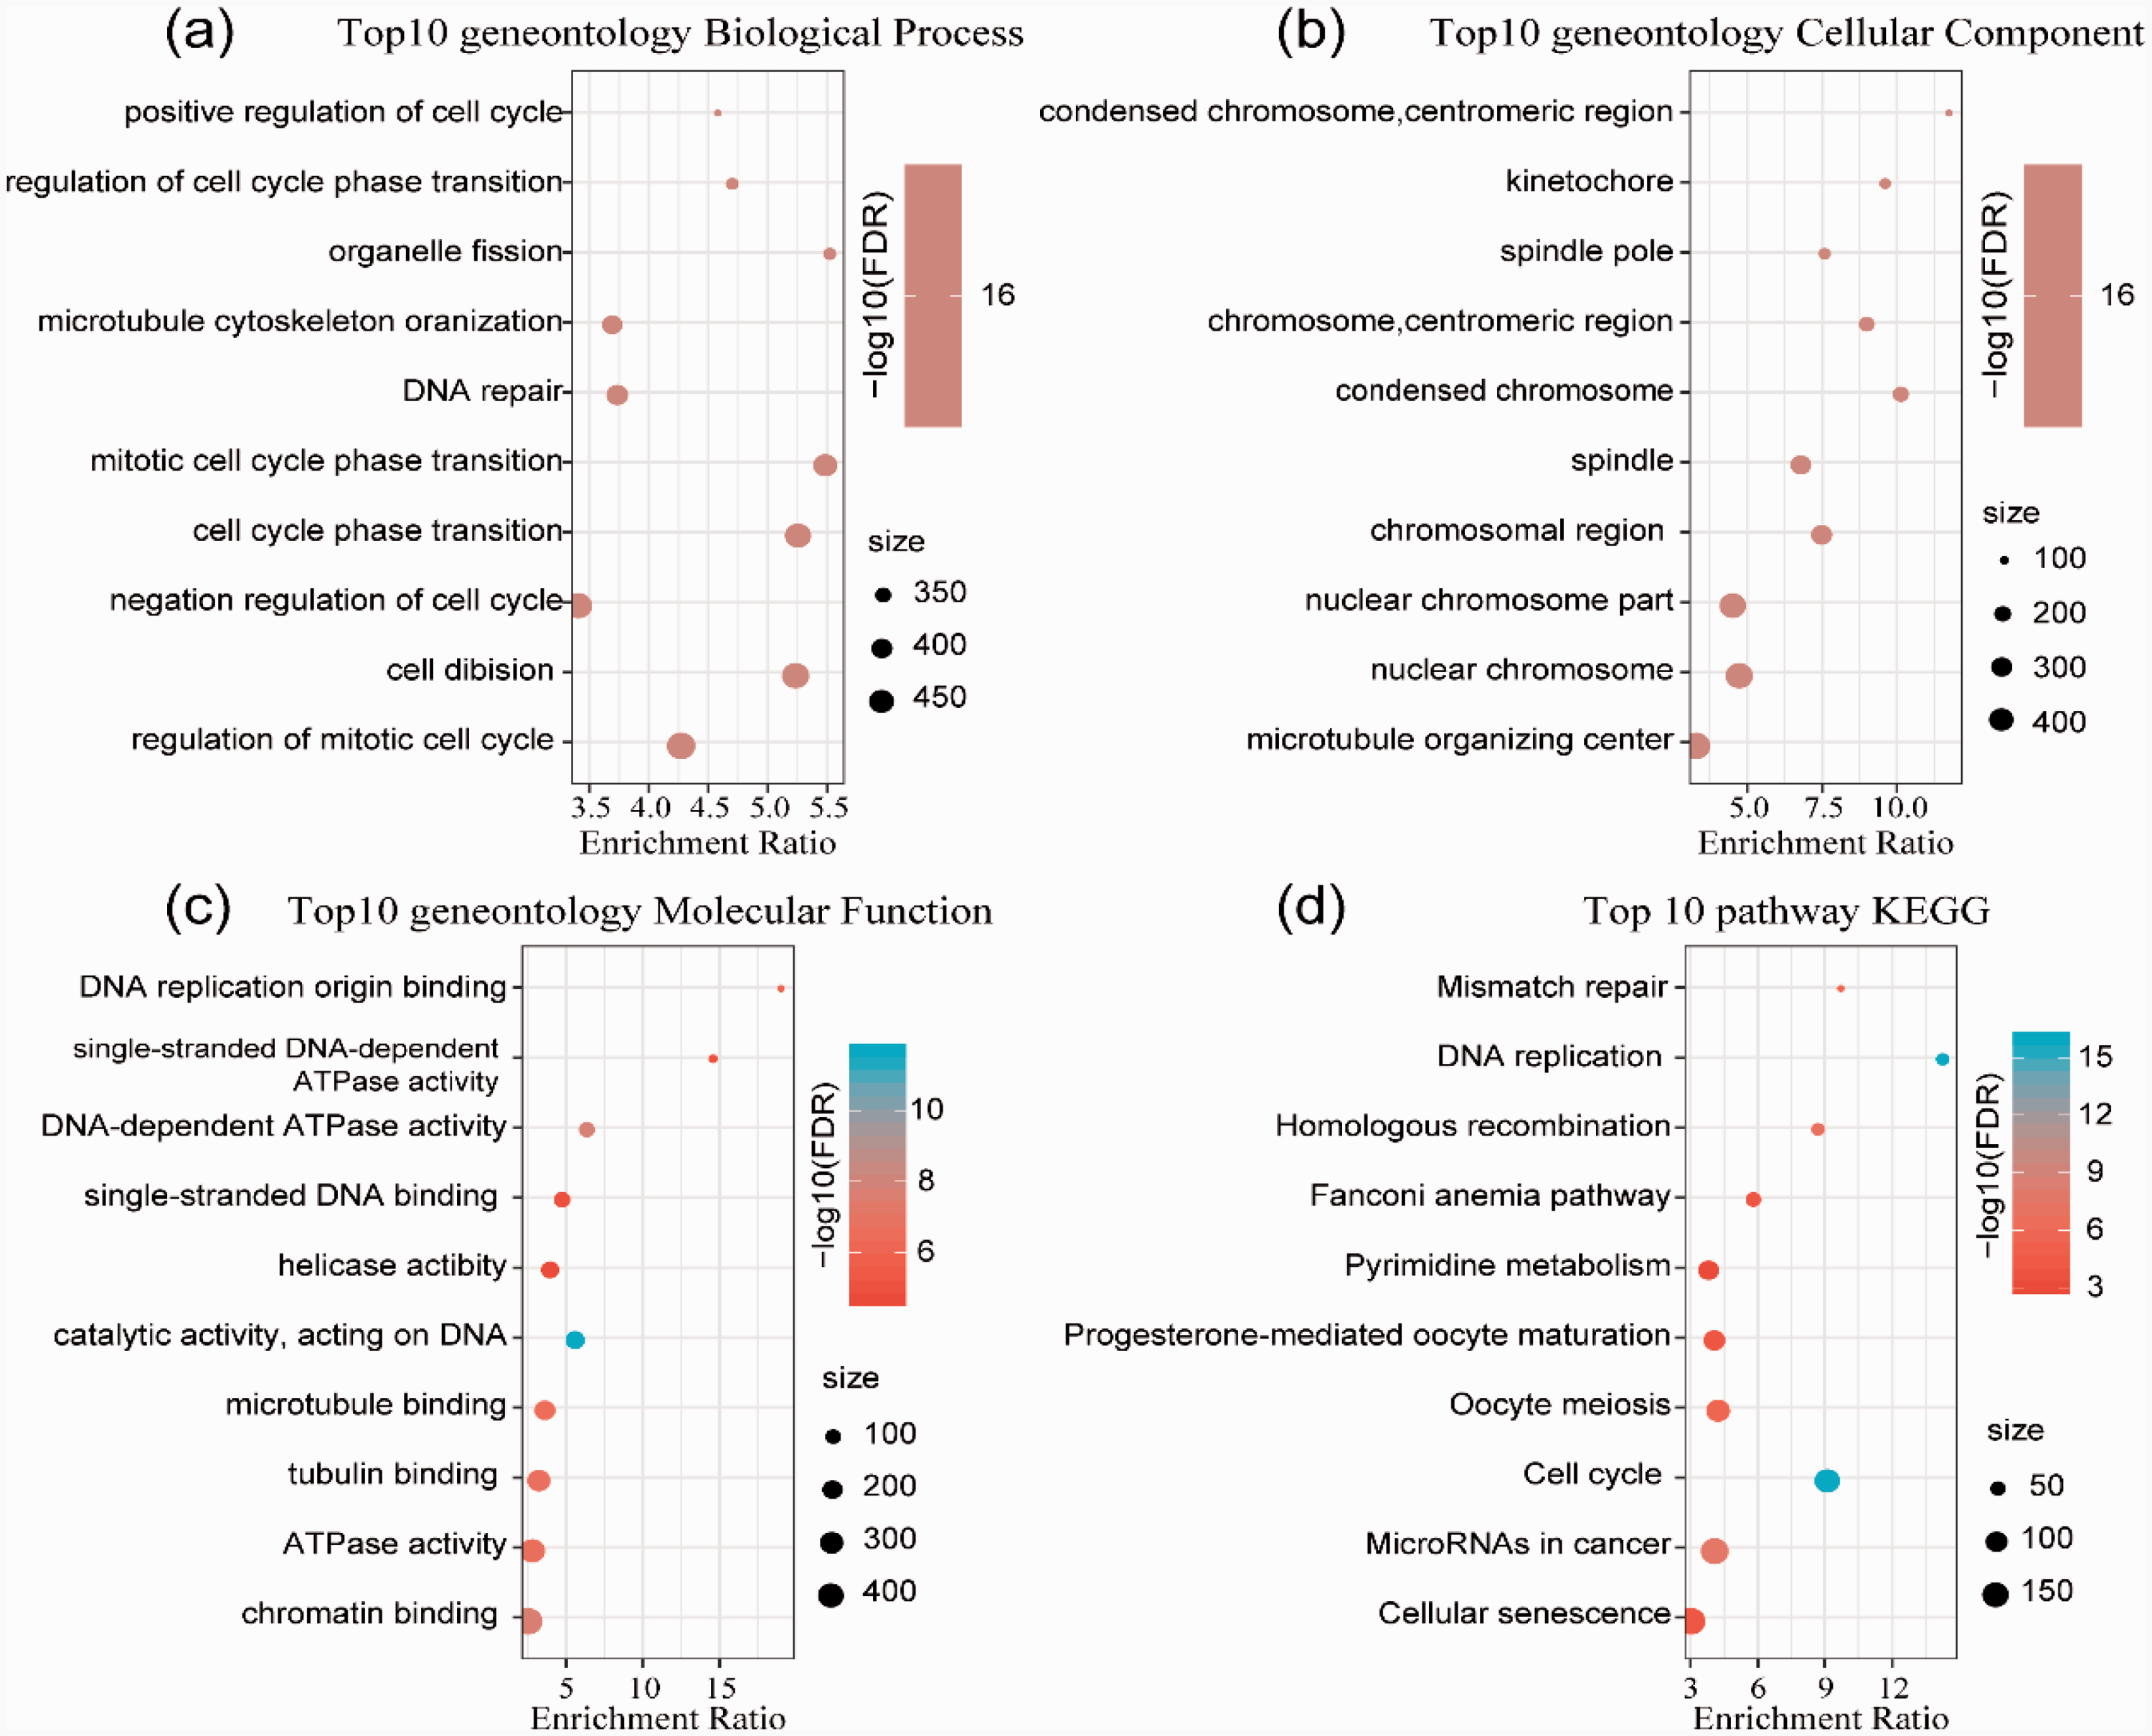
GO and KEGG pathway enrichment analyses of the upregulated genes in HCC subtypes. a. GO analysis of biological processes. b. GO analysis of cellular components. c. GO analysis of molecular functions. d. KEGG analysis.
Pathway enrichment analysis of the functions of downregulated genes between subtypes
Further, the 152 subtype-specific signature downregulated genes were enriched by KEGG and GO function analysis. Genes with significant differences were annotated in biological processes, such as small molecule biosynthetic processes, monocarboxylic acid metabolic processes, organic acid biosynthetic processes, and others (Figure 5a). For the cellular component, the annotation results of the top 10 genes focused on the extracellular matrix, collagen-containing extracellular matrix, blood microparticles, and others. (Figure 5b). Molecular functions, including cofactor binding, carboxylic acid binding, iron ion binding, lipid transporter activity, oxidoreductase activity, acting on paired donors, incorporation or reduction of molecular oxygen, and others, were annotated (Figure 5c). The enrichment of 152 downregulated genes in KEGG pathways revealed that complement and coagulation cascades, biosynthesis of amino acids, bile secretion, PPAR signaling pathway, chemical carcinogenesis, metabolism of xenobiotics by cytochrome P450, drug metabolism, and other pathways were significantly enriched (Figure 5d).

GO and KEGG pathway enrichment analyses of the downregulated genes in HCC subtypes. a. GO analysis of biological processes. b. GO analysis of cellular components. c. GO analysis of molecular functions. d. KEGG analysis.
Discussion
HCC is associated with a high mortality rate. Although systemic and immune therapies have demonstrated efficacy in HCC therapy, only a few patients respond to these treatments. The substantial heterogeneity in HCC suggests that the identification of independent prognostic subtypes is necessary to improve HCC treatments.
In the present study, using the unsupervised learning approach NMF, we investigated a method to divide HCC patients into two main categories based on the TME with distinct molecular characteristics. Several molecular subtypes of HCC have been proposed. In contrast to the subtypes identified in this study, the HCC subclasses reported by Lee et al. 26 were highly associated with patient survival, and the genes most highly correlated with survival were identified using Cox proportional hazards survival analysis but not epigenomic analysis. Llovet et al.27,28 suggested that HCC can be divided into two major groups, including “proliferative and non-proliferative” or “progressive and less progressive”, but the heterogeneity of HCC and the clinical and pathological features are not well understood.
Considering the limitations of previous research, investigations based on the TME have received increasing attention.29,30 Yuting et al. 21 developed a new model based on immune-related genes for predicting prognosis in HCC. Tekpli et al. 31 established a novel six-gene signature in both GEO and TCGA HCC cohorts for HCC prognosis prediction. A similar observation of three patient clusters with increasing levels of immune cell infiltration in breast cancer has been reported. Additionally, Ma et al. 32 established a molecular subtyping method for Asian HCC to evaluate prognosis. Therefore, the importance of conducting a systematic analysis of the molecular subtypes of HCC is evident. In our study, we successfully established two different subtypes. Cluster 1 showed higher immune cell infiltration and a worse prognosis than Cluster 2.
Our study revealed that gene signatures were correlated with immune cell infiltration and the prognosis of HCC. Xu et al. 33 reported a similar conclusion in renal cell carcinoma. Additionally, a promising prognostic signature was developed to evaluate immunotherapy responsiveness based on an immune gene set in ovarian cancer. 34 Various molecular subtypes of immune checkpoint inhibitor-based therapeutic responses were also classified in early-stage bladder cancer patients. 35 Elucidating gene signatures associated with the TME of different subgroups might provide a prognostic signature and contribute to improvements in immunotherapies. 36 Although our research describes a gene signature that can predict the prognosis of different HCC subtypes, the molecule mechanisms by which these biomarkers affect the progression of HCC require further investigation.
In summary, our research redefined an independent poor-prognosis subtype of HCC based on the TME. Importantly, the indentation of different subtypes might help improve treatment strategies for advanced HCC.
Footnotes
Author contributions
JFW and JYL conceived and designed the study. JFW drafted the manuscript. JYL, LF, and QJ reviewed the manuscript and analyzed the datasets. All authors read and approved the final manuscript. JFW and JYL contributed equally to this study.
Declaration of conflicting interest
The authors declare that there is no conflict of interest.
Funding
This research received no specific grant from any funding agency in the public, commercial, or not-for-profit sectors.