
Abstract
Background
Gastric cancer remains a major global health challenge due to its high mortality rate and complex pathophysiological mechanisms. Emerging evidence highlights that dysregulated lipid metabolism contributes to gastric cancer progression and prognosis, but the associations between lipid metabolism-associated genes, gastric cancer patient survival, and tumor immune microenvironment remodeling are not fully elucidated.
Methods
We analyzed publicly available omics and clinical data, including RNA sequencing data from 371 gastric cancer samples in The Cancer Genome Atlas database and 433 gastric cancer samples in the Gene Expression Omnibus database. We first curated the top 100 lipid metabolism-associated genes based on relevance scores. Then, univariate Cox regression was used to identify genes significantly associated with overall survival. Consensus clustering was applied to these survival-related genes to define gastric cancer molecular subtypes. Copy number variation analysis was performed to assess genomic alterations of these genes in tumor samples. A prognostic risk model was constructed using least absolute shrinkage and selection operator regression and validated via multivariate Cox regression. Immune infiltration analysis using CIBERSORT and ESTIMATE algorithms was conducted to explore associations between lipid metabolism-associated genes and tumor immune microenvironment characteristics.
Results
A total of 3911 differentially expressed genes were identified between gastric cancer and adjacent normal tissues. Among the top 100 lipid metabolism-associated genes, 43 were significantly linked to patient survival, most of which were considered as poor prognostic factors. Copy number variation analysis revealed frequent copy number gains of these genes in tumor samples. Consensus clustering stratified patients into two molecular subtypes (LMAGcluster A and LMAGcluster B), with LMAGcluster A showing significantly worse survival outcomes (median survival: 2.6 years vs. 8.3 years in LMAGcluster B, p < 0.001). LMAGcluster A was also characterized by elevated infiltration of pro-tumor immune cells, such as regulatory T cells and follicular helper T cells. The prognostic model based on 14 key lipid metabolism-associated genes exhibited robust predictive performance, with area under the receiver operating characteristic curve values of 0.702–0.761 in The Cancer Genome Atlas cohort and 0.621–0.638 in the Gene Expression Omnibus cohort for 1-, 3-, and 5-year survival.
Conclusion
Lipid metabolism-associated genes are closely associated with gastric cancer prognosis and tumor immune microenvironment remodeling. The identified gene-based molecular subtypes and prognostic model provide novel insights into gastric cancer progression, and the 14 key genes may serve as potential biomarkers and therapeutic targets.
Keywords
Introduction
Gastric cancer (GC), a leading cause of cancer-related deaths worldwide, presents significant treatment challenges. 1 Despite advancements in medical research and treatment strategies, the prognosis for many patients with GC remains poor, largely due to the heterogeneity of the disease and its complex molecular mechanisms. 2
Recent advancements in molecular biology have highlighted the pivotal role of lipid metabolism in the progression and prognosis of various cancers, including GC. 3 Lipid metabolism encompasses a wide array of biochemical processes essential for cell growth, proliferation, and survival. 4 In cancer cells, these processes are often dysregulated, leading to metabolic reprogramming that supports rapid proliferation and resistance to cell death. 5 Lipid metabolism not only supplies energy and building blocks for membrane synthesis but also modulates signaling pathways that promote tumor growth and survival. 6
The influence of lipid metabolism-associated genes (LMAGs) extends beyond metabolic reprogramming to the modulation of the tumor immune microenvironment (TIME). 7 Lipid metabolites can create an immunosuppressive environment that enables cancer cells to evade immune surveillance. 8 For example, elevated levels of certain lipids can inhibit the function of T cells and natural killer (NK) cells while promoting the recruitment and polarization of tumor-associated macrophages (TAMs) toward a pro-tumorigenic phenotype. 9 The infiltration of immune cells, including macrophages, T cells, and dendritic cells, into the tumor microenvironment is regulated by lipid metabolism. 10
In pancreatic cancer, LMAGs such as fatty acid synthase (FASN) and acetyl-CoA carboxylase (ACC) are often overexpressed, driving de novo lipid synthesis. This process provides essential lipids for membrane biosynthesis and energy storage, supporting the high metabolic demands of proliferating cancer cells. 11 Studies have shown that targeting FASN can reduce tumor growth and sensitize cancer cells to chemotherapy. 12 Furthermore, lipid metabolism pathways, including the phosphoinositide 3-kinase (PI3K)–AKT–mechanistic target of rapamycin (mTOR) axis, are frequently activated in pancreatic cancer, contributing to tumor cell survival and resistance to apoptosis. 13 Similarly, genes such as sterol regulatory element-binding protein 1 (SREBP1) are involved in lipid biosynthesis and are upregulated in colorectal cancer (CRC). 14
Although the exploration of LMAGs in GC is still emerging compared with other cancers, several recent studies have contributed to this field. Dai et al. 15 developed a six-LMAG prognostic signature linked to immune infiltration, highlighting the role of ST6GALNAC3 in regulating M2 macrophage polarization and prostaglandin synthesis. Chen et al. 16 identified three lipid metabolism-based molecular subgroups with distinct immune microenvironments and prognostic implications. However, these studies either employed a broader molecular subtyping approach or focused on a limited gene set without extensively elucidating the mechanistic interplay between individual LMAGs and specific immune components of the TIME. Our study extends these findings by establishing a refined LMAG-driven risk model, integrating multi-dimensional clinical and transcriptomic data to prognostically stratify GC patients, and systematically dissecting the influence of key LMAGs on immune cell infiltration—thereby offering a more precise and mechanistic understanding of how lipid metabolic reprogramming modulates the immune landscape in GC.
To address existing gaps, this study developed a risk model incorporating clinical data to stratify patients according to prognosis. Additionally, the TIME was analyzed to explore the relationship between gene expression and immune cell infiltration. This integrative approach aims to identify novel biomarkers and therapeutic targets that could improve personalized treatment strategies for GC.
Methods
Data collection, processing, and acquisition of lipid metabolism gene list
We retrieved RNA sequencing (RNA-seq) data for 371 GC transcriptomes and corresponding clinical data from The Cancer Genome Atlas (TCGA) database (https://portal.gdc.cancer.gov/). Additionally, we obtained data for the GSE84437 dataset from the Gene Expression Omnibus (GEO) database (https://www.ncbi.nlm.nih.gov/geo/). The platform used was GPL570 (HG-U133_Plus_2) Affymetrix Human Genome U133 Plus 2.0 Array, which includes survival and gene expression data for 433 patients. 17 All data were publicly available, and their use complies with the databases’ access policies, requiring no additional ethics committee or institutional review board (IRB) approval. Patient inclusion criteria were as follows: (a) histologically confirmed gastric adenocarcinoma; (b) availability of overall survival data; and (c) availability of complete gene expression profiles. Exclusion criteria were as follows: (a) receipt of neoadjuvant therapy prior to sample collection; (b) presence of other synchronous malignancies; and (c) incomplete clinical information. Detailed clinical characteristics of the patients are summarized in Table S1. To enhance the accuracy of the study, we normalized the expression matrix using the “normalize between arrays” function in the R package ‘limma’ (version 3.54.2), 18 and patients with a survival time of less than 30 days were excluded. Missing values in the clinical data were imputed using the R package ‘mice’ (version 3.15.0). We utilized the GeneCards database (https://www.genecards.org/) to identify genes associated with lipid metabolism. A total of 243 genes were initially retrieved based on relevance scores. To focus on the most biologically meaningful candidates, the top 100 genes with the highest relevance scores were selected for further analysis.
Consensus clustering was performed using the ‘ConsensusClusterPlus’ package (version 1.60.0), employing the k-means clustering algorithm with Euclidean distances and 50 replicates for 80% of the samples. 19 We used 80% of the samples per resampling round to ensure robustness and stability of the clustering results while reducing the risk of overfitting. Principal component analysis (PCA) and visualization were conducted using the R package ‘FactoMineR’ (version 2.7) to demonstrate the distribution between groups. We examined copy number variation (CNV) data from TCGA database to identify significant amplifications or deletions within the cohort. Both amplifications and deletions were considered to enhance the detection of alterations in each gene. High-frequency CNVs were defined as those with a frequency exceeding 5%.
Functional enrichment analysis
Gene Ontology (GO) and Kyoto Encyclopedia of Genes and Genomes (KEGG) enrichment analyses of the differentially expressed genes (DEGs) were performed using the R package ‘clusterProfiler’ (version 4.7.1.3). 20 Terms with a false discovery rate (FDR) <0.05 after Benjamini–Hochberg (BH) correction were considered significantly enriched.
Identification of prognostic LMAGs and prognostic model
To investigate the prognostic significance of LMAGs in GC, univariate Cox regression analysis was performed using R software (version 4.2.0) with the ‘survival’ package. To handle high-dimensional data and prevent overfitting, least absolute shrinkage and selection operator (LASSO) regression was applied. This method is suitable for selecting the most predictive genes and assigning regression coefficients. Genes with nonzero coefficients in the LASSO model were retained. The risk score for each patient was calculated as follows:
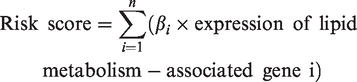
Patients were then categorized into high-risk and low-risk groups based on the median risk value. The prognostic utility of the model was evaluated using survival analysis to compare outcomes between the two groups. Additionally, the model’s accuracy and robustness were assessed by generating receiver operating characteristic (ROC) curves for 3-, 5-, and 8-year survival rates.
Clinical prediction value of the established prognostic model
To avoid bias and further evaluate the prognostic efficacy of the model, univariate and multivariate Cox regression analyses were performed. Risk scores, together with other clinical characteristics, were included in the analysis to identify independent prognostic markers. The BH method was used for multiple testing correction in univariate Cox regression to adjust for the evaluation of multiple clinical variables.
Immune microenvironment analysis and construction of the nomogram
The tumor microenvironment and GC-infiltrating immune cells were assessed in silico. Using bulk RNA-seq data, the ESTIMATE algorithm was employed to predict the presence of infiltrating stromal and immune cells in the tumor microenvironment. ESTIMATE provided three scores based on single-sample Gene Set Enrichment Analysis (ssGSEA): stromal cell scores, immune cell scores, and ESTIMATE scores. Additionally, CIBERSORT, a deconvolution technique, was used to quantify the proportions of distinct cell types by predicting the cellular composition of complex tissues based on gene expression data. The relationship between the risk score and tumor immune infiltration score was investigated using seven different methods. The Tumor Immunology Single Cell Center (TISCH) database (http://tisch.comp-genomics.org/) was used to examine the expression of LMAG prognostic model genes in tumor microenvironment cell types of GC patients. Based on the results of multivariate Cox regression, a nomogram was constructed to integrate multiple risk factors into a single predictive plot, allowing visual prediction of a patient’s survival probability. The nomogram was created using the R package ‘DynNom.’
Statistical analysis
Statistical analyses were conducted using R software (version 4.2.1). DEGs were identified using linear models combined with the empirical Bayes method. Correlation analysis was performed using the Spearman correlation coefficient. For differential analysis of continuous variables, the Student’s t-test was used for normally distributed data, and the Wilcoxon rank-sum test was employed for non-normally distributed data. All p-values were two-tailed, and statistical significance was set at p < 0.05.
Results
Differences in transcriptomic profiles of gastric tissues in individuals with and without GC and identification of survival-related genes
Based on the criteria (|log2FC| > 2 and adjusted p < 0.05), 3911 DEGs (2021 upregulated and 1901 downregulated) were identified between GC and normal tissues in the training cohort (Figure 1(a), Supplementary Table S1). Unsupervised clustering based on these gene expression profiles indicated that the classification of samples was largely consistent with their respective groups (Figure 1(b)), suggesting that the gastric tissues of cancer patients exhibited distinct transcriptomic profiles compared with normal tissues. Using univariate Cox regression analysis, we identified 43 LMAGs that were significantly associated with survival in the training cohort (p < 0.05). Most of these genes were found to be poor prognostic factors in GC (Figure 1(c)). The correlation of gene expression levels is shown in Figure 1(d), with the majority displaying a significant positive correlation. The chromosomal distribution of these LMAGs is shown in Figure 1(e), with most of them located on chromosomes 1–12. CNV refers to alterations in the number of copies of a specific gene or genomic region, frequently occurring in tumors due to various forms of genomic variation, including chromosomal CNVs within tumor cells. CNV gain indicates an increase in the number of copies of a region, usually due to repeated DNA replication, while CNV loss indicates a decrease in the number of copies of a region, often due to the loss of DNA. 21 In tumors, CNV gains or losses are often associated with tumor development and treatment response. For example, CNV gain may lead to overexpression of oncogenes, promoting tumor growth and spread, whereas CNV loss may result in decreased expression of tumor suppressor genes, facilitating tumor progression. Therefore, detecting CNV gains or losses is crucial for diagnosis, prognosis evaluation, and treatment selection. 22 In GC patients, compared with CNV losses, most LMAGs exhibited stronger CNV gains, suggesting their involvement in tumor growth and spread and contributing to poor prognosis (Figure 1(f)).

Genetic and expression variation landscape of LMAGs in GC. (a) Volcano plot. (b) Expression of 100 LMAGs between tumor and normal tissues. (c) Forest plots of Cox regression of 43 LMAGs in GC patients. (d) Chromosome distributions and copy number variations of LMAGs (e–f). LMAGs: lipid metabolism-associated genes; GC: gastric cancer.
Molecular subtyping based on LMAG expression
Consensus clustering analysis was conducted on the TCGA GC dataset, consisting of 335 samples. The cumulative distribution function (CDF) curve and changes in the area under the curve (AUC) indicated that the optimal number of clusters was 2 (Figure 2(a)). All patients were divided into two molecular subtypes: LMAGcluster A and LMAGcluster B. PCA significantly distinguished between these two subtypes, supporting the reliability of the clustering (Figure 2(b)). Survival analysis revealed that patients in LMAGcluster A had significantly worse prognosis than those in LMAGcluster B (median survival: 2.6 years vs. 8.3 years, p < 0.001) (Figure 2(c)). Furthermore, there were significant differences in the expression of LMAGs between the two clusters (p < 0.05) (Figure 2(d)). The heatmap of unsupervised clustering of the top 100 DEGs in GC patients also indicated distinct transcriptional profiles between LMAGcluster A and LMAGcluster B. Moreover, the analysis of the correlation between the two clusters and clinical characteristics showed that the relationship of these top 100 DEGs with TNM stage, age, and sex was not significant (p > 0.05) (Figure 2(e)). Next, we used CIBERSORT to analyze the relative proportions of 22 types of immune cells. As shown in Figure 2(f), 18 types of immune cells exhibited different infiltration levels between the two clusters. Higher infiltration of immature B cells, NK T cells, NK cells, plasmacytoid dendritic cells, regulatory T cells, follicular helper T cells, and type 1 helper T cells was observed in the LMAGcluster A, suggesting that immune infiltration may play an important role in the poor prognosis of this group.
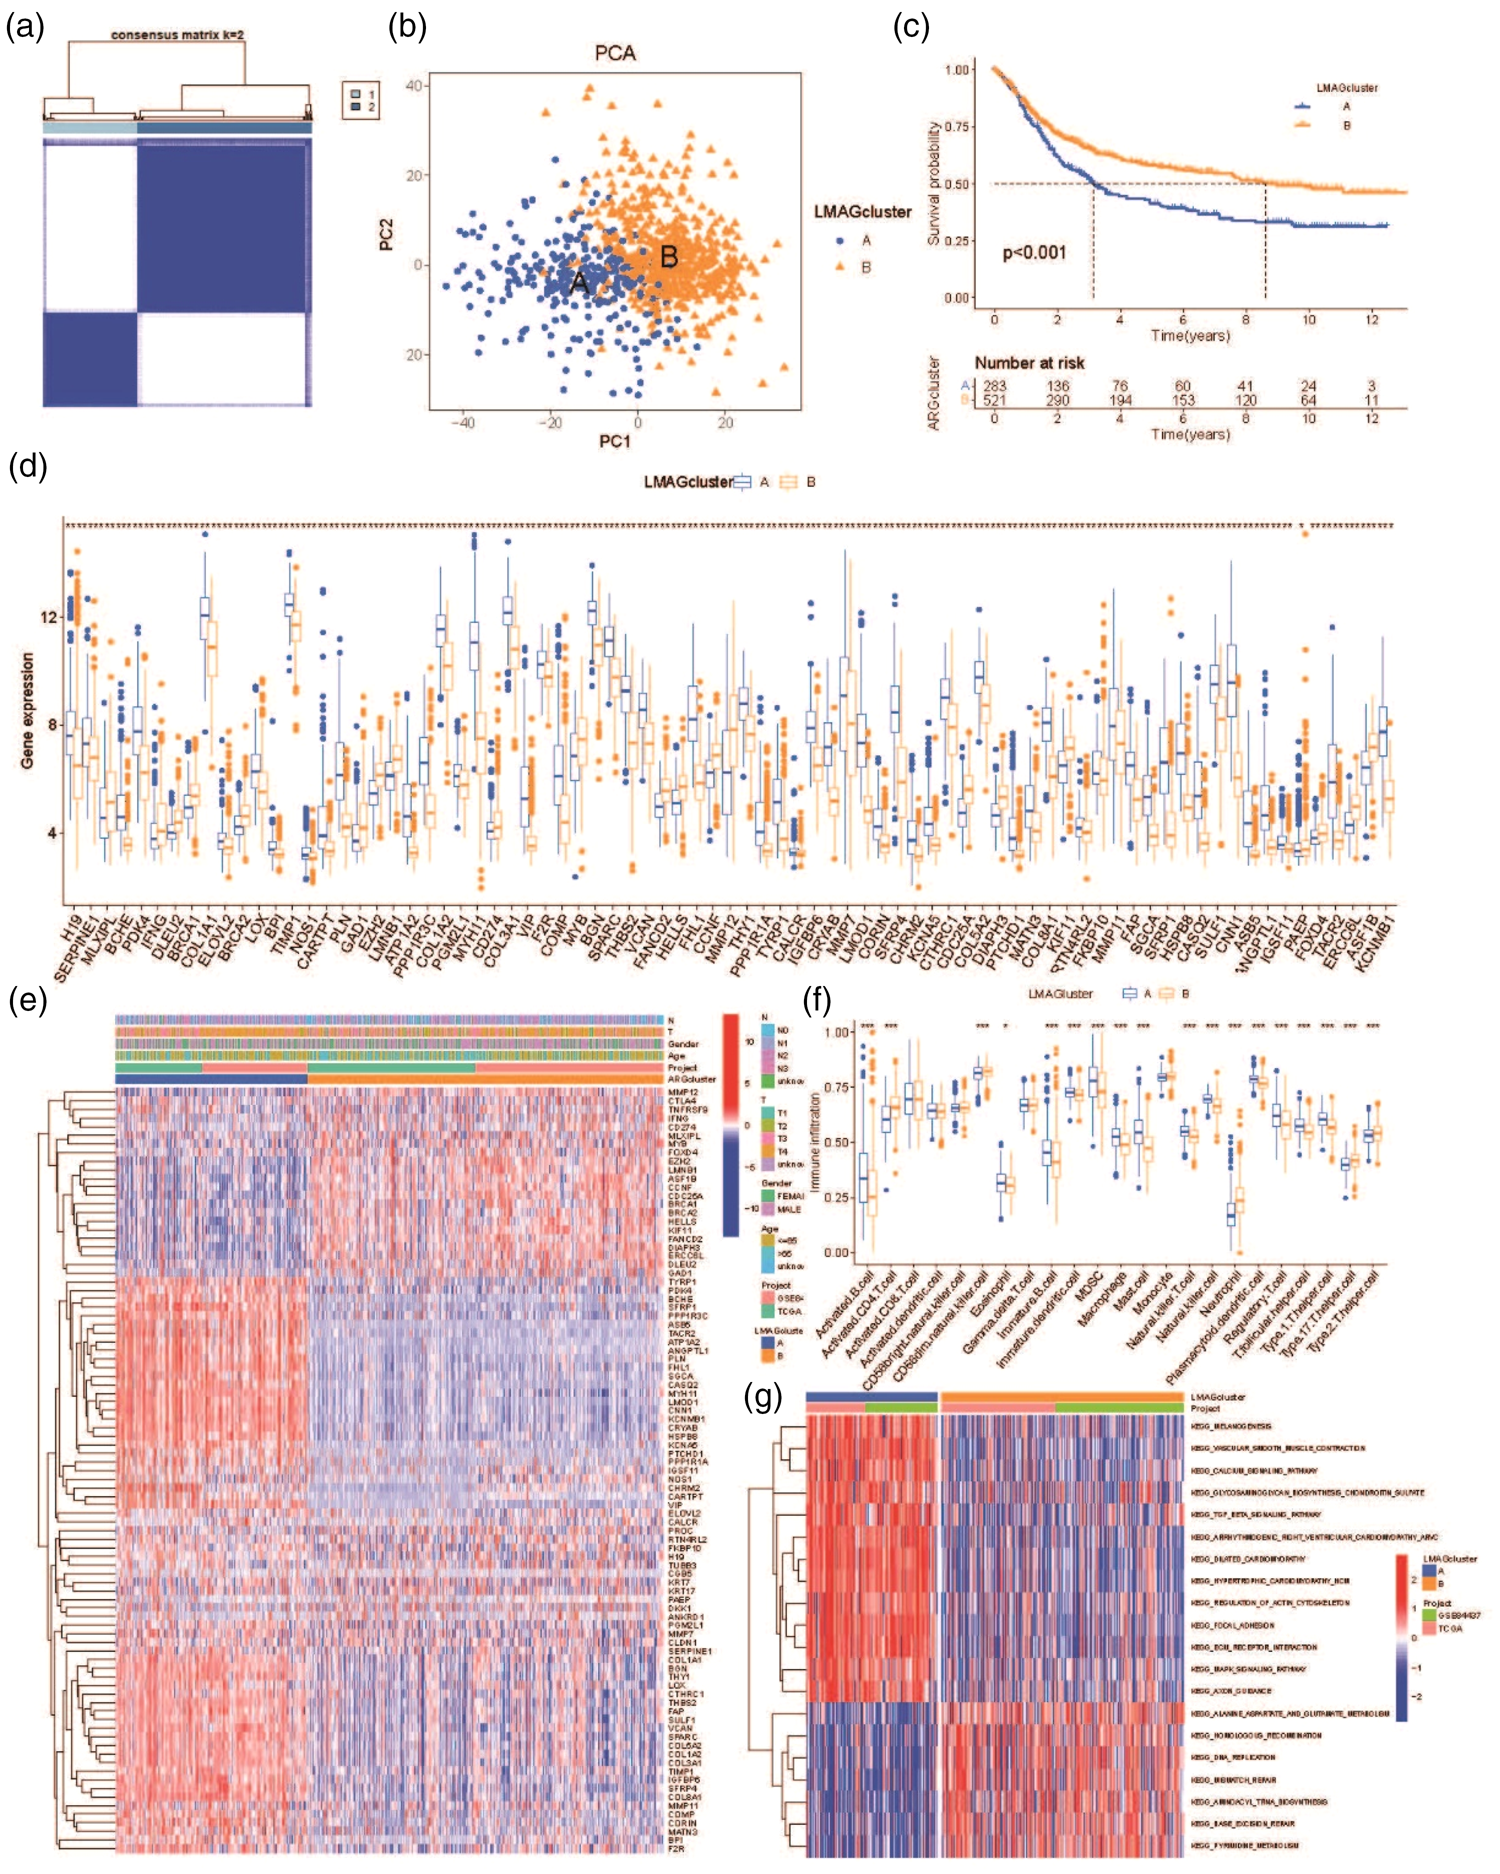
Differential expression analysis of patients with LMAG-related molecular subtypes in GC. (a) Heatmap showing consensus matrix. (b) Principal component analysis for the two clusters. (c) Kaplan–Meier survival analysis between the two clusters. (d) Differences in LMAG expression in GCclusters. (e) Unsupervised clustering heatmap of top 100 LMAGs in GC. (f) Infiltration of 23 immune cell subtypes in patients in GCclusters and (g) differences in LMAG expressions based on GSVA. (*p < 0.05; **p < 0.01;***p < 0.001). LMAGs: lipid metabolism-associated genes; GC: gastric cancer; GSVA: gene set variation analysis.
Functional enrichment and prognostic model construction
Functional annotation of DEGs was performed. The results showed that gene sets related to signaling, cardiovascular diseases, cellular outcomes, and metabolism were primarily enriched in LMAGcluster A, whereas LMAGcluster B was enriched not only in metabolism-related pathways but also in DNA replication and repair pathways (Figure 2(g)). Gene set enrichment analysis indicated that metabolism-related gene sets, including the calcium signaling pathway, dilated cardiomyopathy, DNA replication, extracellular matrix (ECM)–receptor interaction, and focal adhesion, were predominantly enriched in LMAGcluster B (Supplementary Figure 1).
To refine the prognostic signature, we applied LASSO Cox regression to the 43 survival-related LMAGs, selecting 14 genes with nonzero coefficients (Figure 3(a)). The LASSO algorithm uses L1 penalty to shrink coefficients of less relevant variables toward zero, effectively selecting features and improving model generalizability. The optimal penalty parameter λ was chosen through 10-fold cross-validation based on the minimum cross-validation error. The risk score for each patient was calculated using the following formula:


Construction and validation of the prognostic model in the training set. (a) LASSO-regularized Cox regression analysis of key LMAGs. (b) Survival curves for training, internal validation, and external validation sets. (c) ROC curves for training, internal validation, and external validation sets and (d–e) construction of risk assessment model using Cox analysis of 14 LMAGs and differential expression heatmap. LMAGs: lipid metabolism-associated genes; LASSO: least absolute shrinkage and selection operator; ROC: receiver operating characteristic.
Using the optimal cutoff values determined by the R package ‘survminer’ (version 0.4.9), each dataset was automatically divided into low-risk and high-risk groups. Kaplan–Meier analysis demonstrated that patients in the high-risk group had a significantly worse prognosis than those in the low-risk group in the training set, test set, and entire dataset (p < 0.001) (Figure 3(b)). The predictive performance of the risk score for 1-, 3-, and 5-year survival was also evaluated. The AUC values for the training set were 0.702, 0.761, and 0.757, respectively; for the test set, the corresponding values were 0.621, 0.638, and 0.634; and for the entire dataset, the corresponding values were 0.702, 0.761, and 0.757 (Figure 3(c)). Multivariate Cox regression analysis was used to validate the impact of clinical characteristics and risk scores on patient survival. The risk score was identified as an independent risk factor (Figure 3(d)). Patient age, N stage, and risk score were associated with the prognosis of GC patients (Figure 3(e)). Specifically, age (hazard ratio (HR) = 1.03, 95% confidence interval (CI) = 1.017–1.04, p < 0.001), N2 stage (HR = 1.88, 95% CI = 1.344–2.62, p < 0.001), N3 stage (HR = 2.59, 95% CI = 1.770–3.78, p < 0.001), and risk score (HR = 1.12, 95% CI = 1.085–1.16, p < 0.001) were all independent predictors of prognosis. Unsupervised clustering analysis of LMAG expression profiles based on risk grouping also showed distinct patterns between the two groups (Figure 3(e)).
Additionally, a nomogram was developed using the identified independent predictors to forecast 1-, 3-, and 5-year survival probabilities of GC patients in the training cohort. The cumulative risk curves and calibration curves indicated that the nomogram had strong predictive capability for patient prognosis (Figure 4(a) to (c)).

Construction and assessment of the nomogram. (a) Nomogram calibration curve for 1-, 3-, and 5-year OS. (b) Comparison of cumulative hazard between the two clusters. (c) Calibration curves for 1-, 3-, and 5-year OS. (d) Risk score distribution by LMAGcluster groups. (e) Sankey diagram showing the correlation between risk score and LMAGcluster and (f) decision curves of risk score, nomogram, and single clinical factors including T stage, N stage, and age. LMAGs: lipid metabolism-associated genes; OS: overall survival; ROC: receiver operating characteristic; C-index: concordance index.
The results of consensus clustering analysis were consistent with the risk scores, with LMAGcluster A showing significantly higher risk scores than LMAGcluster B (p < 0.001) (Figure 4(d)). The Sankey diagram showed that the majority of patients in LMAGcluster A belonged to the high-risk group, whereas most patients in LMAGcluster B were classified into the low-risk group (Figure 4(e)). To predict the prognosis of GC patients, we developed a comprehensive evaluation model, incorporating age, staging, tumor mutational burden (TMB), and the nomogram. The nomogram demonstrated optimal predictive performance for 1-, 3-, and 5-year survival outcomes (Figure 4(f)).
Immune microenvironment characteristics
The tumor microenvironment is primarily composed of immune cells, ECM, various growth factors, inflammatory factors, and specific physicochemical characteristics, all of which significantly influence disease diagnosis, survival outcomes, and clinical treatment sensitivity. By analyzing the relationship between key genes and immune infiltration in the GC cohort, we further explored the potential molecular mechanisms through which these genes influence disease progression. Figure 5(a) and (b) shows the proportions of immune cells in each patient and the correlations between these immune cells, respectively. Activated CD4 memory T cells and CD8 T cells had the highest positive correlation (r = 0.42), whereas resting CD4 memory T cells and CD8 T cells had the highest negative correlation (r = −0.51). Furthermore, the study identified seven significantly different immune cell types between the two groups, including five lymphoid cells (CD8 T cells, resting CD4 memory T cells, activated CD4 memory T cells, and follicular helper T cells) and two myeloid cells (M1 macrophages and resting mast cells). This finding suggests that immune cells may play an important role in the poor prognosis of patients. Correlation network analysis of infiltrated immune cells within the two groups was conducted to further explore the immune cell types most associated with lipid metabolism. Most immune cell types were negatively correlated with CD8 T cells (Figure 5(b) and (c)).

Differences in immune infiltration between the two clusters. (a) Heatmap of 22 tumor-infiltrating immune cell types. (b–d) Violin plots and heatmap showing differences in immune cell proportions and (e–f) comparison of polygenic risk and tumor microenvironment scores, including stromal score, immune score, and ESTIMATE score.
The prognostic model was associated with differences in the abundance of various immune-infiltrating cells in the tissue, including B cells, M1 macrophages, M2 macrophages, monocytes, and CD8+ T cells (Figure 5(d) and (e)). Comparative analysis of the tumor microenvironment between the two groups indicated that the stromal score in the low-risk group was significantly lower than that in the high-risk group (Figure 5(f)), whereas the immune cell infiltration score was significantly higher in the low-risk group. There was no significant difference in tumor purity between the two groups, suggesting that differences in the tumor microenvironment were primarily reflected in stromal cells and immune cells. Single-cell analysis using the TISCH database for GC from the GSE134520 dataset revealed the expression of 13 LMAGs—SERPINE1, MLXIPL, PDK4, BPI, PROC, TNFRSF9, TYRP1, TUBB3, CORIN, RTN4RL2, MMP11, PAEP, and FOXD4—except CALCR (Figure 6(a) and (b)).

Single-cell analysis of GC in TISCH. (a) GSE134520 dataset and (b) expression of key LMAGs from TISCH. GC: gastric cancer; LMAGs: lipid metabolism-associated genes; TISCH: Tumor Immune Single Cell Hub.
Discussion
This study emphasizes the crucial role of LMAGs in the prognosis and TIME of GC. By analyzing RNA-seq data from 335 GC transcriptomes, we identified 43 LMAGs significantly associated with survival, most of which were poor prognostic factors. Furthermore, we validated the expression, prognostic significance, and immune infiltration of 14 key LMAGs in GC.
Lipid metabolism is a critical cellular process encompassing the synthesis, breakdown, and regulation of lipids, which are essential for maintaining cell membrane integrity, energy storage, and signaling pathways. 4 In cancer cells, lipid metabolism is often dysregulated, leading to metabolic reprogramming that supports rapid tumor cell proliferation, survival, and metastasis.4,5,23 Emerging studies have further shown that mitochondrial lipid oxidation and signaling derivatives (e.g. sphingosine-1-phosphate, prostaglandins) directly regulate T cell exhaustion, macrophage plasticity, and dendritic cell function within tumors, reinforcing the metabolic–immune crosstalk in GC progression.24,25 Recent studies have also demonstrated that the diversity and expression of nuclear-encoded mitochondrial genes involved in amino acid, lipid, and carbohydrate metabolism vary significantly across tissues.26,27 Our findings are supported by the concept of tissue-specific metabolic regulation. This tissue-specific control of metabolic gene expression underpins the metabolic heterogeneity between LMAGcluster A and LMAGcluster B in GC, which drives differential immune infiltration and ultimately influences patient prognosis.
CNVs are structural changes in the genome that can increase the copy number of genes. Our analysis indicated prevalent CNV gains in these genes within tumor samples, suggesting that their amplification might contribute to oncogenic processes. Although widespread CNV gains likely contribute to overexpression of LMAGs and poor prognosis, these specific CNV alterations were not directly incorporated into the final prognostic model. This decision was based on the finding that the mRNA expression signature of the 43 survival-associated LMAGs provided a more robust and practically measurable predictive value for patient stratification. Integrating CNV data, which can be heterogeneous and technically challenging to assess routinely in clinical settings, did not significantly enhance prognostic power beyond the gene expression model. Future models could explore integrating multi-omics data, including CNV, methylation, and proteomics, for a more comprehensive assessment. Understanding these CNVs may aid in the diagnosis, prognosis, and targeting of GC. 17
Consensus clustering analysis further delineated GC into two distinct molecular subtypes, LMAGcluster A and LMAGcluster B, with significant differences in survival outcomes and gene expression profiles. LMAGcluster A was associated with poorer prognosis and exhibited higher stromal scores, increased infiltration of M1 macrophages, and lower infiltration of resting CD4 memory T cells, resting mast cells, and M2 macrophages. These patterns may contribute to a chronic inflammatory environment that supports tumor progression and impairs adequate modulation of the tumor microenvironment.
Our findings align with and extend previous studies.4,15,16,28 The study by Dai et al. 15 confirmed that risk scores derived from six LMAGs through univariate and multivariate Cox regression analysis showed that the high-risk group had higher immune and stromal scores and lower tumor purity scores. ADH4, CYP4A11, and ST6GALNAC3 were negatively correlated with M1 macrophages and positively correlated with M2 macrophages. These LMAG characteristics can effectively assess the prognosis of GC patients and reflect metabolic and immune status. 15 Chen et al. identified three molecular subtypes by analyzing the correlation between survival rates and LMAGs. Their immunological assessment revealed that the subtype with high expression of lipid metabolism genes exhibited a relatively elevated immune status. They constructed a predictive risk model using LMAGs, which accurately predicted the prognosis of GC patients. 16 Notably, our work also aligns with the recent study by Li et al., which focused on necroptosis-related genes (NRGs) in GC. Li et al. developed a prognostic signature that effectively stratified patients into high- and low-risk groups with distinct survival outcomes and immune landscapes. Similar to our LMAG-based model, their NRG signature was an independent prognostic factor and was associated with immune cell infiltration, particularly highlighting the role of immunosuppressive cells such as regulatory T cells and M2 macrophages in the high-risk group. 28 Our findings complement these insights, demonstrating that LMAGs act as poor prognostic factors in GC, consistent with their roles in enhancing tumor aggressiveness and modulating metabolic pathways.
Our study explores the intricate relationship between lipid metabolism and the TIME of GC, as highlighted by our immune profiling results. We found that the high-risk LMAGcluster A subtype was characterized by a distinct immune landscape, including higher infiltration of pro-tumorigenic immune cells such as regulatory T cells and follicular helper T cells, along with alterations in macrophages and CD4+ T cell subsets. These findings suggest that dysregulated lipid metabolism in tumor cells does not only supports anabolic processes but also actively shapes the immune milieu to foster an immunosuppressive environment. Lipid metabolites can act as signaling molecules that influence the differentiation, activation, and function of various immune cells.
Moreover, we identified 14 essential prognostic LMAGs—SERPINE1, MLXIPL, PDK4, BPI, PROC, TNFRSF9, TYRP1, CALCR, TUBB3, CORIN, RTN4RL2, MMP11, PAEP, and FOXD4—that are significantly correlated with GC prognosis. SERPINE1 is a key regulator of the plasminogen activation system, which is crucial for ECM degradation. By inhibiting tissue plasminogen activator (tPA) and urokinase plasminogen activator (uPA), SERPINE1 can influence ECM remodeling, a process vital for tumor invasion and metastasis. 29 Previous studies found that SERPINE1 expression was significantly higher in GC tissues and was associated with advanced tumor stage and lymph node metastasis. 30 SERPINE1 also blocks ECM remodeling, trapping dendritic cells in the stroma and preventing their maturation, thereby impairing the priming of anti-tumor T cells. 31 MLXIPL regulates genes involved in glycolysis and lipogenesis, contributing to the metabolic flexibility of cancer cells. 32 MLXIPL expression has been found to respond to CD8+ T cell infiltration and correlate with prognosis in prostate cancer (PCa). 33 PDK4, or pyruvate dehydrogenase kinase 4, is an enzyme that plays a crucial role in regulating glucose metabolism by inhibiting the pyruvate dehydrogenase complex. 34 This inhibition prevents the conversion of pyruvate to acetyl-CoA, shifting cellular metabolism from aerobic respiration to anaerobic glycolysis. 35 In the context of GC, PDK4 has been implicated in processes that support tumor development and progression. 36 Related research indicates that PDK4 expression may regulate cell adhesion, metal ion transport, synaptic activity, and cancer cell metabolism in GC. 37 PDK4 also inhibits mitochondrial pyruvate metabolism in T cells, depleting glucose in the TIME, impairing resting CD4 memory T cell activation, and inducing T cell exhaustion—mechanisms that align with their lower infiltration in LMAGcluster A. 38 These processes help explain how LMAG dysregulation shapes an immunosuppressive TIME in poor-prognosis GC. Furthermore, TNFRSF9 (tumor necrosis factor receptor superfamily member 9) is involved in immune regulation. Its expression can influence the tumor microenvironment by modulating the activity of T cells and other immune cells.39,40 TUBB3 is associated with microtubule dynamics and chemotherapy resistance, and its overexpression in GC is often linked to poor prognosis and drug resistance.41,42 Tyrosinase-related protein 1 (TYRP1) is involved in melanin biosynthesis and has been implicated in various cancers. 43 Matrix metallopeptidase 11 (MMP11), also known as stromelysin-3, is a member of the matrix metalloproteinase (MMP) family that plays a critical role in ECM degradation.44,45 Previous studies demonstrated that MMP11 overexpression in GC cells significantly contributes to disease pathogenesis. 46 Similarly, Wasenius et al. found that the expression levels of FN, MMP11, and TIMP-1 play crucial roles in early tumor development in papillary thyroid carcinoma, facilitating cancer cell survival within the stromal environment. These findings underscore the importance of MMP11 and related proteins in tumor progression and highlight the role of the stromal environment in supporting cancer cell survival and proliferation. 47
The findings of our study highlight potential clinical applications. The 14-LMAG signature could be developed into a molecular assay to stratify high-risk GC patients, enabling personalized treatment strategies. Moreover, the link between LMAGs and an immunosuppressive TIME suggests that lipid metabolism pathways are promising therapeutic targets. Inhibiting key enzymes, such as FASN, ACC, or CPT1, may reverse immune suppression and synergize with immunotherapies, including checkpoint inhibitors—a strategy warranting clinical evaluation. Specific LMAGs, including SERPINE1, PDK4, and MMP11, also represent potential drug targets for further investigation. Despite these insights, our study has several limitations. First, the retrospective nature of TCGA and GEO data may introduce selection bias, limiting the generalizability of the findings across populations. Second, although our prognostic model was validated in an independent GEO cohort, validation in additional cohorts (e.g. International Cancer Genome Consortium (ICGC) or ArrayExpress) would enhance robustness; eligible datasets with complete data were unavailable at the time of analysis. Third, the study primarily focuses on transcriptomic data, lacking integration with genomic and epigenomic information. Future research should incorporate multi-omics data, including genomic, epigenomic, and proteomic analyses, to gain a more comprehensive understanding of LMAGs’ roles in GC.
Conclusion
We analyzed the expression pattern of LMAGs in GC, leading to the development of novel risk models and molecular subtypes. These models and subtypes demonstrated high accuracy in predicting patient prognosis. Our findings emphasize the crucial roles of lipid metabolism pathways and the TIME in GC progression and outcomes. This study provides a foundation for the development of future therapeutic strategies targeting these pathways.
Supplemental Material
sj-pdf-1-imr-10.1177_03000605251403252 - Supplemental material for Exploring the role of lipid metabolism genes in gastric cancer prognosis and tumor immune microenvironment
Supplemental material, sj-pdf-1-imr-10.1177_03000605251403252 for Exploring the role of lipid metabolism genes in gastric cancer prognosis and tumor immune microenvironment by Yanan Xiao, Qin Yu, Zewen Zhu, Shan Zhou, Zhe Wu, Xin Luo, Xingzhi Huang and Zhiqiang Zhan in Journal of International Medical Research
Footnotes
Acknowledgments
Not applicable.
Author contributions
YNX: designed the study, performed the statistical analyses, and drafted the manuscript. QY: interpreted the data and critically revised the manuscript. ZWZ: interpreted the data and critically revised the manuscript. SZ: critically revised the manuscript and prepared figures. ZW: edited the manuscript and prepared figures. XL: edited the manuscript and prepared figures. HP: performed statistical analyses and drafted the manuscript. ZQZ: conceived the study. All authors reviewed and approved the final manuscript.
Data availability
The datasets used in this study were obtained from TCGA (https://tcga-data.nci.nih.gov/tcga/) and GEO (![]() ) databases.
) databases.
All datasets used in this study are publicly available online.
Declaration of conflicting interests
The authors declare that they have no competing interests.
Funding
This study was supported by the Jiangxi Province Key Department Joint Construction Fund.
Informed consent statement
Not applicable.
Supplemental material
Supplemental material for this article is available online.
References
Supplementary Material
Please find the following supplemental material available below.
For Open Access articles published under a Creative Commons License, all supplemental material carries the same license as the article it is associated with.
For non-Open Access articles published, all supplemental material carries a non-exclusive license, and permission requests for re-use of supplemental material or any part of supplemental material shall be sent directly to the copyright owner as specified in the copyright notice associated with the article.