
Abstract
Prostate cancer (PCa) is a significant global health concern, with its incidence and mortality rates projected to rise due to population aging. In this study, we utilized PCa transcriptome data from public databases and applied bioinformatics methods to identify three prognostic genes (CDC20, RAD51, and TTK) related to centrosome duplication in PCa. CDC20 is involved in cell cycle regulation, RAD51 in deoxyribonucleic acid double-strand break repair, and TTK in spindle assembly checkpoint function and cell proliferation. We constructed a risk model and a nomogram model, both demonstrating moderate to good predictive performance with area under the curve values ranging from 0.611 to 0.765 at different time points. Gene set enrichment analysis revealed that these genes were enriched in 64 pathways, including the cell cycle pathway, which is dysregulated in cancer. Furthermore, we analyzed the immune microenvironment and identified 13 differential immune cells and 13 differential immune checkpoints between high- and low-risk groups, providing insights into potential immunotherapy targets for PCa. In conclusion, this study contributes to a deeper understanding of PCa pathogenesis and lays important theoretical and experimental foundations for developing new diagnostic markers and treatment strategies. Future research requires more clinical samples and continued monitoring of the mechanism of these genes in PCa.
Introduction
As one of the most common cancers worldwide, prostate cancer (PCa) accounts for a large proportion of all cancer-related deaths (Sung et al., 2021). The worldwide PCa incidence is expected to grow to almost 2.3 million and cause 740,000 deaths by 2040 simply due to the growth and aging of the population (Culp et al., 2020). PCa risk increases markedly with age, and >85% of newly diagnosed individuals are aged >60 years. Consequently, PCa incidence is particularly high in regions with high life expectancy, such as the United States and the United Kingdom (Siegel et al., 2022). With the development of technology, current early detection methods, such as prostate-specific antigen testing, digital rectal examination, and histopathologic grading of tissues, enable diagnosis in most men at an early disease stage (Rebello et al., 2021). Life expectancy for men with localized PCa can be as high as 99% over 10 years if diagnosed at an early stage. Various methods exist for the clinical management of patients with PCa. Standard care for localized PCa includes surgery, radiation, and active surveillance (Desai et al., 2021). Patients with metastatic disease are chosen for medical castration with front-line androgen deprivation therapy agents, emerging biological targeted therapy, and immunotherapy. These treatments have extended survival to some extent, but each has its limitations and side effects and cannot eliminate the threat of PCa. Therefore, the in-depth exploration of the molecular mechanism of PCa, especially the gene variation closely related to tumor occurrence, development, and prognosis, has become the forefront of current research (Nyamsambuu et al., 2022). By identifying these key prognostic genes and constructing new prognostic models based on their expression profiles, not only can the risk of disease progression in patients be more accurately assessed but also a scientific basis can be provided for the development of personalized treatment plans (Teo et al., 2019). Such research not only helps to improve the diagnosis and treatment level of PCa but also helps to realize the precision and individuation of tumor treatment (H. Chen et al., 2023).
Centrosome replication is a crucial process in the cell cycle, ensuring that each newly generated daughter cell receives a fully functioning pair of centrosomes, which is essential for maintaining cell polarity and the precision of mitosis (H. Chen et al., 2023; C. Zhang, Ma, et al., 2022). In recent years, with the deepening of cell biology and oncology research, increasing attention has been paid to the role of centrosome replication abnormalities in many diseases, particularly malignant tumors (Luan et al., 2021). Abnormal centrosome replication may not only lead to chromosome instability and genome rearrangement but may also accelerate the malignant process of the tumor by affecting cell cycle regulation and promoting cell proliferation and migration (Q. Wu et al., 2020). Centrosome replication-related genes (CRGs), as the key molecules regulating centrosome replication, have become the focus of research on their expression patterns and functional changes in diseases (Zhang et al., 2020). There are alterations in centrosome structure and number in most cases of PCa, selectively inducing centrosome abnormalities by increasing the level of pericentriolar proteins, which can produce the characteristic phenotype of PCa in prostate epithelial cell lines (Ouyang et al., 2001). The abnormal expression of some CRGs is associated with the invasiveness, metastasis ability, and poor prognosis of patients with PCa; however, how these genes participate in the occurrence and development of PCa needs further investigation (Tarapore et al., 2014).
In this study, based on the transcriptome-related data set of PCa in a public database, a series of bioinformatics methods is implemented to identify prognostic genes associated with CRGs in PCa, and a risk model is constructed. Moreover, the function, prognostic value, and potential mechanism of prognostic genes in the occurrence of PCa are further discussed through enrichment analysis, immune microenvironment analysis, and regulatory network construction to clarify their role in the progression of PCa; the aim is to provide new references for the early clinical diagnosis, treatment, and prognosis of patients with PCa.
Materials and Methods
Data Acquisition
PCa-related datasets—TCGA-PRAD and GSE116918—were retrieved from The Cancer Genome Atlas (https://www.cancer.gov/ccg/research/genome-sequencing/tcga) and Gene Expression Omnibus (http://www.ncbi.nlm.nih.gov/geo/) databases, respectively. Among them, the TCGA-PRAD dataset contained 498 tumor tissue samples and 52 normal tissue samples, with survival information present in 493 patients. The 493 tumor samples were split into a training set and a testing set based on the ratio of 7:3. The GSE116918 (platform: GPL25318) dataset contained 248 tumor tissue samples, which served as a risk model validation set. The Mendelian randomization (MR)-related dataset (ukb-b-13348) was extracted from the Integrative Epidemiology Unit (IEU) Open Genome-Wide Association Study (GWAS) database (https://gwas.mrcieu.ac.uk/datasets/) by searching for “prostate cancer,” and the result contained 462,933 European samples (cases:controls = 3,269:459,664) and 9,851,867 single nucleotide polymorphisms (SNPs). Then, 416 CRGs were acquired based on the Gene Ontology (GO) and Kyoto Encyclopedia of Genes and Genomes (KEGG) databases (Y. Liu et al., 2023).
Differential Expression Analysis
Using the DESeq2 (v1.42.0) package (Love et al., 2014), differential expression analysis was performed to select differentially expressed genes (DEGs) for tumor tissue samples and normal samples in the TCGA-PRAD dataset with |log2FoldChange (FC)| > 1 and p.adj < 0.05. The volcano and heat maps of DEGs were displayed via ggplot2 (v3.4.4 https://rdocumentation.org/packages/ggplot2/) and ComplexHeatmap (v2.16.0; Gu et al., 2016), respectively.
Functional and Pathway Enrichment Analysis and Protein–Protein Interaction Network
The DEGs were overlapped with the CRGs to acquire intersection genes. Enrichment analysis was then executed via clusterProfile (v4.10.0; T. Wu et al., 2021) to probe function and pathway related to intersection genes, including GO and KEGG enrichment analyses (p < .05). The GO analysis identified three parts: biological process (BP), cellular component (CC), and molecular function (MF). In addition, to explore interactions between these genes at the protein level, these genes were first entered into the Search Tool for the Retrieval of Interacting Genes/Proteins facility (https://string-db.org), and the protein–protein interaction (PPI) network was constructed based on a confidence level of 0.4. Furthermore, this network was landscaped using Cytoscape (v3.10.0; Shannon et al., 2003).
Mendelian Randomization Analysis
Expression quantitative trait locus data of intersection genes were retrieved from the IEU OpenGWAS database and served as exposure factors. Similarly, the PCa dataset (ukb-b-13348) was used as the outcome variable. The MR analysis rests upon three fundamental premises: (1) a robust and significant correlation is established between instrumental variables (IVs) and exposure factors; (2) IVs are devoid of relationship with confounding factors; (3) IVs can only influence outcomes through exposure factors and not through other pathways.
Exposure factors reading and IVs (SNPs + InDels) screening were done by extract_instruments in the TwoSampleMR (v0.5.8) package (Hemani et al., 2018). First, SNPs were strictly screened: p < 5 × 10⁻⁶, r2 = 0.001, kb = 10 and F-value > 10. The eligible SNPs were selected for MR analysis. The harmonise_data function in the TwoSampleMR package was used to harmonize effect alleles and effect sizes. Potential causal relationships between intersection genes and PCa were explored using the mr function in the TwoSampleMR package in conjunction with five algorithms: MR–Egger, weighted median, inverse variance weighted (IVW), simple mode, and weighted mode. The IVW algorithm was the primary method of assessing the outcome, and if the IVW method was significant (p < .05), a causal relationship was considered to exist between the exposure factor and the outcome. The odds ratio (OR) values were calculated where OR >1 indicated a risk factor and OR ≤ 1 indicated a protective factor. These results were specifically presented through scatter plots, forest plots, and funnel plots. Furthermore, scatter plots and forest plots visualized MR outcomes, while funnel plots confirmed adherence to Mendel’s second law. Moreover, a heterogeneity test (p > .05), a horizontal pleiotropy test (p > .05), and a leave-one-out sensitivity test were performed to assess the robustness and reliability of the results. Following this, the Steiger directionality test was performed through the directionality test function to evaluate the causal direction between intersection genes and PCa. A condition of correct direction of causality = TRUE (p < .05) indicated that there was a unidirectional causal relationship between intersection genes and PCa. Finally, genes with a significant causal association with PCa, as screened by MR randomization analysis, were defined as candidate genes and used in follow-up analyses.
Construction and Validation of a Risk Model
In the training set, a univariate Cox analysis was conducted on the candidate genes using survival (v3.5-7 https://CRAN.R-project.org/package=survival) to screen for survival-related genes based on a p-value of <.05. Then, the survival-related genes were subjected to a proportional hazards (PH) assumption test (p > .05). Then, the genes with p > .05 were submitted to least absolute shrinkage and selection operator (LASSO) analysis using glmnet (v4.1-8; Friedman et al., 2010). The parameter family = “cox” was set to realize LASSO logistic regression to screen prognostic genes and construct a risk model. Furthermore, risk scores were calculated based on the expression of prognostic genes and LASSO risk coefficients.
Initially, in the training cohort, patients with PCa were categorized into a high-risk group and a low-risk group based on the optimal threshold of the risk score using the surv_cutpoint function. In addition, Kaplan–Meier (K–M) survival curves were plotted using survminer (v0.4.9 https://CRAN.R-project.org/package=survminer) to analyze the difference in overall survival between the two risk groups (p < .05). Subsequently, risk curves were plotted to show the distribution of risk scores and survival of the two groups of patients. Heat maps were also drawn to visualize the expression of prognostic genes in both groups of patients. Then, receiver operating characteristic (ROC) curves were generated using timeROC (v0.4; Lin et al., 2023), and the area under the curve (AUC) was calculated for 1, 3, and 5 years (AUC > 0.6). Finally, to assess the accuracy of the risk model, the above analyses were performed on the testing set and the GSE116918 dataset.
Independent Prognostic Analysis
To assess whether risk scores could be considered as independent prognostic factors for PCa independently of other clinical characteristics, risk scores and clinical characteristics (age, race, pathologic T and N) were subjected to univariate Cox analysis, and factors with p < .05 were submitted to the PH assumption test (p > .05), followed by multivariate Cox analyses of the factors that passed the test again. The factors with p < .05 were considered independent prognostic factors for PCa. Subsequently, rms (v6.7-0 https://CRAN.R-project.org/package=rms) was employed to construct a nomogram of independent prognostic factors to assess the probability of patient survival for 1, 3, and 5 years. To assess the predictive accuracy and validity of the model, calibration and ROC curves were plotted using calibrate (v1.7.7 https://CRAN.R-project.org/package=calibrate) and timeROC, respectively.
Immune Infiltration and Immune Checkpoint Analyses
To investigate the association of prognostic genes with immune cells and immune checkpoints, the role and clinical significance of the immune system in the disease process were further researched. In the TCGA-PRAD dataset, single sample gene set enrichment analysis (GSEA) was utilized to compute the enrichment scores of 28 immune cells in patients of different risk cohorts via GSVA (v1.49.4; Hänzelmann et al., 2013), and their difference in infiltration levels between high- and low-risk cohorts was assessed (Wilcoxon, p < .05). Subsequently, Spearman correlations (|r| > .3, p < .05) were executed between differential immune cells, as well as between differential immune cells and prognostic genes, using Corrplot (v0.92; https://github.com/taiyun/corrplot). Furthermore, the existing literature (J. Zhang, Han et al., 2022) was consulted to identify and analyze 43 immune checkpoints to determine whether there were any expression differences between the two risk groups (Wilcoxon, p < .05). Similarly, correlations between differential immune checkpoints and prognostic genes were assessed (|r| > .3, p < .05).
Gene Set Enrichment Analysis
To probe the regulatory pathways and functions associated with prognostic gene expression, GSEA was performed using clusterProfiler. First, the correlation coefficient between prognostic genes and all other genes in the TCGA-PRAD dataset was computed using Spearman, and the coefficients were sorted in decreasing order, with c2.cp.kegg. (v2023.1. Hs.symbols) as the reference gene set for GSEA. A p-value of <.05 indicated markedly enriched pathways, and TOP5 pathways were selected for presentation.
Subcellular Localization, Disease Association Analysis, and Functional Annotation
Subcellular localization allowed for the localization of proteins or expression products to specific locations in the cell, leading to a better understanding of the mechanism of action of prognostic genes. Subcellular localization of prognostic genes was predicted using mRNALocater (http://bio-bigdata.cn/mRNALocator). Moreover, the association between prognostic genes and diseases was explored, and the Comparative Toxicogenomics Database (http://ctdbase.org/) was utilized to reveal prognostic gene-associated diseases, providing better direction and insights for PCa treatment. Furthermore, functional annotation of prognostic genes was implemented using the TissueNexus database (https://www.diseaselinks.com/TissueNexus).
Molecular Regulatory Networks and Drug Sensitivity Analysis
A molecular regulatory network is a mechanism of gene regulation that involves the interaction of multiple ribonucleic acid (RNA) molecules, which allows for a better understanding of the complexity of gene regulation as well as the mechanisms of disease occurrence. First, in the TCGA-PRAD dataset, differentially expressed microRNAs (DEmiRNAs) and differentially expressed long non-coding RNAs (DElncRNAs) were screened between tumor and normal groups using limma (v3.58.1; Ritchie et al., 2015) and DESeq2, respectively (|log2FC| > 1, adj. p < .05). Then, the miRNAs corresponding to prognostic genes were predicted using mirwalk (http://mirwalk.umm.uni-heidelberg.de/) and overlapped with DE-miRNA to obtain key miRNA. Similarly, lncRNA corresponding to target miRNA was predicted from starBase (http://starbase.sysu.edu.cn/) and overlapped with DE-lncRNA to acquire key lncRNA. Subsequently, Cytoscape (Shannon et al., 2003) was utilized to construct the lncRNA–miRNA–mRNA network. Moreover, transcription factors (TFs) corresponding to prognostic genes were predicted using the Encyclopedia of DNA Elements project (https://www.encodeproject.org/), and the TFs–mRNA–miRNA network was developed. In addition, to investigate the differences in sensitivity to common chemotherapeutic agents in patients from different risk cohorts, common chemotherapeutic agents were first acquired from the Genomics of Drug Sensitivity in Cancer database (https://ngdc.cncb.ac.cn/databasecommons/database/id/419). The half-maximal inhibitory concentrations (IC50) of common chemotherapeutic drugs in each tumor sample were calculated using pRRophetic (v0.5; Geeleher et al., 2014). To discern any significant differences in drug sensitivity between the two groups, a Wilcoxon rank-sum test was employed (p < .05). The potency of a drug is inversely related to its IC50 value; the higher the IC50 is, the lower the potency; conversely, the lower the IC50 is, the higher the potency.
Statistical Analysis
Bioinformatics analyses were performed utilizing the R programming language (v 4.2.2). The Wilcoxon rank-sum test was used to compare the differences between the two groups. A p-value of <.05 was considered statistically significant.
Results
Functions, Pathways, and the Interaction of Intersection Genes Were Explored
The 2,959 DEGs were selected, containing 1,245 up-regulated and 1,714 down-regulated genes, for “tumour” and “normal” in the TCGA-PRAD dataset (Figure 1A and B). Then, 63 intersection genes were acquired via overlapping DEGs and CRGs (Figure 1C). Furthermore, these intersection genes were enriched to a total of 426 GO entries, which contained 40 CCs (e.g., nuclear chromosome and condensed chromosome), 32 MFs (e.g., ATP-dependent DNA damage sensor activity and DNA damage sensor activity), and 354 BPs (e.g., meiotic cell cycle process and nuclear division; Figure 1D). Furthermore, they also participated in 12 KEGG pathways, of which the TOP5 pathways contained cell cycle, oocyte meiosis, progesterone-mediated oocyte maturation, human T cell leukemia virus 1 infection, and homologous recombination (Figure 1E). Furthermore, based on confidence = 0.4, a PPI network containing 52 intersection genes and 367 edges was constructed, in which CDC20, EXO1, and RAD51 had a strong degree of binding and more interactions with other genes (Figure 1F).

(A, B) Up-Regulated Genes and Down-Regulated Genes in the TCGA-PRAD Dataset. (C) Overlapping DEGs and CRGs Obtain Intersection Genes. (D) GO Entries Co-Enriched by Intersection Genes. (E) KEGG Pathway Enrichment Analysis. (F) PPI Network Construction
Candidate Genes Were Obtained by Mendelian Randomization Analysis
Mendelian randomization analysis was constructed using 63 intersection genes as exposure factors and PCa as the outcome variable. The MR analysis revealed a significant causal link between 11 intersection genes and PCa (p < .05). Among these, eight were identified as risk factors, while three emerged as protective factors. Upon examination of the expression patterns of these 11 genes within the TCGA-PRAD dataset, seven genes exhibiting coherent expression trends were identified and designated as potential candidate genes (Supplemental Table S1). Furthermore, utilizing the IVW method, a scatter plot demonstrated a pronounced association between seven genes and PCa, featuring an intercept proximate to zero, which underscores minimal confounding effects. Notably, all seven genes exhibited positive slopes in the IVW analysis, indicating their status as risk factors (File S1). The forest plot showed the predicted exposure factors for each SNP locus on outcome diagnostic efficacy (File S2). Funnel plots showed that the SNP distributions for seven genes were generally symmetrical and evenly distributed, indicating that the MR analysis adheres to Mendel’s second law of random assortment (File S3).
Sensitivity analysis provided additional evidence that the MR analysis was accurate. Specifically, Cochran’s Q test for the seven genes showed no heterogeneity (p > .05); thus, the MR analysis used a fixed-effects IVW model (Table S2). The horizontal pleiotropy test showed no horizontal pleiotropy for the seven genes (p > .05), suggesting the absence of confounding factors (Table S3). Phasing out individual SNPs did not significantly alter the effect of the rest on the outcome, confirming MR analysis reliability (File S4). In addition, the Steiger directionality test showed that all seven genes were correctly oriented, indicating a unidirectional causal relationship with PCa (correct_causal_direction = true and steiger_pval < .05; Supplemental Table S4). In summary, MR analysis identified seven genes causally associated with PCa as candidate genes, which were included in the follow-up study.
CDC20, RAD51, and TTK Were Identified as Prognostic Genes
To ascertain the genes exhibiting a significant correlation with PCa survival, a univariate Cox regression analysis was performed on seven candidate genes. The analysis revealed that CDC20, RAD51, and TTK were notably associated with PCa (p < .05 and homologous recombination [HR] ≠ 1; Figure 2A and B). Furthermore, when the optimal lambda was identified as −6.5963, the regression coefficients of these three genes were not set to zero. Consequently, CDC20, RAD51, and TTK were defined as prognostic genes for PCa (Figure 2C and D).

(A, B) Univariate Cox Regression Analysis of Genes Significantly Associated With PCa Survival. (C, D) Identification of Prognostic Genes in PCa
The Risk Model Demonstrated an Excellent Capacity for Risk Assessment
A risk model was constructed within the TCGA-PRAD training cohort based on the prognostic genes identified. The risk score was calculated according to the following formula: risk score = 0.9794 ×CDC20 expression + 0.2237 ×TTK expression + (−0.8881) ×RAD51 expression. The optimal risk score threshold of 1.2276 was employed to categorize patients with PCa with comprehensive survival data into high-risk and low-risk groups. Subsequently, the risk curve and survival profiles of these groups were presented, revealing a lower mortality rate in the low-risk group than in the high-risk group (Figure 3A). The heat map of prognostic gene expression revealed higher expression of CDC20, RAD51, and TTK in the high-risk group (Figure 3B). Furthermore, the survival rate of patients in the low-risk group was significantly higher compared with those in the high-risk group, as shown by the K–M curves (p < .0001; Figure 3C). Meanwhile, the ROC curve demonstrated that the risk model exhibited predictive accuracy, as evidenced by the respective AUC values of 0.720, 0.757, and 0.611 for the 1, 3, and 5-year periods (Figure 3D). Importantly, the universality of the risk model was confirmed in the testing set and GSE116918 dataset based on the following facts: (1) higher mortality rates were observed in the high-risk group compared with the low-risk group in the risk curve and survival status (Figure 3E); (2) elevated expression levels of CDC20, RAD51, and TTK were detected in the high-risk group compared with the low-risk group (Figure 3F); (3) the K–M survival curves revealed statistically significant divergence in survival outcomes between the high-risk group and the low-risk group, with p-values of .0048 and .0022, respectively, in the testing set and GSE116918 dataset (Figure 3G); (4) the AUC values of the ROC curves for the 1, 3, and 5-year durations were 0.63, 0.627, and 0.71, respectively, in the testing set, while they were 0.976, 0.618, and 0.618, respectively, in the GSE116918 dataset (Figure 3H).

(A) Risk Curve and Survival Profile. (B) Heatmap of Prognostic Gene Expression Revealed That CDC20, RAD51, and TTK Expression Was Higher in the High-Risk Group. (C) K–M Curve Showed That the Survival Rate of Patients in the Low-Risk Group Was Significantly Higher Compared With the High-Risk Group. (D) ROC Curve Demonstrated That the Risk Model Showed Predictive Accuracy. (E) The Universality of the Risk Model Was Confirmed in the Test Set and GSE116918 Dataset. (F) Compared With the Low-Risk Group, the Expression Levels of CDC20, RAD51, and TTK Were Detected to be Increased in the High-Risk Group. (G) K–M Survival Curve Revealed Statistically Significant Differences in the Survival Outcomes Between the High-Risk and Low-Risk Groups. (H) 1-, 3-, and 5-Year Duration ROC Curve Analysis
Independent Prognostic Factors for PCa Were Confirmed
Based on clinical features (age, race, pathologic_T, and pathologic_N) in the training set, these clinical characteristics and risk scores were further screened to determine whether they were independent prognostic factors for PCa. After a series of screenings, only risk score and pathologic_T were independent prognostic factors for PCa (Figure 4A–C). Following this, the nomogram model was developed to evaluate the predictive ability of combining the risk score and pathologic_T in estimating the likelihood of survival at 1, 3, and 5 years for patients with PCa. In this model, a greater total point value corresponded to a higher rate of survival among individuals diagnosed with PCa (Figure 4D). Furthermore, the nomogram model was assessed using calibration curves and ROC curves to determine its predictive capability. The calibration curves for years 1, 3, and 5 exhibit slopes that closely approximate 1, demonstrating a general alignment between the predictions made by the nomogram model and the actual outcomes (Figure 4E). Meanwhile, the AUC values of the nomogram model in the ROC curve were >0.7 at 1 (0.731), 3 (0.765), and 5 (0.729) years (Figure 4F), indicating a reasonable level of accuracy in predicting PCa by the nomogram model.
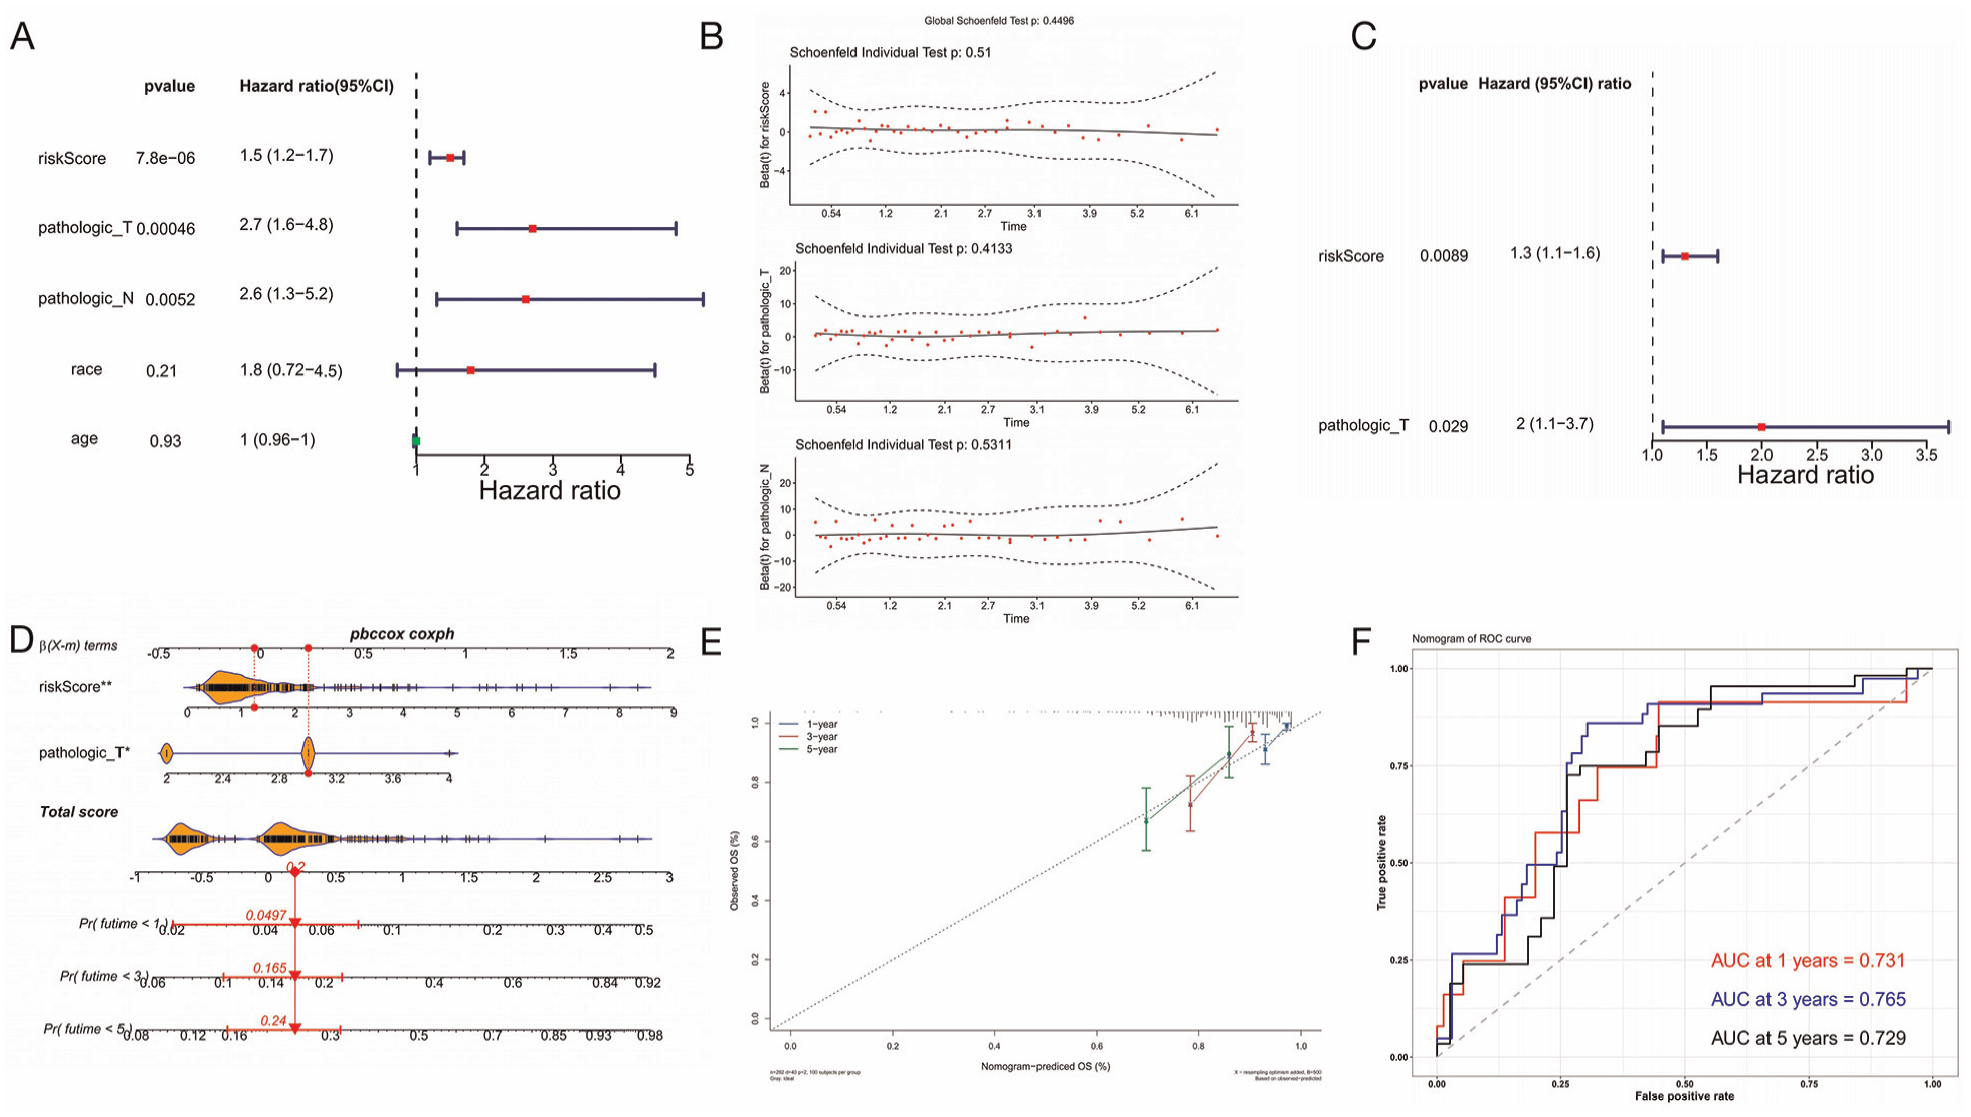
A–C: Risk Score for Clinical Characteristics. D: Nomogram Model to Evaluate the Combined Risk Score. E: Calibration Curve Assesses Nomogram Model. F: ROC Curve to Assess Nomogram Model
Distinct Differential Immunity Cells, Immune Checkpoints, and Drug Sensitivities Were Identified Between the High-Risk and Low-Risk Groups
Immune cell infiltration serves as a crucial feature in elucidating the intricacies of disease defense mechanisms, thereby revealing the pivotal role played by the immune system in the initiation and progression of cancer. The examination of immune infiltration patterns among patient cohorts has the potential to advance personalized therapeutic strategies. This study examined the variations observed in the immune microenvironment between two risk groups, which depicted the abundance of 28 infiltrating immune cell types across these groups with a heat map (Figure 5A). Additionally, 13 types of cells exhibited differences between the high-risk group and low-risk group, including activated B cells, activated CD4 T cells, and gamma delta T cells (Figure 5B). Notably, most of the significant positive correlations were between the differential immune cells (Figure 5C). CDC20, RAD51, and TTK exhibited significant positive correlations with activated CD4 T cells (p < .001), with correlation coefficients of 0.327, 0.338, and 0.320, respectively. Notably, RAD51 was also positively associated with gamma delta T cells (|r| = .380, p < .001). In contrast, there was a significant negative correlation observed between CDC20 and immature dendritic cells (|r| = −0.330, p < .001), while TTK exhibited a significant negative correlation with Type 17 T helper cells (|r| = −0.389, p < .001; Figure 5D). Furthermore, the expression differences of immune checkpoints in the two risk groups were analyzed. The findings indicated notable variations in the expression of 13 differential immune checkpoints between the high-risk group and the low-risk group (Figure 5E). In addition to the three immune checkpoints (CD40, CEACAM1, and VSIR), the expression of CD276, CD70, CD80, CD86, HAVCR2, ICOS, LGALS9, TNFRSF18, and TNFRSF4 were significantly higher in the high-risk group than in the low-risk group. Furthermore, there was a significant positive correlation between CDC20 and CD276 (p < .001; Figure 5F). These results indicated that the significant survival difference between the high-risk group and low-risk group may be attributed to the impact on differential immunity cell function and differential immune checkpoint regulation, which subsequently affected the prognosis of PCa. In addition, the sensitivity of drugs between the high-risk group and the low-risk group was evaluated. The results demonstrated that the IC50 values of 79 drugs were significantly different between the high-risk group and the low-risk group (p < .05; Figure 5G). Among those drugs, a notable observation was the identification of 35 drugs that exhibited significantly elevated IC50 values in the high-risk group compared with the low-risk group, prominently including ZM.447439, vorinostat, and VX-680. Conversely, 44 drugs demonstrated markedly reduced IC50 values in the high-risk group relative to the low-risk group, exemplified by RDEA119, PHA-665752, and PF-562271. These observations provide a valuable theoretical framework to guide the exploration of potential therapeutic agents targeting both high-risk group and low-risk group conditions.

(A) Abundance of 28 Infiltrating Immune Cell Types. (B) Thirteen Types of Cells Showed Differences Between High-Risk and Low-Risk Groups. (C) Correlation Between Differential Immune Cells. (D) Association of CDC20, RAD51, and TTK With Immune Cells. (E) Expression Difference of Immune Checkpoints Between the Two Risk Groups. (F) Expression Difference of Immune Checkpoints in the High-Risk Group. (G) IC50 Values of 79 Drugs Were Significantly Different Between the High-Risk and Low-Risk Groups
GSEA and Subcellular Localization Analysis of CDC20, RAD51, and TTK Were Performed
The GSEA analysis revealed that CDC20 was implicated in 134 distinct pathways, RAD51 in 119 pathways, and TTK in 88 pathways, with a notable overlap of 64 common pathways shared by all three genes (Figure 6A–C). Among these shared pathways, examples included medicus reference origin unwinding and elongation, medicus reference DNA replication licensing, and medicus reference pre-IC formation. To better understand the prognostic genes, subcellular localization analyses of CDC20, RAD51, and TTK were performed. The results of the subcellular localization showed that three prognostic genes were almost entirely distributed in the cytoplasm (Figure 6D). Moreover, the prognostic gene-related disease association analysis for PCa revealed an overlap of four diseases among the top five diseases associated with the three genes. The aforementioned diseases were as follows: weight loss, chemical and drug-induced liver injury, necrosis, and inflammation (Figure 6E). In addition, the examination of additional genes that are intricately linked to prognostic gene function provided a comprehensive view of their pivotal roles in biological processes. It was noteworthy that BUB1B emerged as the most pertinent gene associated with CDC20 function (Figure 6F), RAD51AP1 with RAD51 function (Figure 6G), and CDC27 with TTK function (Figure 6H).

(A–C) Association Between CDC20, RAD51, and TTK and Different Pathways. (D) Subcellular Localization Analysis of CDC20, RAD51, and TTK. (E) Four of the Top Five Diseases Associated With CDC20, RAD51, and TTK Overlap. (F) BUB1B Is the Most Relevant Gene Associated With CDC20 Function. (G) RAD51AP1 is the Most Relevant Gene Associated With RAD51 Function. (H) CDC27 Is the Most Relevant Gene Associated With TTK Function
The Regulatory Network of CDC20, RAD51, and TTK Was Analyzed
The regulatory network plays a pivotal role in gene expression regulation, making it a highly significant area of research. It reveals the intricate complexity and multifaceted nature of this process, thereby fostering a profound comprehension of gene expression regulation mechanisms. Differential expression analysis identified 55 DEmiRNAs in the TCGA-PRAD dataset, comprising 47 up-regulated and 8 down-regulated miRNAs (Figure 7A and B). In addition, 965 DElncRNAs were selected, with 400 up-regulated and 565 down-regulated lncRNAs in the same dataset (Figure 7C and D). Furthermore, 1,403 miRNAs targeting prognostic genes were predicted using the Mirwalk database. The intersection of the predicted miRNAs with DEmiRNAs yielded two key miRNAs (hsa-mir-1269a and hsa-mir-133b; Figure 7E). Similarly, the starBase database was used to identify nine lncRNAs that target the key miRNAs. The intersection of these predicted lncRNAs with DElncRNAs led to the identification of a key lncRNA, NEAT1 (Figure 7F). The mRNA–miRNA–lncRNA interaction network revealed a potential interplay between CDC20, hsa-mir-133b, and NEAT1, suggesting a potential regulatory mechanism involving these molecules (Figure 7G). Following this, the TF prediction analysis found that CDC20 was related to 55 transcription factors, including TAL1, TFDP1, and SP1 (Figure 7H).
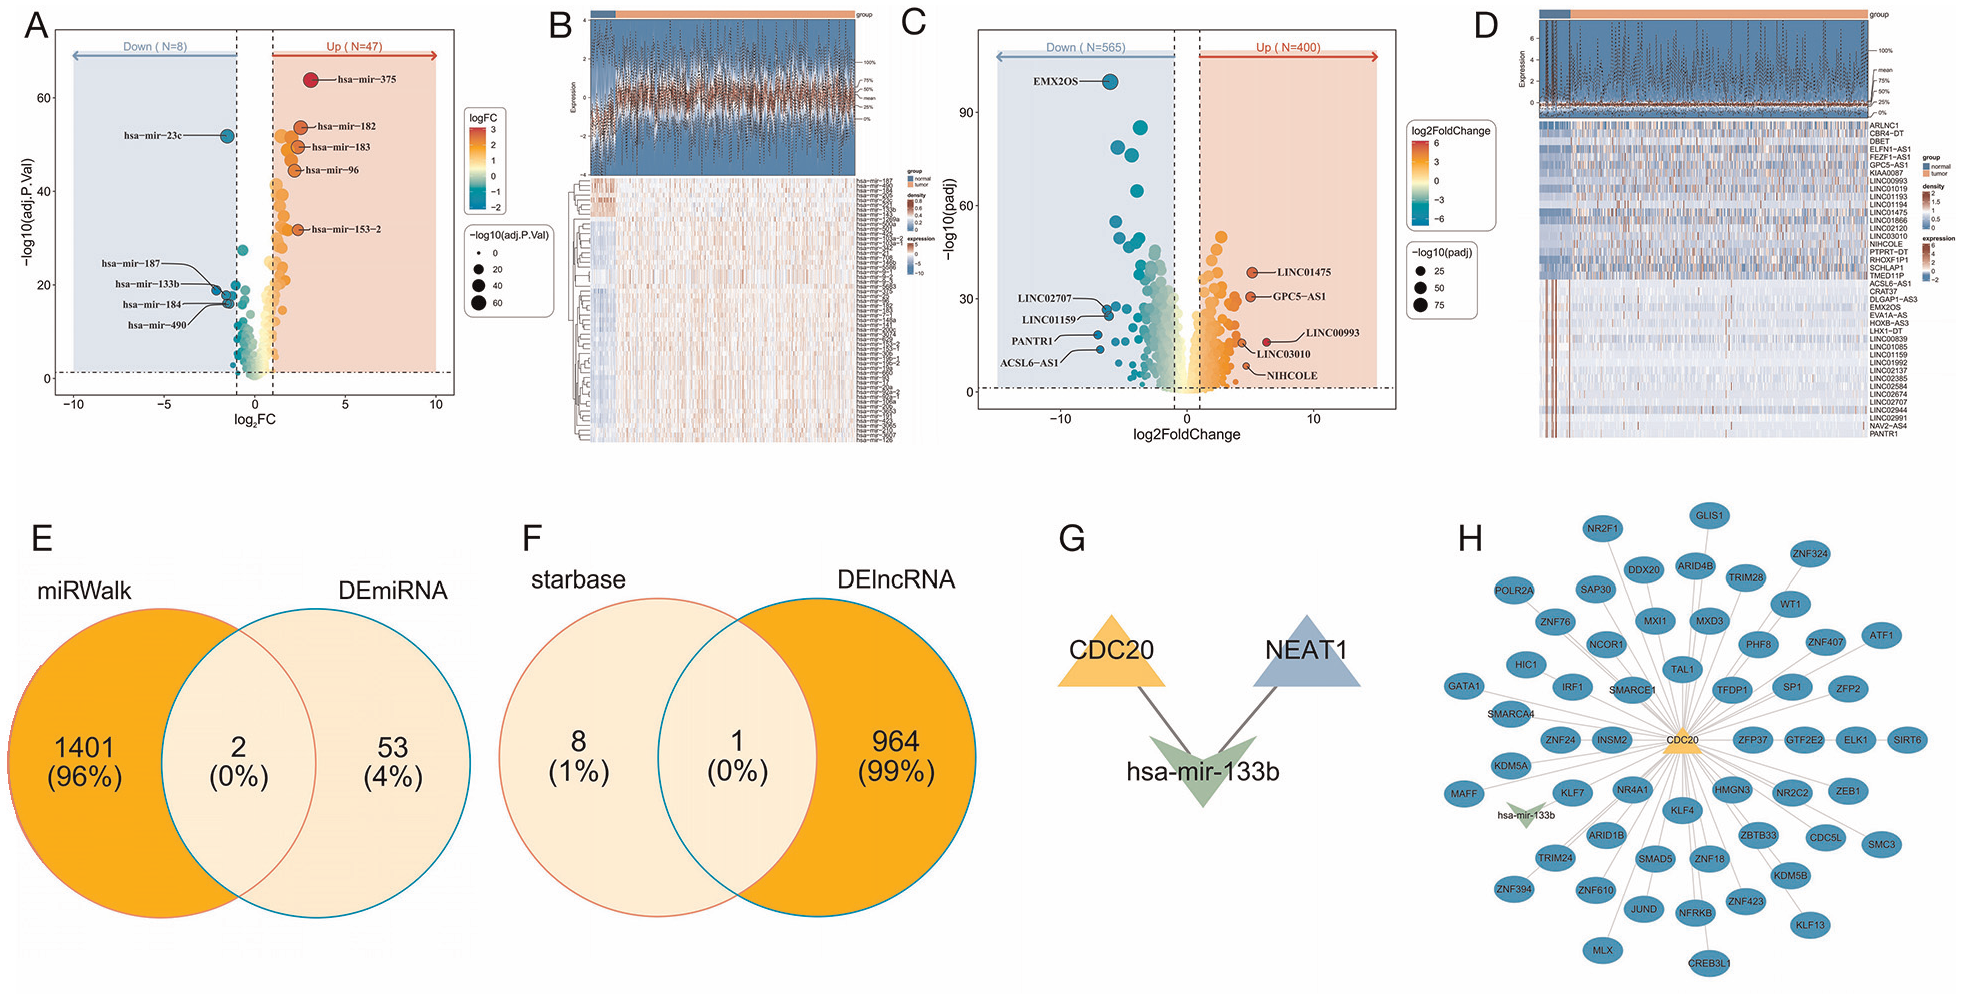
(A, B) Differential Expression Analysis Identifies Up-Regulated and Down-Regulated miRNAs in the TCGA-PRAD Dataset. (C, D) Up-Regulated and Down-Regulated lncRNAs. (E) Intersection of Predicted miRNAs With DEmiRNAs. (F) Intersection of Predicted lncRNAs With DElncRNAs. (G) The mRNA–miRNA–lncRNA Interaction Network. (H) TF Prediction Analysis Analyzes Transcription Factors Associated With CDC20
Discussion
In this study, we utilized PCa transcriptome data from public databases and employed bioinformatics methods to identify prognostic genes related to centrosome duplication in PCa. We constructed a risk model and conducted a thorough analysis of the prognostic gene functions, prognostic value, and potential mechanisms, aiming to provide new insights into the early diagnosis, treatment, and prognostic evaluation of PCa.
CDC20 (Cell Division Cycle 20 Homolog) is a key cell cycle regulator involved in ubiquitin-dependent protein catabolism. During mitosis, CDC20 interacts with the anaphase-promoting complex to promote the degradation of cell cycle-related proteins, ensuring the smooth progression of cells into the next division stage (Messeha et al., 2024; Volonte et al., 2022). RAD51, a protein found in eukaryotes analogous to RecA in prokaryotes, plays a crucial role in DNA double-strand break repair. As a key protein in the HR mechanism, RAD51 promotes the binding of broken DNA ends and forms complexes with other related proteins to search for and pair homologous sequences, completing precise DNA repair. This is essential for maintaining genomic stability and preventing the loss of genetic information (Bonilla et al., 2020; Feng et al., 2021; Gachechiladze et al., 2017). TTK (TTK protein kinase) primarily functions as a core component of the spindle assembly checkpoint, promoting the correct alignment of chromosomes during mitotic metaphase and the proper attachment of chromosomes to the mitotic spindle, thereby ensuring accurate segregation of genetic material. In addition, TTK is involved in positively regulating cell proliferation and is closely related to the cell cycle process. In cancer, high expression of TTK is associated with rapid proliferation of tumor cells and poor prognosis, making it a potential target for anticancer therapy (Chan et al., 2022; Miao et al., 2023; Riggs et al., 2017).
In our study, the AUC values of the risk model for patients with PCa at 1, 3, and 5 years were 0.72, 0.757, and 0.611, respectively. Meanwhile, the AUC values of the nomogram model for evaluating the prognosis (survival rate) of patients with PCa at 1, 3, and 5 years were 0.731, 0.765, and 0.729, respectively. According to the model results, GSEA revealed that the three prognostic genes were enriched in 64 pathways. Cell cycle is one of the 64 pathways and cell cycle dysregulation is inevitable in cancer etiology and is targeted by various therapies in PCa treatment (W. S. Chen et al., 2019). However, PCa falls under the category of immune-resistant cold tumors, for which immunotherapy exhibits limited efficacy in patients with solid tumors (D. Liu et al., 2024). Analysis of the immune microenvironment identified 13 differential immune cells between high- and low-risk groups in this study: activated B cell, activated CD4 T cell, gamma delta T cell, immature dendritic cell, memory B cell, monocyte, natural killer cell, neutrophil, plasmacytoid dendritic cell, regulatory T cell, type 17 T helper cell, type 2 T helper cell, and mast cell. In addition, 13 differential immune checkpoints were identified: CD276, CD40, CD70, CD80, CD86, CEACAM1, HAVCR2, ICOS, LGALS9, TNFRSF18, TNFRSF4, TNFSF18, and VSIR. This may provide a reference and basis for immunotherapy of PCa.
Conclusion
This study used bioinformatics analysis to identify prognostic genes (CDC20, RAD51, and TTK) related to centrosome duplication in patients with PCa and constructed a risk model, which contributes to a more comprehensive understanding of the pathogenesis of PCa. It also provides important theoretical and experimental foundations for developing new diagnostic markers and treatment strategies. This study is primarily based on bioinformatics exploration, and future research requires more clinical samples to provide data support. In addition, we continue to closely monitor the mechanisms of these genes in PCa.
Supplemental Material
sj-xlsx-1-jmh-10.1177_15579883251319125 – Supplemental material for Prognostic Value of Centrosome Replication-Related Genes in Prostate Cancer Based on Transcriptomic and Mendelian Randomization
Supplemental material, sj-xlsx-1-jmh-10.1177_15579883251319125 for Prognostic Value of Centrosome Replication-Related Genes in Prostate Cancer Based on Transcriptomic and Mendelian Randomization by Qizhong Lu, Yufan Wu, Qiwei Yu and Jun Ouyang in American Journal of Men's Health
Supplemental Material
sj-xlsx-2-jmh-10.1177_15579883251319125 – Supplemental material for Prognostic Value of Centrosome Replication-Related Genes in Prostate Cancer Based on Transcriptomic and Mendelian Randomization
Supplemental material, sj-xlsx-2-jmh-10.1177_15579883251319125 for Prognostic Value of Centrosome Replication-Related Genes in Prostate Cancer Based on Transcriptomic and Mendelian Randomization by Qizhong Lu, Yufan Wu, Qiwei Yu and Jun Ouyang in American Journal of Men's Health
Supplemental Material
sj-xlsx-3-jmh-10.1177_15579883251319125 – Supplemental material for Prognostic Value of Centrosome Replication-Related Genes in Prostate Cancer Based on Transcriptomic and Mendelian Randomization
Supplemental material, sj-xlsx-3-jmh-10.1177_15579883251319125 for Prognostic Value of Centrosome Replication-Related Genes in Prostate Cancer Based on Transcriptomic and Mendelian Randomization by Qizhong Lu, Yufan Wu, Qiwei Yu and Jun Ouyang in American Journal of Men's Health
Supplemental Material
sj-xlsx-4-jmh-10.1177_15579883251319125 – Supplemental material for Prognostic Value of Centrosome Replication-Related Genes in Prostate Cancer Based on Transcriptomic and Mendelian Randomization
Supplemental material, sj-xlsx-4-jmh-10.1177_15579883251319125 for Prognostic Value of Centrosome Replication-Related Genes in Prostate Cancer Based on Transcriptomic and Mendelian Randomization by Qizhong Lu, Yufan Wu, Qiwei Yu and Jun Ouyang in American Journal of Men's Health
Footnotes
Declaration of Conflicting Interests
The author(s) declared no potential conflicts of interest with respect to the research, authorship, and/or publication of this article.
Funding
The author(s) received no financial support for the research, authorship, and/or publication of this article.
Ethical and Consent Statement
This article does not contain any studies with human participants or animals performed by any of the authors.
Supplemental Material
Supplemental material for this article is available online.
References
Supplementary Material
Please find the following supplemental material available below.
For Open Access articles published under a Creative Commons License, all supplemental material carries the same license as the article it is associated with.
For non-Open Access articles published, all supplemental material carries a non-exclusive license, and permission requests for re-use of supplemental material or any part of supplemental material shall be sent directly to the copyright owner as specified in the copyright notice associated with the article.