
Abstract
Relatively few studies have addressed the risk factors of erectile dysfunction (ED) in Taiwanese— most have described ED and medical problems in the general population. In this study, the cardiovascular risk factors of ED among aborigines in Taiwan were investigated. However, alcohol dependence (AD) was prevalent in Taiwan’s aborigine population. So this study also focused on the relationship among AD, the cardiovascular risk factors and ED. A cross-sectional study was conducted, and data was obtained from a baseline survey of 192 aboriginal adults (35-75 years of age). The participants’ demographic data, AD, markers of endothelial function, serum testosterone, and ED status were assessed. Ninety-four (49%) of the 192 participants had a history of alcoholism and 79 (84%) of those with alcoholism had ED. The study reported that AD and hyperlipidemia, metabolic syndrome (MetS), ED, abnormality of testosterone, and high-sensitivity C-reactive protein are highly prevalent among the aborigines. Factors that may affect ED included age, AD, central obesity, diabetes mellitus, hyperlipidemia, hypertension, MetS, and testosterone. ED is highly prevalent among aborigines with the risk factors of AD, MetS, old age, and abnormal testosterone serum level. MetS, atherosclerosis, and ED are risk factors for cardiovascular diseases. Hence, an increased focus on Taiwanese aborigines with ED is necessary.
Introduction
Erectile dysfunction (ED) can be defined as the inability to achieve or maintain a penile erection sufficient for satisfactory sexual performance (NIH Consensus Conference on Impotence, 1993). Erectile dysfunction is often the first clinical sign of endothelial dysfunction that may precede overt cardiovascular disease (CVD; Costa & Virag, 2009). ED may reduce sexual satisfaction, affect partner relationships and life satisfaction, and cause distress (Lewis et al., 2004). Men with cardiovascular risk factors, such as central obesity, diabetes mellitus, hypertension, hyper- or dys-lipidemia, and metabolic syndrome (MetS) are at a considerably higher risk for ED (Chao et al., 2012; De Ryck, Van Laeken, Apers, & Colebunders, 2013).
A study by Fan revealed that an initiation of alcohol consumption and excessive alcohol consumption during adolescence and early adulthood may be associated with an adverse cardiometabolic profile (Fan, Russell, Stranges, Dorn, & Trevisan, 2008). Testosterone affects libido, sexual potency, and behavior, such as aggressive and sexual. However, one of the crucial clinical effects of alcohol is its effects on the gonads. A number of studies have demonstrated that alcohol-induced reductions in testosterone can theoretically be caused by a stimulatory effect on testosterone catabolism and/or inhibition of its synthesis (Cicero, 1982; Eriksson, Fukunaga, & Lindman, 1994).
Alcohol abusers had considerably low levels of plasma testosterone with low levels of luteinizing hormone and follicle-stimulating hormone. The duration-dependent decrease in the serum testosterone level in alcohol abusers may be caused by increased oxidative stress, which can damage Leydig and supporting Sertoli cells, and impair the hypothalamic–pituitary–gonadal axis (Maneesh, Dutta, Chakrabarti, & Vasudevan, 2006). Excessive drinking can increase the incidence of atherosclerosis; on the other hand, atherosclerosis is considerably associated with CVD (Robinson, Fox, Bullano, & Grand, 2009). Long-term heavy drinking can damage blood vessel endothelial cells (Kaiser et al., 2004), and may increase the chance of developing type II diabetes (Koppes, Dekker, Hendriks, Lex, & Heine, 2005); these are also risk factors for CVD and ED.
A survey of the prevalence of alcohol consumption among Taiwan’s aboriginal population conducted from 1986 to 1988 reported that the prevalence of alcohol-related disorders had increased to 44.5% to 54.5% (Cheng & Chen, 1995). Two studies have addressed ED in Taiwanese aborigines with AD; most have described ED and medical problems in the general population (Chao et al., 2011; Lee et al., 2010). Therefore, this study was focused on that cardiovascular risk factors and alcohol abuse factor for erectile disorder because they are especially prevalent in Taiwan’s aboriginal population. First, the study was interested in the relationship of physical examinations of CVD (or testosterone level) and ED. Second, the study sought to explore the risk factors of ED from these significant factors, like AD and physical examinations of CVD (or testosterone level) and then put these into a multiple logistic regression model. Finally, because AD is a confounding factor in the relationship between physical examinations of CVD (or testosterone level) and ED, this study was interested in testing whether an association exists between physical examinations of CVD (or testosterone level) and AD/ED combinations. This is to whether the differences of physical examinations of CVD (or testosterone level) are significant among participants with/without AD and with/without ED combinations.
Method
Participants
Because 33.4% of Taiwanese aborigines live in eastern Taiwan and this study focused on a sample that was more likely to experience ED, participants for this study were aboriginal men 35 years and older from the local aboriginal community in eastern Taiwan who participated in community health examinations. Participants were eligible if they could read and complete the questionnaire. Exclusion criteria were the use of any androgen therapy or any ED medications during the previous 3 months (7 months for implantable testosterone); any serious medical (like myocardial infarction or heart failure), psychiatric (like schizophrenia), or neurological conditions (other than mild cognitive impairment) that may affect brain structure or cognition; a history of head trauma with loss of consciousness lasting more than 5 minutes; a current or past history of substance abuse or medication, such as antidepressants, that was likely to affect sexual function (especially affecting erectile function); and unwillingness to complete the forms. A psychiatric doctor and research assistants from the psychiatry department examined the participants separately.
Ethical Issues and Procedure
The study protocol was reviewed and approved by Yuli Veterans Hospital Institutional Review Board. Participants were asked to complete the questionnaires and were offered a presentation on sexual behavior terms. The staff distributed the questionnaires and informed the participants that completion of the questionnaire was voluntary and that responses were anonymous and coded by numbers. After completing the questionnaire, the participants were requested to enclose it in the provided envelope. A cover letter described the purpose of the study and emphasized that the information was anonymous.
Measures
Demographic Questionnaire
The questionnaire included 27 items, predominantly multiple-choice. Fourteen demographic and descriptive items, such as the participants’ gender; relationship status, age, educational levels, religion, smoking and drinking habits, CVD history, drug consumption history, awareness of health conditions, and their relationships with partners, were included. The data were gathered by self-reported questionnaires and in-person interviews. The definition of alcoholism used the Diagnostic and Statistical Manual of Mental Disorders, Fourth Edition (DSM-IV) diagnostic criteria (American Psychiatric Association, 1994). Alcohol use disorder was divided into alcohol abuse and AD disorders. In this study, if there were two or more “Yes” answers to the Chinese alcoholism screening questionnaire, then this study will further conduct the DSM-IV criteria for AD. In the psychiatric evaluation a maladaptive pattern of alcohol use leading to clinically significant impairment or distress was determined by three or more occurrence of the following at any time, in the same 12-month period. All participants had to meet for a full diagnosis of AD.
The Chinese CAGE (C-CAGE)
The C-CAGE (Chinese Cut-Annoyed-Guilty-Eye) is an easy-to-use screening instrument (Kuo, Chen, & Cheng, 1999) that helps alert physicians to the drinking problem of a patient. In this regard, self-administered questionnaires are less invasive, cheaper, and more rapid and efficient than biological markers for case identification. For 1-year morbidity, the sensitivity and specificity of the C-CAGE at the optimal cutoff point were 60.0% and 50.4%, respectively (Kuo et al., 1999).
The International Index of Erectile Function
Patients with ED were defined as those who were subjectively unable to achieve or maintain an erection sufficient for sexual intercourse. The international index of erectile function (IIEF-5) scale consists of 5 questions, and assesses global erectile function (Rosen, Cappelleri, Smith, Lipsky, & Pena, 1999). Cronbach’s alpha reliability is .916 for this study. The participants received IIEF-5 assessments to confirm the diagnosis of ED and to evaluate the severity of ED based on the total score. Each item was scored on a 5-point ordinal scale in which lower values represented poorer sexual function. Based on the IIEF-5 score, each patient was classified as having no ED (>21), mild ED (12-21), moderate ED (8-11), or severe (≤7) ED.
The physical Examination and Blood Profiles
Height and weight data for determination of the body mass index (BMI) were gathered by the interviewers. The participants removed their shoes and outer clothing before weight and height measurements were obtained. Technicians obtained waist circumference measure-ments, rounded to the nearest 0.1 cm, from a horizontal plane 2.5 cm above the umbilicus, and subsequently averaged these measurements. BMI was calculated from weight (kg) divided by height squared (m2). The Taiwanese definition of obesity was used in this study. Overweight was defined as BMI ≥ 24 kg/m2, and obesity was defined as BMI ≥ 27 kg/m2 (Chu, 2005). Abdominal obesity was defined as waist circumference ≥90 cm in men. To reduce the differences among participants, blood profiles were obtained after a 12-hour fast, and were stored in a −70°C refrigerator within 4 hours of collection. Samples were sent to a central laboratory for analysis. Total testosterone (TT), free testosterone (FT), bioavailable testosterone (BioT), sex hormone–binding globulin, and high-sensitivity C-reactive protein (hsCRP) were measured using standard laboratory procedures. Normal ranges for serum testosterone are 300 to 1200 ng/dL, and for FT ≥ 7.21 ng/dL (Chandel, Dhindsa, Topiwala, Chaudhuri, & Dandona, 2008). In this study, the age-group between 35 and 74 years was used as the main sample; therefore, abnormal TT was defined as TT < 300 ng/dL, and abnormal FT was defined ad FT < 7.21 ng/dL. The FT level was calculated from TT, sex hormone–binding globulin, and albumin, using the Vermeulen formula. Biochemical markers, such as high-density lipoprotein cholesterol (HDL-C), serum triglyceride (TG) and fasting plasma glucose (FPG), were analyzed using a biochemical autoanalyzer (Beckman Coluter, Lx-20, Brea, CA) at the central laboratory. Fasting blood samples were obtained between 08:00 a.m. and 11:00 a.m. to minimize diurnal variation. The serum levels of testosterone were measured with a solid-phase, competitive, chemiluminescent enzyme immunoassay (IMMULITE 2000 TT, Diagnostic Products Corporation, Los Angeles, CA) at baseline and at the end of the study. The Adult Treatment Panel III of the National Cholesterol Education Program modified for Asians defined MetS as the presence of three or more of the following: fasting plasma glucose ≥110 mg/dL, serum triglycerides ≥150 mg/dL, serum HDL-C <40 mg/dL in men and <50 mg/dL in women, blood pressure ≥130/85 mmHg, or waist circumference >90 cm in men and >80 cm in women (Executive summary of the third report of the National Cholesterol Education Program, 2001).
Data Analyses
The descriptive statistics included the percentages for the categorical variables, and the means and standard deviations for continuous variables. First, the means of the demographic variables in the with/without ED groups were examined using two-sample t tests. Second, the chi-square test was used to examine the association between participants’ ED and AD, testosterone, smoking, drinking, and so on. This study also used sociodemographic factors, MetS, alcoholism, and testosterone to run the simple logistic regression model for predictors of ED after age adjustment. Third, the predictions of some significant variables (like Age, AD, Met S, and FT) were obtained by using forward selection method in multiple logistic regressions. The factors of ED were assessed by odds ratios (ORs) with their 95% confidence intervals (CIs). As usual, AD is claimed to be a confounding factor when AD and physical examination measurements (or testosterone level) are dependent and AD and ED have association. Because the logistic regression model doesn’t mean the response variable and the risk factors are cause-and-effect, this study was interested in the difference of physical examination measurements (or testosterone level) among the groups with/without AD and with/without ED combinations. Hence the Kruskal–Wallis H (K-W H) test was used to test the differences of age (testosterone serum level, or atherosclerosis index hsCRP) among participants with/without AD and with/without ED combinations. The Mann–Whitney U (M-W U) test was used to obtain posthoc results. Then the chi-square test was applied to examine the association between categorical variable and AD/ED combinations. These tests were considered significant if p values (denoted by p) were less than .05.
Results
In all, 34 of the original 226 aboriginal Taiwanese participants did not complete the physical examinations and questionnaires and were excluded, leaving 192 samples (84.9%) for analysis. The average age was 51.54 ± 8.63 years (range 36-74 years), and the mean educational level was 9.70 ± 3.32 years. Ninety-four participants had AD (49.0%) and 98 did not (51.0%); 118 participants had ED (61.5%), of which, 98 had mild ED (51.0%), 13 had moderate ED (6.8%), and 7 had severe ED (3.6%), and 74 (38.5%) did not (Table 1).
Characteristics of the Participants.

Note. IIEF = International Index of Erectile Function; Met S = metabolic syndrome; ED = erectile dysfunction; T = testosterone; SHBG = sex hormone–binding globulin; AD = alcohol dependence.
Alcohol Dependence and Erectile Dysfunction
The means of the quantitative variables for the aborigines with and without ED were evaluated by two-sample t test because each group had a large sample size. The quantitative variables of educational level, BMI, serum total cholesterol, TG, and FPG did not demonstrate considerable differences between participants with and without ED. However, there were considerable differences in age, WC, IIEF-5 scores, serum albumin, TT, Bio T, FT, hsCRP, and HDL-C between participants with and without ED (Table 2).
Differences in Demographic Data and Physical Examination Results Between Subjects With/Without ED.
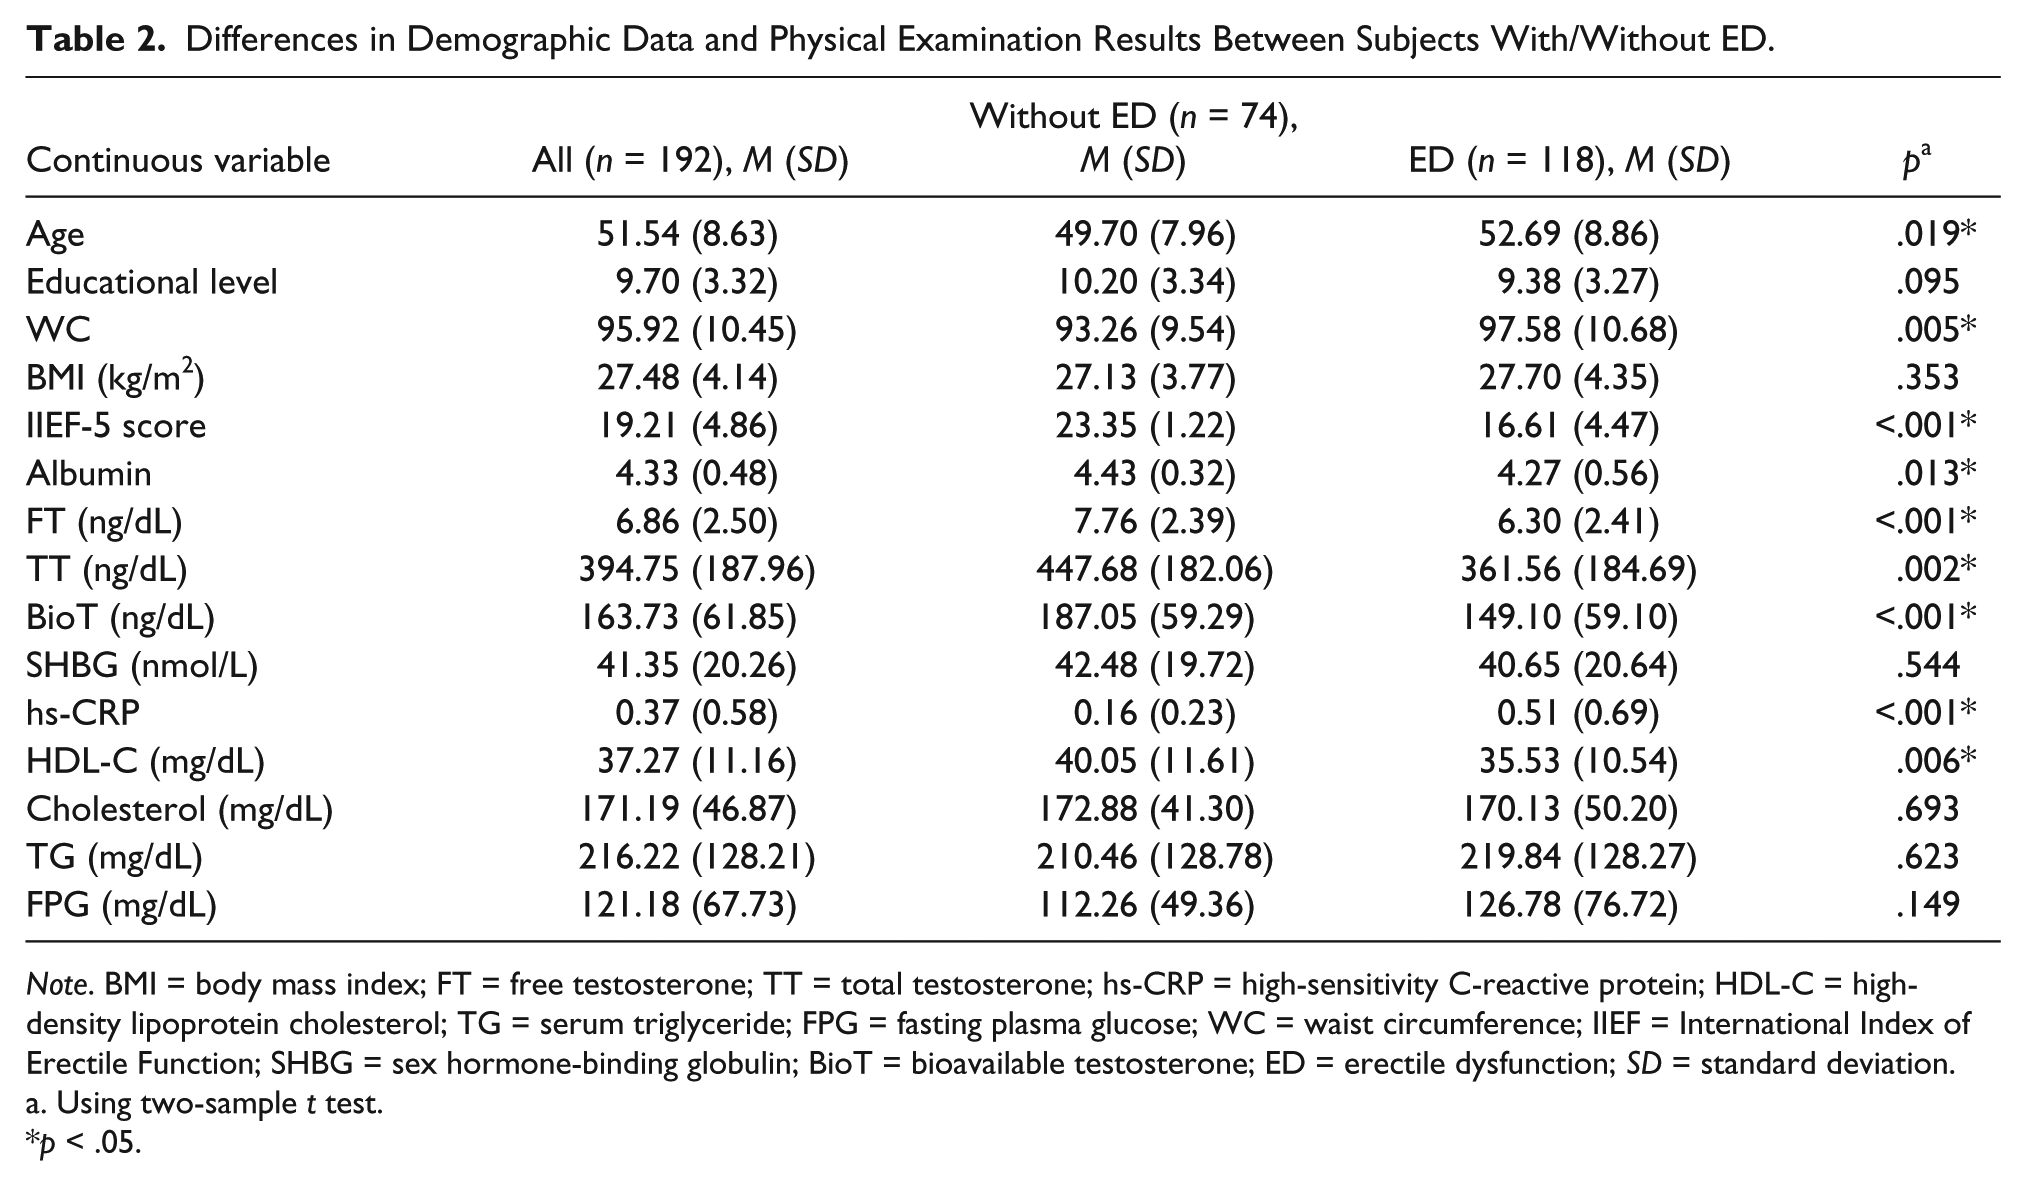
Note. BMI = body mass index; FT = free testosterone; TT = total testosterone; hs-CRP = high-sensitivity C-reactive protein; HDL-C = high-density lipoprotein cholesterol; TG = serum triglyceride; FPG = fasting plasma glucose; WC = waist circumference; IIEF = International Index of Erectile Function; SHBG = sex hormone-binding globulin; BioT = bioavailable testosterone; ED = erectile dysfunction; SD = standard deviation.
Using two-sample t test.
p < .05.
The chi-square test indicated that there were significant differences in the proportions of diabetes mellitus (34.7% vs. 14.9%, p = .003), hypertension (51.7% vs. 23%, p < .001), hyperlipidemia (27.1% vs 10.8%, p = .007), MetS (83.1% vs. 37.8%, p < .001), AD (66.9% vs. 20.3%, p < .001), TT (47.5% vs. 21.6%, p < .001), FT (66.1% vs. 31.1%, p < .001) and hsCRP (23.7% vs 2.7%, p < .001) exhibited considerable differences between participants with and without ED (Table 3).
Chi-Square Test Used With Categorical Demographic Data and Physical Examination Results of Subjects With/Without ED.

Note. FT = Free T Abnormal: ≤ 7.21 ng/dL; TT = Total T Abnormal: > 300 ng/dL; hs-CRP = high-sensitivity C-reactive protein (abnormal >1.0 ng/dL); AD = alcohol dependence; WC = waist circumference; ED = erectile dysfunction; DM = diabetes mellitus; FT = free testostereone; TT = total testosterone; Met S = metabolic syndrome.
p < .05.
Analysis of Risk Factors for ED in Aborigines Using Simple Logistic Regression
After adjusting the age variable, simple logistic regression was used to analyze the risk factors and ORs of the participants for ED. After adjusting the age, the results of simple logistic regression analysis indicated that the AD OR was 9.76 (95% CI: 1.01-1.08), the abdominal obesity OR was 2.02 (95% CI: 1.02-4.03), the DM OR was 2.93 (95% CI: 1.38-6.21), the hyperlipidemia OR was 2.82 (95% CI: 1.21-6.59), the hypertension OR was 3.18 (95% CI: 1.61-6.28), the MetS OR was 7.60 (95% CI: 3.86-14.97), the abnormal TT OR was 3.18 (95% CI: 1.63-6.20), the FT abnormalities OR was 3.99 (95% CI: 2.12-7.50), and abnormal hsCRP OR was 11.72 (95% CI: 2.67~51.35; Table 4).
Simple Logistic Regression Analysis of Variables Related to ED After Adjustment of Age.

Note. hs-CRP = high-sensitivity C-reactive protein; AD = alcohol dependence; WC = waist circumference; ED = erectile dysfunction; DM = diabetes mellitus; FT = free testostereone; TT = total testosterone; Met S = metabolic syndrome; ED = erectile dysfunction; HDL-C = high-density lipoprotein.
p < .05.
The risk factors for ED of the aborigines were analyzed using a multiple logistic regression model. This study used FT, age, MetS, and AD to run the model for predictors of ED, and the analysis indicated a considerable difference for FT (OR = 0.85, 95% CI: 0.72-0.96, p < .05), age (OR = 1.05, 95% CI: 1.00-1.09, p < .05), MetS (OR = 6.24, 95% CI: 2.86-13.61, p < .001) and AD (OR = 8.47, 95% CI: 3.81-18.83, p < .001; Table 5).
Multiple Logistic Regression Model for Predictors of ED.

Note. AD = alcohol dependence; FT = free testosterone; Met S = metabolic syndrome.
p < .05.
The sensitivity is the proportions of true positives out of the total actual positives. The specificity is the proportions of true negatives out of the total actual negatives. The positive predictive value is the proportions of true positives out of the total predicted positives. The negative predictive value is the proportions of true negatives out of the total predicted negatives. The receiver operating characteristic (ROC) curve is a plot of sensitivity in vertical axis versus 1 − specificity in horizontal axis at various threshold settings. An area under ROC curve can be used as the accuracy of a predicted model. A completely random guess would give the area under ROC curve 0.5. If we set 0.6 to be a cut probability to predict ED in the multiple logistic regression model of Table 5, the true positives and the true negatives are 95 and 54, respectively. In this study, the number of ED and the number of no ED are 118 and 74. Hence, the sensitivity, specificity, positive protective value, and negative predictive value are 0.805, 0.730, 0.826, and 0.701 respectively. If we use various cut probability to predict ED, the area under ROC curve is 0.853 ± 0.029 (p < .001), and the 95% CI is (0.797, 0.909). It represents the multiple logistic regression model of Table 5 is credible.
The participants in this study were divided into a normal control group (NH), non-AD with ED group (NE), AD without ED group (AH), and AD with ED group (AE). The age, TT, FT, and BioT among the 4 groups differed substantially. Age (NH: 50.29 ± 8.37, NE:55.21 ± 9.63, AH:47.40 ± 5.76, AE:51.44 ± 8.24, p = .017) was considerably higher in the NE group than that in the NH group and the AH group. Serum BioT (p < .001) in the NH group was considerably higher than that in the NE group and AE group. Serum TT (p = .001) in the NH group was considerably higher than that in the AE group and NE group, and serum FT (p < .001) in the NH group was considerably higher than that in the NE group and AE group. The chi-square test indicated that there were significant associations (p < .05) on smoking, obesity, DM, hypertension, hyperlipidemia, and Met S in these four groups (Table 6).
Mean Comparison of Educational Level, Age, and Sex Hormones Among the Groups With/Without AD and With/Without ED Combinations.

Note. Normal health = NH; Normal with ED = NE; AD without ED = AH; AD with ED = AE; ED = erectile dysfunction; Met S = metabolic syndrome; DM = diabetes mellitus; FT = free testosterone; TT = total testosterone; SHBG = sex hormone–binding globulin; T = testosterone.
Using Kruskal–Wallis H test.
p < .05.
Discussion
In this study, aborigines from eastern Taiwan were divided into two groups, those with and without ED. In the two groups, hsCRP was an indicator of atherosclerosis, MetS and its composition of factors, and FT was a related indicator in exploring ED risk factors and aboriginal AD relevance. 118 participants (61.5%) had ED and 74 (38.5%) did not, and 79 (84%) had ED with AD. Previous studies indicated that AD and ED can lead to decreased sexual satisfaction, a deterioration of relations between partners, and a reduced quality of life (Fugl-Meyer et al., 2009; Lewis et al., 2004).
In this study, analysis of various risk factors and ORs of ED was conducted using simple logistic regression after adjusting for age. Aborigines with AD had a 9.76-fold higher incidence of ED than those without AD; this result was higher than that of the Martin–Morales study (1.53-fold) and of Lee’s survey in Hong Kong (2.27-fold; Lee et al., 2010; Martin-Morales et al., 2001). In addition, the results of this study indicated that central obesity is associated with ED, and is an independent risk factor for ED. Riedner, Rhoden, Ribeiro, and Fuchs (2006) reported that in men, a waist circumference of more than 94 cm is considered a risk factor for cardiovascular events and is associated with ED. The current study had similar results. Grover indicated that DM is independently associated with ED (Grover et al., 2006), similar to the results of this study. However, the same study also indicated that the risk of ED in participants with MetS was 1.45 times higher than in those without MetS, which was lower than the results of this study. For hypertension and ED, Kushiro et al. (2005) indicated that the risk of ED was approximately 1.7 times higher in patients with hypertension than in those in the normal control group, lower than that of the current study. Rao’s data suggested that hyperlipidemia is one of the risk factors leading to ED, a common disorder in men, especially in old men (Rao, Du, & Yang, 2006); however, our study results also indicated that the risk of ED was 2.82-fold higher in participants with high blood cholesterol than in those in the normal control group. This result revealed a greater risk of ED than that of Martin-Morales et al.’s (2001) study, which indicated that the risk of ED was 1.63-fold higher in patients with high blood cholesterol than in those without. Grover et al. (2006) evaluated the effect of various cardiovascular risk factors on ED in a primary care setting, and reported that ED was identified in 49.4% of participants, based on a score of less than 26 on the IIEF-EF domain in a cross-sectional survey of 3,921 Canadian men. The presence of diabetes (OR = 3.13), undiagnosed hyperglycemia (OR = 1.46), impaired fasting glucose (OR = 1.26), and MetS (OR = 1.45) were identified as independent risk factors for ED (Kushiro et al., 2005). These factors were similar to those in the current study. In addition, research also revealed that aboriginal participants with abnormal TT and FT had a risk of ED that was approximately 3 times higher than that of the general population, similar to the results of previous studies (Kratzik, Schatzl, Lunglmayr, Rucklinger, & Huber, 2005).
Aboriginals of Erectile Dysfunction and Related Factors
This study indicated that the aboriginal participants with a history of AD, abnormal TT, and MetS exhibited a considerably higher prevalence of ED than the general population. In particular, our results indicated that MetS and AD are related to erectile function, to a greater extent than in previous studies (Chao et al., 2012). In addition, the concentration of FT was negatively correlated with ED, which is also similar to the results of previous studies (Martin-Morales et al., 2001). This study supports the notion that MetS, AD, and serum testosterone may provide warning signs, and is simultaneously an opportunity for early intervention in men who are otherwise considered at lower risk for ED and subsequent CVD.
This study has several limitations. First, this was a cross-sectional study, and was conducted in the local aboriginal community in eastern Taiwan. Thus, the findings may not be generalizable. Second, bias introduced by underreporting is possible, because sexual behavior is a sensitive issue, and the topic may be considered socially unacceptable, especially in ethnic Chinese cultural settings. In addition, the participants completed anonymous self-administered questionnaires and surveys by number are coded to ensure privacy; therefore, the data may be biased. Third, the samples were not retained to avoid storage at room temperature for a long period; the participants fasted for 8 to 10 hours before blood tests to reduce the differences between all participants. Collected specimens were placed in an ice bucket at 4°C for delivery to avoid deterioration, and samples were stored in a −30°C refrigerator within 4 hours after repackaging. To ensure the stability and reliability of the tests, every test had 25 to 30 standard samples and the analysis showed the coefficients of variation were less than 10% for all samples; therefore, this study can exclude that any errors in sample measurement (measurement of biomarkers) may have affected the result. Finally, in this study, the participants were all aboriginal Taiwanese males; no matched nonaboriginal males were included. Thus, our data could not verify whether an aboriginal male would have a greater risk of ED than a nonaboriginal male with a given degree of AD. Future studies should include aboriginal and nonaboriginal participants.
Conclusion
A strong association was discovered among AD, MetS, age, FT, and ED. Our results also demonstrate that AD, MetS, TT, BioT, FT, and indicators of atherosclerosis are associated with ED in indigenous people. However, MetS, atherosclerosis, and ED are all indicators of CVD (Glina, Sharlip, & Hellstrom, 2013). The study also showed that sex hormones (FT, TT, and BioT) in aborigines with AD were substantially lower than in those without AD. Future studies must address whether abnormal sex hormones are caused directly by alcohol, MetS, atherosclerosis, and diabetes. Moreover, alcoholism, MetS, and abnormal sex hormones in aboriginal Taiwanese may provide warning signs, and should be the focus of physicians with respect to ED and CVD prophylaxis.
Footnotes
Acknowledgements
Authors wish to thank the psychiatric staffs for their help with this study.
Declaration of Conflicting Interests
The author(s) declared no potential conflicts of interest with respect of the research, authorship, and/or publication of this article.
Funding
The author(s) received no financial support for the research, authorship, and/or publication of this article.