
Abstract
The objective of this study was to evaluate zonal and state-wise prevalence and risk factors of undernutrition among Indian men in the age-group of 15 to 54 years based on sampled data of 74,369 respondents from the National Family Health Survey-3. A common anthropometric measure, body mass index, is used to determine the prevalence as it is considered to be a good measure of undernutrition. Overall, 28.6% (SE = 0.17%) of Indian men are classified as underweight, and 52.5% (SE = 0.62%) of the younger age-group (15-19 years) are underweight. The highest prevalence of underweight men in Indian states is observed in Tripura (39.8%; SE = 1.85%), followed by Rajasthan (39.3%; SE = 1.28%), Chhattisgarh (37.2%; SE = 1.3%), and Gujarat (35.7%; SE = 1.3%). The highest and lowest prevalence among zones are reported for central (34.5%; SE = 0.39%) and northeast (18%; SE = 0.34%) zones, respectively. The bivariate analysis using chi-square test concludes the significant association (p < .001) between the body mass index groups and each of the explanatory variable. Significant difference (p ≤ .002) is reported in the mean heights of underweight and non–underweight men among four out of six zones of India. From multivariate logistic regression analysis, we observed that for India as a whole, men with no education, low/medium standard of living, and the younger age-group (15-19 years) have significantly (p < .001) higher chances of being underweight. We also observed similar results for many Indian states at different significance levels. In conclusion, the distribution of underweight in India remains segregated by socioeconomic status.
Undernutrition leads to malnutrition. The prevalence and distribution of malnutrition in a society have implications for public health outcomes and policy formulation. Body mass index (BMI) provides an indication of nutritional status. The BMI is the ratio of weight in kilograms to the square of the height in meters (kg/m2). The World Health Organization (WHO; 1995) has recommended that BMI could be used to assess the nutritional and health status of adults. According to the WHO (2004) and modified guidelines given by Health Ministry of India jointly with Indian Council of Medical Research, the range for normal BMI is between 18.5 and 23 for the Indian population. A person with BMI less than 18.5 is considered as underweight, BMI between 23 and 24.99 as overweight, and BMI equal to 25 or above as obese. Low BMI (below 18.5) is an indicator of chronic energy deficiency, which negatively affects physical work capacity, productivity, and is associated with increased risk of morbidity and mortality (Shetty & James, 1994) and diseases like anemia, blindness, rickets, beriberi, and low stamina and immunity. Overweight and obesity are also measured by BMI. Although there are several techniques available to study nutritional status (Lee & Nieman, 2003), it has been well established that anthropometry is best suited to assess the nutritional and health status of an adults, especially in field surveys (WHO, 1995). BMI is an indicator of overall adiposity (Bose, 1996). A low BMI and high level of undernutrition (based on BMI) is a major public health problem, especially among rural underprivileged adults of developing countries (WHO, 1995). Here we note that though BMI provides good indication of nutritional status, it is an imperfect measure. But BMI is most widely used to evaluate nutritional status because its use is inexpensive, noninvasive, and suitable for large-scale surveys (Ferro-Luzzi, Sette, Franklin, & James, 1992; James et al., 1994; Lee & Nieman, 2003; Lohman, Robhe, & Martorell, 1988). BMI is generally considered a good indicator of not only nutritional status but also the socioeconomic condition of a population, especially adult population of developing countries (Ferro-Luzzi et al., 1992; Khongsdier, 2002; Mosha, 2003; Nube, Asenso-Okyere, & van den Bloom, 1998; Shetty & James, 1994).
Many research studies are carried out on evaluation of status of undernutrition among Indian women and were focused on some specific states of India (Griffiths & Bentley, 2001 [for Andhra Pradesh]; Patil, 2012 [for Karnataka]; Ramesh & Jareena, 2009 [for Kerala]), with few studies looking at multistate BMI levels. Chockalingam et al. (2011) analyzed a sample of 118,734 women from India based on the National Family Health Survey-3 (NFHS-3), with multiple categories of BMI (underweight, normal weight, overweight, obese). Chockalingam et al. (2011) reported that the female respondents, who were married, employed, and having higher level of education had a lower prevalence of undernutrition.
Hazarika, Saikia, and Hazarika (2012) assessed the risk factors of undernutrition among Indian women in the reproductive age-group of 15 to 49 based on NFHS-3. Hazarika et al. reported that the standard of living and age of women were the more prominent risk factors of undernutrition among women along with other factors such as religion, caste, and education. Sengupta and Syamala (2012) studied the changing face of malnutrition in India by analyzing the NFHS-2 and NFHS-3 data to assess the levels and trends of malnutrition among women (both underweight as well as overweight) in India and its states. Sengupta and Syamala reported that underweight in India was a problem that cuts across all social and economic categories, whereas being overweight or obese was a problem of the wealthier, urban women.
In this study, the prevalence and risk factors of undernutrition in Indian men based on sampled data from NFHS-3 is evaluated. This study is fully focused on Indian men as similar studies for Indian women are reported in the literature as discussed above. To avoid duplication, the analysis of women’s study is not reported in this article.
The results of this study may be useful while planning preventive health care programs or intervention programs to create awareness for improving Indian men’s nutritional status. The intervention programs currently practiced in India make use of media like television, radio, electronic print, outdoor and digital media besides the traditional methods of folk and field publicity. Well-known personalities such as film stars and sport persons are involved in the massive drive to generate awareness about the alarming consequences of malnutrition.
Model and Methodology
Sample Selection Under NFHS-3
The NFHS program, started in the early 1990s, is a nationally important source of data on population, health, and nutrition for India and its states. The NFHS program was initiated by the Ministry of Health and Family Welfare, Government of India. So far three rounds of NFHS have been conducted, namely, NFHS-1, NFHS-2, and NFHS-3. These are nationwide surveys conducted with a representative sample of households throughout the country. In NFHS-1 and NFHS-2, data were collected on women only. The NFHS-3 is a result of the collaborative effort of the International Institute for Population Sciences (IIPS), which acted as the nodal center, and other organizations, including 18 population research centers of the Ministry of the Health and Family Welfare of the Government of India (IIPS, 2007). This survey has provided information on fertility, mortality, family planning, and important aspects of nutrition, health, and health care for men and women. A uniform sample design was adopted in all the states. The sample from rural area was selected in two stages in each state. At the first stage, villages were selected according to probability proportional to population size (PPS), and then a random selection of households within each village was made. In urban areas, the samples were selected in three stages: wards, census enumeration blocks, and households. Wards were selected using the PPS, whereas blocks and households were chosen using a simple random sampling. The NFHS-3 covers representative samples of 124,385 women from the age-group 15 to 49 and 74,369 men from the age-group 15 to 54, from 29 states in India. These 29 states represent over 99% of population of India. This study is focused only on men’s data. In the present analysis, the number of missing cases reported out of 74,369 respondents of the NFHS-3 are the following: for BMI, 5,141; residence, 0; religion, 41; caste, 28; education, 31; standard of living, 0; and age, 0. After removing missing cases under different variables of interest, the sample size of men reduced to 69,209 from 74,369. The survey interviewed men of age groups 15 to 54, and interviews were conducted in one of the 18 Indian languages along with English language in respondents’ homes with a 84.9% response rate (IIPS, 2007).
Response Variable
For this study, BMI was considered as response variable and based on the values of BMI, individuals were classified as underweight (BMI < 18.50), normal weight (18.5 ≤ BMI < 22.9), overweight (22.9 ≤ BMI < 24.9), and obese (BMI ≥ 25). These BMI ranges were used to study the association of BMI with various explanatory variables. Also, in order to assess the impact of various socioeconomic factors on the prevalence of undernutrition, we have used nutritional status as the binary dependent variable. Two categories of nutritional status are underweight (UW) and non–underweight (NUW). Men with BMI < 18.5 are classified as UW, and men with BMI ≥ 18.5 are classified as NUW.
Explanatory Variables
This study considered some socioeconomic and demographic variables as explanatory variables. These variables are age, formal educational level, religion, caste, type of residence, and standard of living index of the household of each respondent. These variables were also considered by researchers such as Hazarika et al. (2012) who studied women’s data.
Age-Group
In the NFHS-3, men with ages between 15 and 54 years were interviewed. The age-groups considered for this analysis were 15 to 19, 20 to 34, and 35 to 54.
Education
Men’s educational status was grouped into four categories: no education (less than 1 year of education), primary (1-5 years of education), secondary (6-12 years of education), and higher (more than 12 years of education).
Religion
The religions of men considered were Hindu, Muslim, Christian, and other. The other religion includes Sikh, Buddhist/Neo-Buddhist, Jain, Jewish, Parsi/Zoroastrian, Donyi polo, and any other. This variable is included in the model/analysis as religious practices of Indian men in terms of fast days/months and food habits vary according to their religions.
Types of Caste or Tribe
Types of caste or tribe considered are scheduled caste (SC), scheduled tribe (ST), other backward class (OBC); and others are considered in the general caste category. The SC and ST are two groups of historically disadvantaged people recognized in the constitution of India. SC represents the members who have suffered from greatest burden of deprivation within the caste system (Chitnis, 1997). SC consists of castes that are lowest in the traditional Hindu caste hierarchy (Chitnis, 1997). ST includes approximately 700 officially recognized social groups that have historically been geographically and socially isolated and represent the “indigenous” groups in India (Subramanian, Davey Smith, & Subramanyam, 2006). OBC is a legislatively defined group representing those who have historically suffered significant deprivation but not as severe as SC and ST. The general class includes men from residual caste category containing those not identifying themselves as members of legislatively recognized marginalized classes and constitutes the “high” caste group.
Place of Residence
The place of residence of the respondent is classified as rural and urban according to the household in which they resided.
Information from the 2001 Indian National Census was used to create categories defining whether each household was in urban area or rural area as follows.
An urban area has been defined as follows:
All places with municipality, corporation, cantonment board, or notified town area
All other places that satisfy the following criteria:
A minimum population of 5,000
At least 75% of male working population engaged in nonagricultural pursuits
A density of population of at least 400 persons per square kilometer
Rural Areas
All areas that are not categorized as urban area are considered as rural area.
Standard of Living Index (SLI)
SLI was constructed from a set of proxy indicators: house type, availability of water on the premises, toilet facility in the household, electricity, fuel for cooking, ownership of house, ownership of agricultural land, and possession of consumer durables (such as tractor, scooter, motorcycle, bicycle, electric fan, radio, TV, water pump, mattress, cot, and table). Each item was assigned a score ranging from 0 to 4. These scores were then summed and the result measured against a static set of SLI cutoffs. A SLI of 0 to 14 was considered low, 15 to 24 as medium, and 25 and above as high (IIPS, 2007). A weak positive correlation between two variables, formal education level and SLI (correlation coefficient = .34), was observed. Hence, both variables were considered for this study.
Statistical Methods
For analysis of survey data, both bivariate and multivariate analyzes were carried out. In bivariate analysis, the chi-square test was employed to check the association between each of the explanatory variables and the nutritional status of men. The chi-square test in bivariate analysis does not consider confounding effects. Therefore, multivariate analysis was used to examine the net effect of each explanatory variable on undernutrition of men, while controlling for the other explanatory variables. Logistic regression model was used to identify and compare the factors associated with men being underweight. The effect of one variable on the prevalence of undernutrition is likely to be confounded with effects of other variables. Therefore, socioeconomic, demographic characteristics were controlled statistically. The variables included in the model were age, religion, standard of living, caste, education, and type of residence. Since in the present analysis, the dependent (response) variable was dichotomous in nature (man was underweight or not), binary logistic regression was an appropriate technique to assess the influence of explanatory variables on the dependent variable. The logistic regression model was run separately for data on men for overall India, zone-wise, and each state-wise. SPSS and MINITAB software were used for analysis.
Results
From descriptive analysis, we observed that BMI of 28.6% (SE = 0.17%) of the total 69,209 men was lower than 18.5 and were classified as underweight in this study. Distribution of the underweight for overall India, for its zones, and its states is presented in Table 1. Tripura has the highest number (39.8%, SE = 1.85%) of men who are underweight, followed by Rajasthan (39.3%, SE = 1.27%), Chhattisgarh (37.2%, SE = 1.3%), and Gujarat (35.7%, SE = 1.28%). In the northeast zone, 18% (SE = 0.34%) of men are underweight, which is the lowest in all zones (north zone 27.6%, SE = 0.51%; central zone 34.5%, SE = 0.39%; east zone 32.5%, SE = 0.59%; west zone 31.9%, SE = 0.46%; south zone 28.2%, SE = 0.33%) of India.
Distribution of Men Aged 15 to 54 Years According to Their Value of BMI.

Note. BMI = body mass index.
The results of chi-square test revealed the significant (p < .001) association between the BMI groups and each of the explanatory variables (see Table 2). From Table 2, we observe that overall 28.6% (SE = 0.17%) of men in India are underweight, but the prevalence of underweight is considerably higher under some characteristics for men such as 33.6% (SE = 0.49%) for rural area, 30.5% (SE = 0.37%) for Hindu religion, 34.7% (SE = 0.74%) for SC caste, 36.0% (SE = 0.80%) for no education category, 42.1% (SE = 0.59%) for low standard of living, and 52.5% (SE = .62%) for younger age-group (15-19 years).
Distribution of Men Aged 15 to 54 years, According to Selected Background Characteristics.
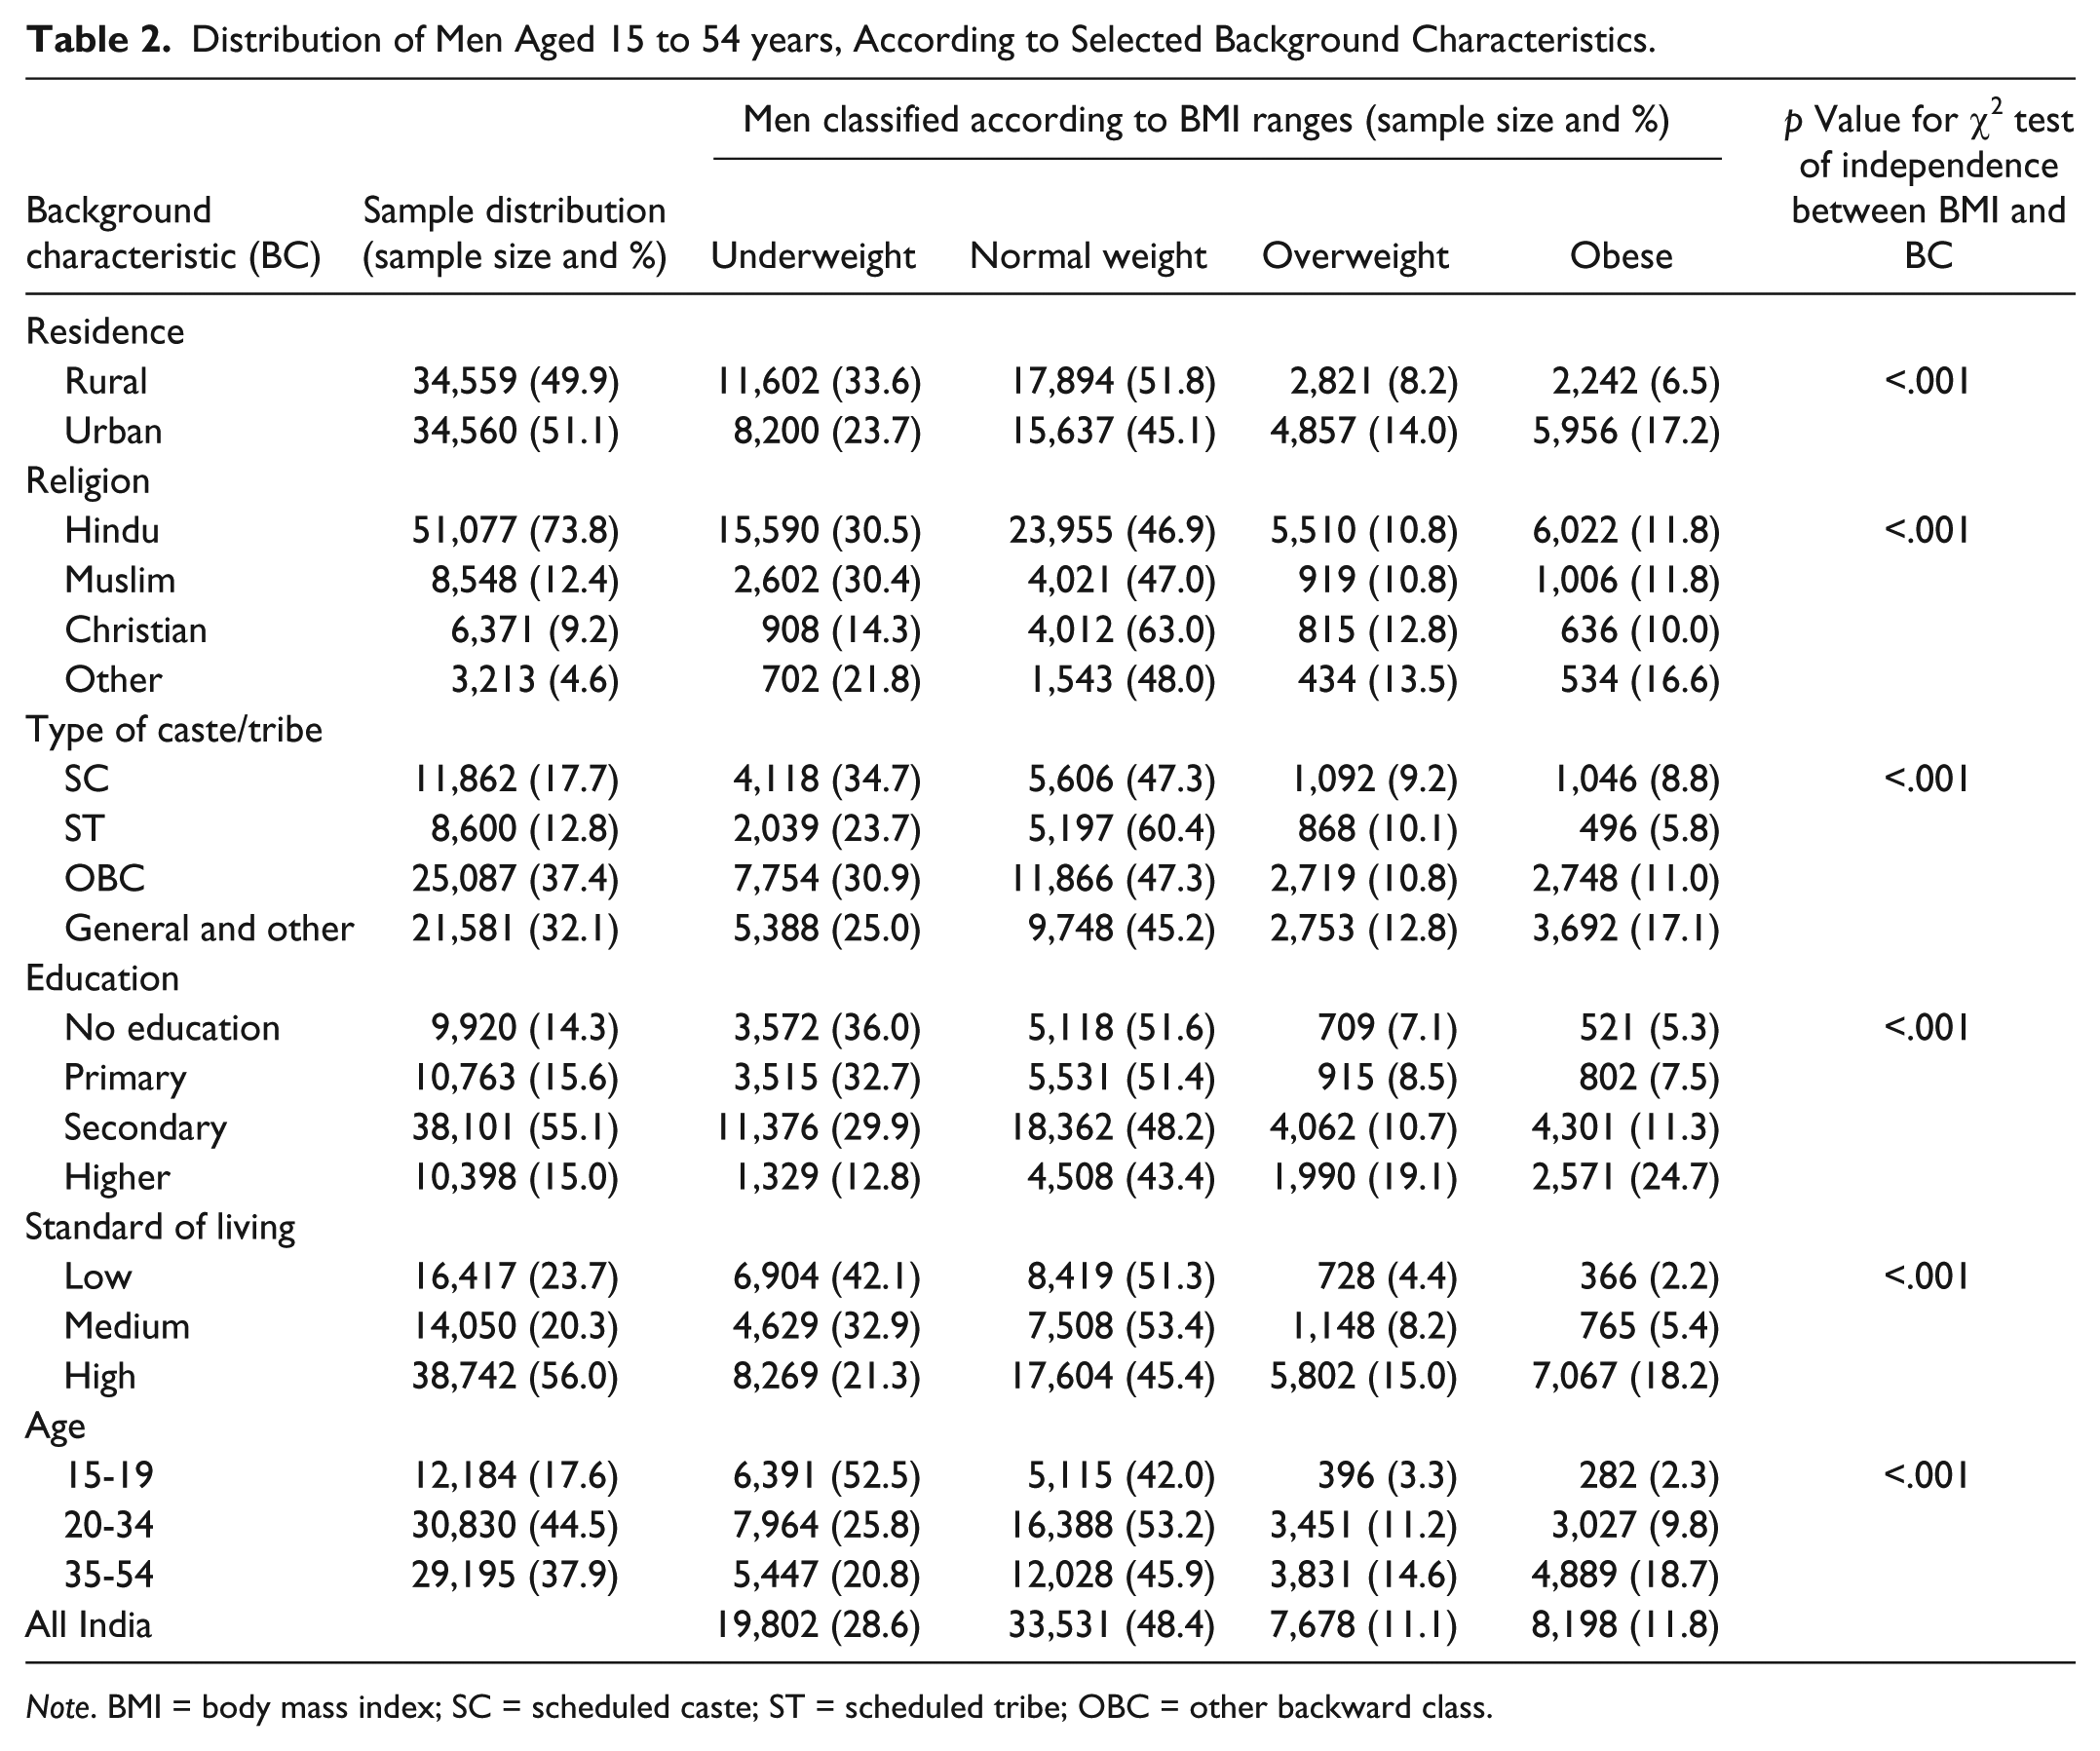
Note. BMI = body mass index; SC = scheduled caste; ST = scheduled tribe; OBC = other backward class.
Multiple logistic regression analysis was carried out to quantify the net effects of the background factors on the dependent variable, and the results are presented in Table 3. These results are obtained by applying the logistic regression model separately for India as a whole, zone-wise, and state-wise. The results are reported in terms of odds ratio (OR) and its 95% confidence interval (CI) for the background characteristics. The significance of ORs are represented by superscripted *, **, and ***, respectively, for .001, .01, and .1 levels of significance. The findings revealed that age, standard of living, and education are the major risk factors for undernutrition among men. However, the other factors such as religion and caste also have influence on the status of undernutrition. In Table 3, we have reported the findings of our study according to the separate risk factors for undernutrition. In the following, the results separate risk factors are discussed.
Results of Logistic Regression Analysis in Odds Ratio (OR) and Their 95% Confidence Interval (CI).

Note. NA = Not applicable as sample size is too small to calculate. Reference categories for different variables: (a)35-54; (b)Hindu; (c)High; (d)General and other; (e)No education; (f)Urban.
Significant at α = .001 level of significance (p < .001). **Significant at α = .01 level of significance (p < .01). ***Significant at α = .1 level of significance (p < .1).
Age (Reference Category: 35-54 Years)
Indian men in the age-groups 15 to 19 years (OR = 4.85, CI = 4.60-5.10) and 20 to 34 years (OR = 1.47, CI = 1.41-1.53) are more likely to be undernourished as compared to men in the age-group 35 to 54. Indian men in the age-groups 15 to 19 and 20 to 34 are, respectively, 4.85 and 1.47 times more likely to be undernourished than those in the age-group 35 to 54. In all zones as well as 29 states of India, ORs have reported significance (p < .001) for being underweight in the age-group 15 to 19 years as compared to age-group 35 to 54. Severe differences are reported for the age-group 15 to 19 in the states Himachal Pradesh (OR = 8.77, CI = 5.75-13.39) and Tamil Nadu (OR = 8.72, CI = 7.14-10.65) followed by Kerala (OR = 7.69, CI = 4.73-12.49) and Andhra Pradesh (OR = 6.93, CI = 5.80-8.28). According to zone-wise analysis, south zone (OR = 7.30, CI = 6.56-8.14) and west zone (OR = 6.79, CI = 5.94-7.98) are more affected in this regard for the age-group 15 to 19 years.
Standard of Living (Reference Category: High)
Indian men with low and medium standard of living are more likely to be affected by undernutrition as compared to men with high standard of living. Indian men having low SLI are 2.18 times (OR = 2.18, CI = 2.07-2.30) and 1.56 times (OR = 1.56, CI = 1.49-1.65) more likely to be undernourished than the men with high and medium SLI, respectively. From Table 3, we observed that men with low and medium SLI are significantly more likely to be undernourished as compared to men with high SLI in 21 and 20 numbers of states of India, respectively. The state Tripura (OR [low] = 7.75, CI = 4.12-14.59; OR [medium] =4.43, CI = 2.59-7.59) is more influencing among all the states in this regard. Also, men with low standard of living from south zone (OR = 2.54, CI = 2.28-2.84) and west zone (OR = 2.23, CI = 1.91-2.61) are major suffering zones toward undernutrition.
Caste (Reference Category: General and Other)
Indian men belonging to caste categories SC (OR = 1.21, CI = 1.15-1.28) and OBC (OR = 1.13, CI = 1.08-1.18) are more likely to suffer from undernutrition than the general and other caste categories of men. Men from SC, ST, and OBC caste categories are more likely to be undernourished than men from general and other caste in 8, 6, and 9 numbers of states of India, respectively. But in 2, 5, and 3 numbers of states of India, men from SC, ST, and OBC are less likely to be undernourished, respectively. Men in ST caste category from west and north zones are 1.47 (CI = 1.25-1.75) and 1.94 (CI = 1.51-2.51) times more likely to be undernourished, respectively, as compared to general and other category. According to state-wise analysis, in Rajasthan, ST category is about 2.45 (OR = 2.45, CI = 1.57-3.82) times more likely to suffer from undernutrition as compared to general and other category.
Religion (Reference Category: Hindu)
Indian men from Christian (OR = 0.36, CI = 0.33-0.39) religion and men from other (except Hindu, Muslim, and Christian) religions (OR = 0.73, CI = 0.67-0.81) are significantly less likely to be undernourished than the men from Hindu religion. In Andhra Pradesh, men from Muslim religion (OR = 1.36, CI = 1.13-1.64) are significantly more likely to be undernourished than the men from Hindu religion.
Education (Reference Category: No Education)
In India, educated men are significantly less likely to be undernourished than uneducated men (OR [primary] = 0.89, CI = 0.83-0.94; OR [secondary] = 0.77, CI = 0.73-0.81; OR [higher] = 0.43, CI = 0.39-0.46). In fact, it is also observed that values of ORs are decreasing from low level of education to high level of education throughout the country. Men educated up to higher, secondary, and primary levels are significantly less likely to be undernourished than the uneducated men in 23, 12, and 3 numbers of Indian states, respectively. But it is also observed that only for the state of Punjab men with primary education are 1.85 times more likely to be undernourished than uneducated men.
Type of Residence (Reference Category: Urban)
The rural men (OR = 1.13, CI = 1.09-1.18) are significantly more likely to be undernourished than urban men. Significant (p < .001) undernutritional status is reported in men from rural area of four zones: north (OR = 1.46, CI = 1.29-1.67), central (OR = 1.22, CI = 1.11-1.36), east (OR = 1.20, CI = 1.04-1.40), and south (OR = 1.22, CI = 1.12-1.33). Among the Indian states, the two most suffering states where rural men are more likely to be undernourished than their urban counterparts are Sikkim (OR = 2.1, CI = 1.16-3.80) and Jammu and Kashmir (OR = 1.85, CI = 1.14-3.01), whereas in the states Tripura (OR = 0.60, CI = 0.38-0.95) and Meghalaya (OR = 0.67, CI = 0.37-1.21) men from rural area are less likely to be undernourished than urban men. In 13 Indian states, rural men are significantly more likely to be undernourished than urban men, and in 6 states, rural men are significantly less likely to be undernourished than urban men. These states are Bihar, Arunachal Pradesh, Nagaland, Tripura, Meghalaya, and Assam. Out of these six states except Bihar, the other five states are from the northeast zone of India.
Test of Equality of Mean Height of Two Groups (Underweight and Non–Underweight)
We have obtained descriptive statistics for the variables height and weight. The t test for the equality of mean height for these two groups is carried out for all zones of India, and the results are reported in Table 4. We observed for UW group, mean height = 164.26 cm, with SD = 7.08, and coefficient of variation CV = 4.31%, and for NUW group, mean height = 164.51 cm, with SD = 6.81, and coefficient of variation CV = 4.13%. We conclude from p values of tests for equality of mean height of two groups UW and NUW that they differ significantly for four zones of India, namely, east (p ≤ .002), west (p < .001), central (p < .001), and south (p < .001). But we observed that there is no significant difference in mean heights of these two groups, UW and NUW, in the north (p = .514) and northeast (p = .454) zones of India. We note that for all Indian men there is significant difference between mean weights of Indian men of two groups UW and NUW. Also, we note that for all Indian men difference between mean height of Indian men of UW and NUW is 0.0363 times of pooled SD (6.8883) of these two groups, but the difference between mean weight of UW and NUW is 1.5592 times of pooled SD (9.0269) of these two groups. As these two groups, UW and NUW, are classified on the basis of men’s BMI values and for these two groups difference in the means in terms of SD unit is high for weight than height, we conclude that weight distinguished two groups better than height. This may also be commonly observed from the fact that weight of a person may vary throughout the life but height remains constant after attainting a particular age.
Zone-Wise Descriptive Statistics of Height (cm) and Weight (kg) and Test of Equality of Mean Height for Two Groups.

Note. UW = underweight; NUW = non–underweight; Q1 = first quartile; Q2 = second quartile; Q3 = third quartile; Min = minimum; Max = maximum.
Conclusion and Discussion
In the following, we report some major conclusions and observations followed by discussion. For details of prevalence percentage, SE, 95% confidence intervals, and significance level, we refer the results reported in the previous section and Tables 1 to 4. Discussion is also provided on intervention programs to improve nutritional status in India.
Age, standard of living, and education level are prominent risk factors of undernutrition among Indian men. Hazarika et al. (2012) had also reported these risk factors for undernutritional status of Indian women.
The risk of chronic energy deficiency or being underweight is significantly high (52.5%, SE = 0.62%) among younger Indian men (15-19 years) for all states. Hazarika et al. (2012) had also reported that Indian women from the age-group 15 to 19 are 3.1 times more likely to be undernourished compared to Indian women from the age-group 35 to 49. Some possible reasons for being underweight in the group of Indian younger men from the age-group 15 to 19 seem to be (a) tendency of avoiding breakfast and meals for nonliking reason or due to stress/burden of school/college examinations, (b) habit of eating nonnutritious food, (c) less food intake for maintaining body figure, (d) insufficient diet to support the level of physical activities, and so on.
Indian men belonging to low and medium standard of living are, respectively, 2.18 (p < .001) and 1.56 (p < .001) times more likely to be undernourished than the men in higher class of living. In the states, Tripura (OR = 7.75), Karnataka (OR = 3.19), Goa (OR = 2.94), Kerala (OR = 2.70), Gujarat (OR = 2.27), and New Delhi (OR = 1.88) men with low standard of living are suffering more from undernutrition.
Christian men (OR = 0.36) and men from other (expect Hindu and Muslim) religion (OR = 0.73) are significantly less likely to be undernourished than Hindus in India.
Muslims belonging to the states Andhra Pradesh (OR = 1.36) and Uttar Pradesh (OR = 1.12) are significantly more likely to be undernourished than Hindus.
Indian men from caste categories SC, ST, and OBC are significantly more likely to be undernourished as compared to General and Other category in the north and west zones with the ORs for SC (OR [north zone] = 1.26, CI = 1.09-1.46; OR [west zone] = 1.40, CI = 1.20-1.65), ST (OR [north zone] = 1.94, CI = 1.51-2.51; OR [west zone] = 1.47, CI =1.25-1.75), and OBC (OR [north zone] = 1.32, CI = 1.14-1.52; OR [west zone] = 1.44, CI = 1.30-1.61). But in the northeast zone men from ST (OR = 0.55, CI = 0.45-0.68) and OBC (OR = 0.78, CI = 0.67-0.91) categories are significantly less likely to be undernourished as compared to General and Other category.
In addition to the intervention programs for awareness to reduce the undernutrition, effective policies and information on health education programs for men are urgently required in India to ensure adequate access to health services and to understand the components of a healthy diet. This is to be done at least for the younger age-group (15-19 years), as 52.5% of these men are underweight. Also, in India about one-third people are facing problems in getting sufficient food due to extreme poverty. To overcome this problem, the Indian government has recently passed the National Food Security Act, 2013 in September 2013. As per the National Food Security Act 2013, all eligible households shall be entitled to get food grains (5 kg per person per month) at the subsidized price not exceeding Indian rupees (Rs.) 3 per kg for rice, Rs. 2 per kg for wheat, and Rupee 1 per kg for coarse grains (millet) for the period of 3 years from the date of commencement of this act, and thereafter these prices will again be fixed by the Indian government from time to time. This Act will make access for sufficient and nutritious food for 75% of rural and 50% of urban population of India including all poor. This step will definitely help to improve the nutritional status of Indians in the near future. There are some more provisions for advancing food security as mentioned in the National Food Security Act 2013, which may also be helpful to improve the nutritional status of Indians. These provisions include access to (a) safe and adequate drinking water and sanitation; (b) health care; (c) nutritional, health, and education support to adolescents; and (d) adequate pensions for senior citizens, persons with disability, and single women (National Food Security Act, 2013).
Footnotes
Declaration of Conflicting Interests
The author(s) declared no potential conflicts of interest with respect to the research, authorship, and/or publication of this article.
Funding
The author(s) received no financial support for the research, authorship, and/or publication of this article.