
Abstract
Precision fermentation of animal food proteins is an area of intense research as the requirements for more sustainable production increase. Despite significant strain engineering advances, the optimization of cell factories, including existing industrial fungal hosts, to achieve cost-effective protein yields is a major challenge. It is envisaged that the cost point of precision fermentation proteins needs to reach 10 USD/kg by 2025 and 1 USD/kg by 2035. This is a gigantic challenge to obtain high protein titers through strain and process development. A major challenge is the cost of carbon source, and improving the yield is therefore crucial for the economic feasibility. In this study, the influence of pH, temperature, and carbon-input rate was examined in a design of experiment approach to identify optimal fermentation parameters for the production of bovine beta-lactoglobulin by an industrial Aspergillus oryzae production strain. Carbon-input is a measure of carbon dosing relative to a benchmark feeding profile. The carbon-input was defined as the feed concentration multiplied by the feed-rate. This approach was used to show the relevance of the study and without compromising the confidentiality of the specific feed data. The optimal production yield, representing a protein production increase of almost 80% and a carbon yield above 70%, was achieved at pH 6.9, 36°C, and a carbon-input of 1.23×. The carbon-input correlated with biomass formation and significantly affected carbon yield. These results represent a significant step toward cost reduction and implementation of feasible precision fermentation for sustainable production of alternative food protein for a growing population. The production strain used in this study has been used to produce registration batches for a current Generally Regarded As Safe notice submission to the Food and Drug Administration.
Keywords
Introduction
Precision fermentation is defined as the use of genetically modified organisms to produce a specific protein or metabolite 1 and has evolved to specifically concern recombinant production of animal food proteins by microbial fermentation.1,2 The technology is becoming more mature and has entered the bulk product market with smaller profit margins, such as the food and nutritional space. 3 It has been estimated that by 2050, the amount of protein produced must be increased by 80% to meet the protein intake demands of the growing population in sustainable manner. 4 The production of proteins through precision fermentation is a more sustainable method of producing protein compared to conventional animal-based agriculture, which uses and produces a large carbon footprint and requires much larger amounts of land, water, and feed. 5 Novel food products manufactured by precision fermentation are entering the market in small steps in the form of substitution ingredients or nutritional additives, and the first non-animal-derived milk and egg proteins manufactured by precision fermentation are already on the market.2,5,6
In contrast to higher value proteins (e.g., pharmaceuticals, enzymes), with a high price and normally used at lower amounts, precision fermentation bulk proteins used in food and nutrition are required in much higher quantities, as they are used as ingredients in the final food product. Therefore, it is not sufficient to obtain, for example, a few grams of protein per liter during fermentation. Protein titers well above 50 g/L are needed. 2 The most impactful way to improve the production titer of precision fermentation is through strain engineering and fermentation process optimization. Starting strain development work using a standard laboratory strain is a tremendous task. Limited secretion capacity, growth in a fermentor at different scales, endogenous side activities from the species (especially proteases), and other secreted proteins can affect titer and product purity and stability. These bottlenecks have been eliminated to a large extent in current industrial strains of Aspergillus oryzae. Still, a lot of efforts are continuously being dedicated to strain development. 7 These include the large share of genes with unknown functions described in A. oryzae. 8 Once a promising production strain candidate has been developed, significant improvements can be obtained through process optimization. 9
Aspergillus oryzae and Aspergillus niger are common production organisms used in industry due to their excellent secretory system as well as their long history of producing proteins used in food applications, where many different proteins have obtained a GRAS (Generally Regarded As Safe) status by the U.S. Food and Drug Administration 3 and other geographies. Due to its use in industry, scarce published work is available on optimization of fermentation conditions for recombinant A. oryzae strains (reviewed in Ntana et al. 7 ), and the level of production of recombinant proteins published is typically well below commercially relevant levels. Medium, temperature, pH, and agitation are common parameters used for process optimization.7,10,11 More recently, the effect of inoculum size and morphology on the production of recombinant lipase in A. oryzae has been reported. 12 Statistical methods have been used in optimization of glucose oxidase production using a natural isolate of Aspergillus terreus. 13 One of the few published examples used a Box–Benken experimental design to optimize amylase production in A. oryzae. 11
Bovine beta-lactoglobulin (BLG) is one of the best nutritional proteins in our diet. There is growing evidence of the high nutritional value of BLG, 14 one of the major whey proteins in milk. BLG is rich in leucine and digests rapidly, efficiently stimulating muscle protein synthesis and muscle maintenance. It offers superior nutrition compared to other protein sources in the food chain like casein, soy, and pea proteins with enhanced digestibility and amino acid profile. BLG is valuable in sports nutrition, clinical recovery, and metabolic health due to its functional benefits. 14 Here, we describe work using an advanced A. oryzae production strain expressing a gene encoding BLG and the optimization of the fermentation process performed based on a statistical approach in the Sartorius Ambr® 250 high-throughput fermentation system (hereafter referred to as the Ambr 250 system). This system has become an industry standard for fermentation optimization because the process is scalable, and the learnings from the system can be used for upscaling to manufacture scale. The A. oryzae strain used in this work is derived from an advanced strain lineage originally developed at Novozymes (now Novonesis, Bagsværd, Denmark) that includes high-yielding strains, strong promoters, and optimized signal peptides, among other genetic tools. 15 The production strain used in this study has been used to produce registration batches for a current GRAS notice submission to the FDA.
Increasing the product titer will reduce the cost of BLG production. Likewise, improving the carbon yield (i.e., the product amount per substrate amount) will increase the efficiency of the sugar utilization, which will reduce the raw material cost.16,17
Materials and Methods
STRAIN AND CULTIVATION
A proprietary, recombinant BLG production strain of A. oryzae (TFB-Ao0024) used in this study originated from strain A1560, which is the same strain as IFO 4177, Institute for Fermentation, Osaka, Japan. 18 The production strain is derived from strain AT604 (described in GRN 811) with additional modifications to reduce protease levels and increase protein titers.19,20 Like the AT604-derived production strain described, 20 strain TFB-Ao0024 was constructed by introducing multiple copies of a codon-optimized bovine BLG gene fused to an optimized signal peptide by homologous recombination using the same method. Expression of the BLG gene is under the control of an engineered promoter derived from the A. niger neutral amylase gene 2 (NA2). Induction of expression is obtained in medium containing maltose or glucose, while no expression is obtained using glycerol. 8
As a preparatory step for the Ambr 250 bioreactors, agar-plates containing non-inducing medium (Cove-Sucrose 100 mM NaNO3 + 10 mM Thiamine–HCl 21 ) were streaked with 100 µL of cryo-stock material and incubated for 11 days at 30°C. Once sporulated, spores were harvested by adding 20 mL MilliQ-water + 0.1% Tween®80 solution per plate, scraping the spores into solution using a cell spreader. Subsequently, freshly harvested spores were used to inoculate 500 mL polypropylene shake-flasks filled with 100 mL seed-media (18 g/L yeast extract, 21 g/L glycerol, 0.6 g/L urea, and 1 mL/L DyStar BCC 627 antifoam). The flasks were inoculated with the spore resuspension to reach a final spore concentration of 1 × 10⁶ spores/mL. The spore concentration was determined using a cell counter (Nexcelom Cellometer Auto X4).
Seed-shake-flasks were incubated in an Innova® 44 with an orbital diameter of 2 inches, an agitation setpoint of 200 rpm, and a temperature of 30°C. The seed-shake-flasks were incubated at these conditions for 49 hours. Seed-shake-flasks were used to inoculate the Ambr 250 bioreactors with a 9% v/v (15 mL) inoculum.
AMBR 250 FERMENTATIONS
We used a proprietary benchmark complex medium for the fermentation, characterized by a carbon-to-nitrogen (C/N) molar ratio of 6.1, calculated on a carbon mole basis. Calibration of the dissolved oxygen probe was performed at maximum agitation (2400 rpm) and at center point temperature (33°C) and with an aeration of 1 vvm (volume of gas per initial volume of liquid per minute) based on the initial volume including inoculum corresponding to a constant 184 mL/min. The Ambr 250 system has four different dosing lines available, and three of them were used for the feeds described below. The fourth dosing line was used for the addition of ammonium hydroxide solution, which acted as the base and primary contributor of nitrogen to the system. All dosing lines were primed before the start of the experiment.
INOCULATION
To limit biological variation, inoculation of the bioreactors was done by pooling all seed-shake-flasks into one bottle, mixing, and then distributing the seed to three seed-bottles. The built-in liquid handler on the Ambr system was used to distribute the inoculum to all the bioreactors. The time between the first bioreactor being inoculated and the last bioreactor being inoculated was approximately 1 hours. The sampling order was adjusted to follow the same pattern as the inoculation order to minimize variation. The bioreactors were run for 7 days, and the initial volume and feed-rates were adjusted to ensure that volume limitations would not occur.
The clamp temperature was set to 29°C for all bioreactors to ensure equal evaporation across all bioreactors, and the condensation was monitored with a condensation bottle.
DESIGN OF EXPERIMENTS
The batch phase for all Ambr 250 bioreactors was run at identical process conditions, and it was only when the induction/production phase started that the independent variables (pH, temperature, and carbon-input) were adjusted to their designated values. A typical production process of A. oryzae consists of a batch phase for biomass generation and a production phase designated for expression of the protein of interest (Fig. 1). The batch phase was run with a minimum pH of 6, which
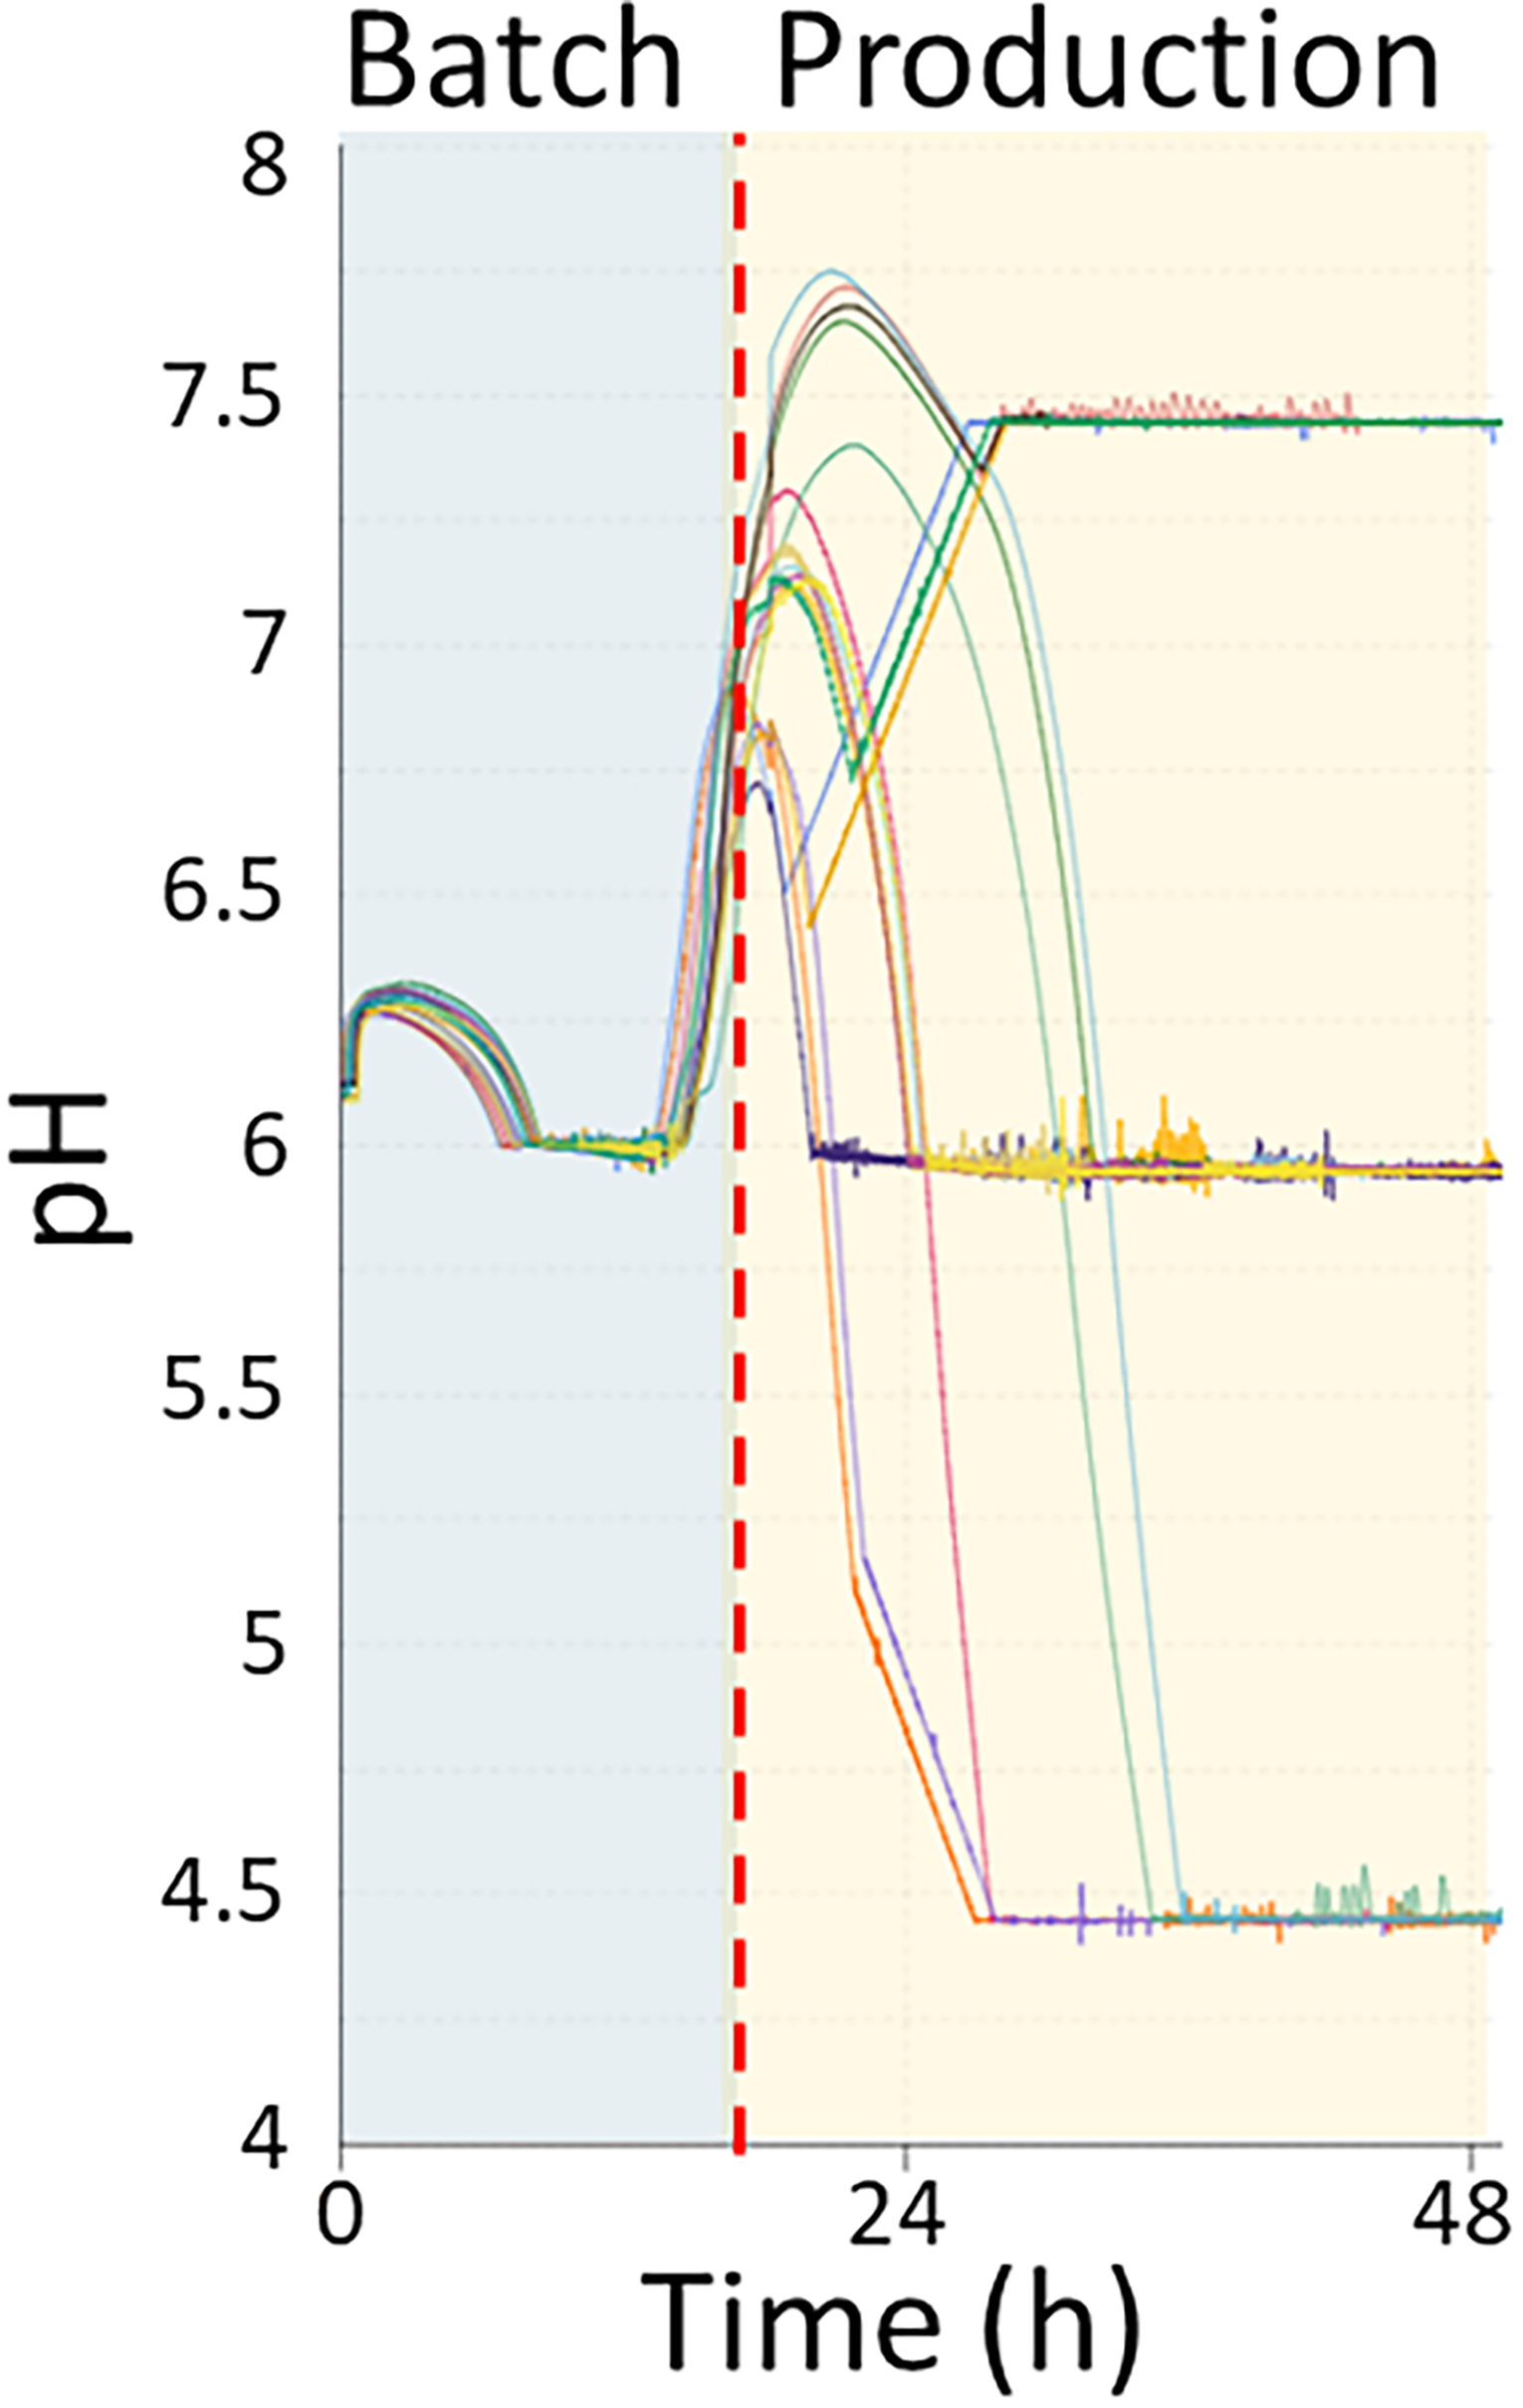
The pH profiles as function of time (hour) of all 17 Ambr 250 bioreactors in the design of experiment. The transition between batch phase (blue) and production phase (yellow) is shown to illustrate when the independent variables start to take effect.
was maintained with 6 N ammonium hydroxide. Once entering the production phase, the pH was adjusted to the relevant pH value. The agitation profile was scheduled to start at 1200 rpm for 5 hours and subsequently ramped to 2400 rpm over 15 hours. The initial temperature for all bioreactors was 33°C. The feed phase started after at least 9 hours of the batch phase and when the pH would exceed pH 6.5. Once the feed started, the set point of the temperature and pH was changed to their designated values based on the experimental design. The temperature was either kept stable at 33°C or ramped to 30 or 36°C for 12 hours. The pH set point was designed to reach its designated pH through a 12 hours ramping starting from pH 6.0 to then either pH 4.5 or 7.5 or kept constant at pH 6.0. The decrease of pH to 4.5 was done without the addition of acid and therefore relied on the conversion of sugar to organic acids, generally observed in A. oryzae and many other filamentous fungi. This phenomenon is interpreted as a survival strategy in nature to acidify the environment to inhibit the growth of competing microbes and to capture metals that are present in limited amounts. 22 The feed profile was designed to have a lower initial feed-rate maintained for 12 hours and then ramped to the maximum feed over 12 hours, which lasted for the remaining of the run. Carbon-input was used as a measure of carbon dosing relative to a benchmark feeding profile, with the benchmark being equivalent to 40 w/w% feed and 1× feed-rate. The carbon-input was defined as the feed concentration multiplied by the feed-rate. The carbon-input was introduced as a concept rather than a feed-rate to keep a similar volume being dosed between the different carbon-input conditions and to preserve the confidentiality of the feed amount dosed. The feed concentrations ranged from 1.3×, 0.9×, and 0.5×, or 52 w/w%, 36 w/w%, and 20 w/w% and contained a ratio of 90% glucose and 10% maltose on a carbon molar basis. The different feed concentrations allowed for the system to have identical feed-rates but different carbon-inputs. The feed-rate was increased compared to the conventional benchmark standard feed-rate of 1× feed-rate to allow for a bigger upper range of the carbon-input. The increased feed-rate was calculated, so it would not cause an overflow of the Ambr 250 and was found to be 1.44× times bigger than the in-house feed-rate. The carbon-inputs of 1.88×, 1.3×, and 0.72× were calculated by combining the increased feed-rate and the ranges of feed concentrations. For example, the upper carbon-input of 1.88× was calculated by multiplying the feed concentration factor of 1.3× with the increased feed-rate of 1.44× (i.e., 1.44 × 1.3 = 1.872, rounded to 1.88×). Similarly, the other carbon-inputs, 1.3× and 0.72×, were calculated by combining the feed-rate of 1.44× with the 0.9× and 0.5× feed concentration factors, respectively. The remaining components (citric acid and DyStar BCC 627 antifoam) were maintained identically for all three feeds.
The dissolved oxygen set point was set to be minimum 30% to avoid oxygen limitation. The agitation, aeration, and feed-rate were all kept constant for the runs, and it was therefore only the gas-composition that would be able to support the oxygen transfer to the system by adding enriched oxygen. The agitation, aeration, and feed-rate were kept constant to avoid differences in shear-stress and to avoid deviating from the design in terms of the carbon-input. The enriched oxygen input was capped at 50% oxygen content in the air composition, but the composition was controlled depending on the dissolved oxygen.
Dry cell weight (DCW) was measured by taking 20 mL of whole broth into a pre-weighed 50 mL falcon tube at the end of fermentation and measuring the whole broth containing tube. The tube was centrifuged at 5000 g for 15 min, and the supernatant was removed through decantation. The pellet was resuspended using deionized-water and was centrifuged again. The supernatant was removed through decantation, and the tube was placed in an 80°C oven for at least 3 days. The weight of the pellet was measured afterward.
PROTEIN ANALYSIS
Quantification of BLG was performed using size exclusion on an Agilent analytical high-performance liquid chromatography (HPLC) 1100 and 1200 series system. Samples (2 mL) were taken of the bioreactors at Days 3, 5, and 7 of the fermentation. The sampling order was adjusted to be the same order as the inoculation order to minimize time-variance. The samples were centrifuged at 20,000 g for 10 min, and the supernatant was extracted and microfiltered using a PES 0.2 µm filter. Subsequently, samples were diluted 10× in a 0.1 M Sodium Phosphate Buffer, pH 6.8. The column used was a BIO SEC-3, 100 Å, 4.6 × 300 mm, 3 µm particle size. A sample volume of 5 µL was injected into the system and run for 15 minutes with a flowrate of 0.5 mL/min at an isocratic elution of 0.2 μm filtered 0.1 M Sodium Phosphate Buffer, pH 6.8. The needle was washed between each sample with 20% isopropanol and 80% Milli-Q water for 5 seconds. The column temperature was set to 40°C and the sample compartment to 4°C. The proteins were detected using a Diode Array Detector at 280 nm. A set of commercial bovine BLG (Sigma Aldrich) standards was run at the start and end of the HPLC run, and the average of the detected peaks was used to create the standard curve.
Samples at Day 7 were chosen to identify the optimal conditions in the first iteration of the design of experiment (DoE), as this is where the highest product amounts were recorded. The comparative titer data across Days 3, 5, and 7 are provided in Supplementary Figure S1. BLG supernatant titer was determined from the HPLC analysis as described above, and the titers were used for both calculating product amount (PA) and carbon yield (CY). PA was calculated by multiplying the titer by the final volume of the whole broth, and CY was calculated by dividing the PA by the amount of carbon used. The calculated values were added to the DoE, and the model was run with a standard least squares approach with emphasis on effect screening.
Results
DESIGN OF EXPERIMENTS
An Ambr 250 optimization campaign was initiated to investigate optimal fermentation conditions for the expression of BLG using an A. oryzae production strain developed by 21st.BIO (TFB-Ao0024). The design of the Ambr 250 experiment was based on a combination of proprietary know-how and literature findings.10,11 SAS JMP Pro (version 17.0.0) (SAS Institute, Carry, NC, USA) was used as an aid to design the experiment, where a response surface design with a central composite design was chosen for the optimization strategy. Statistical significance was established at p < 0.05.
This strategy allowed fewer fermentation runs compared to a full factorial design while still testing some of the extreme conditions of the independent variables and maintaining a few center points to establish the biological variance of the setup. The response variables were chosen as PA and CY, were both set to be maximized, and were shown as relative values. Both response variables were chosen as they are key performance indicators from an industrial point of view. PA represents how much BLG was produced in one run per bioreactor, and CY defines how much sugar was required to produce said amount of BLG. PA was chosen instead of titer (in g/L) to account for potential volume differences between the runs, and CY was in focus as opposed to other yield calculations due to its economic relevance at an industrial scale. The categorized continuous independent variables in the response surface design were pH, temperature, and carbon-input with the variables ranging between pH 4.5–7.0, 30–36°C, and 0.72–1.88 factor of the benchmark standard carbon-input. The extremes and the average of the ranges were investigated. The carbon-input was defined as the feed-rate multiplied by the concentration of the feed. The JMP design included 14 conditions and 3 center points in the first iteration resulting in 17 Ambr 250 bioreactors, and a second iteration consisting of 4 Ambr 250 bioreactors designated to validate the optimal process conditions consisting of duplicates of center points and suggested optimal conditions.
After fermentation, a comparison of differences between the independent variables pH, temperature, and carbon-input was performed (Fig. 2). The independent variables were illustrated by grouping the specific independent variable at each of their three distinct levels. The variance of the independent variables was also added to illustrate the strengths and weaknesses of the design.
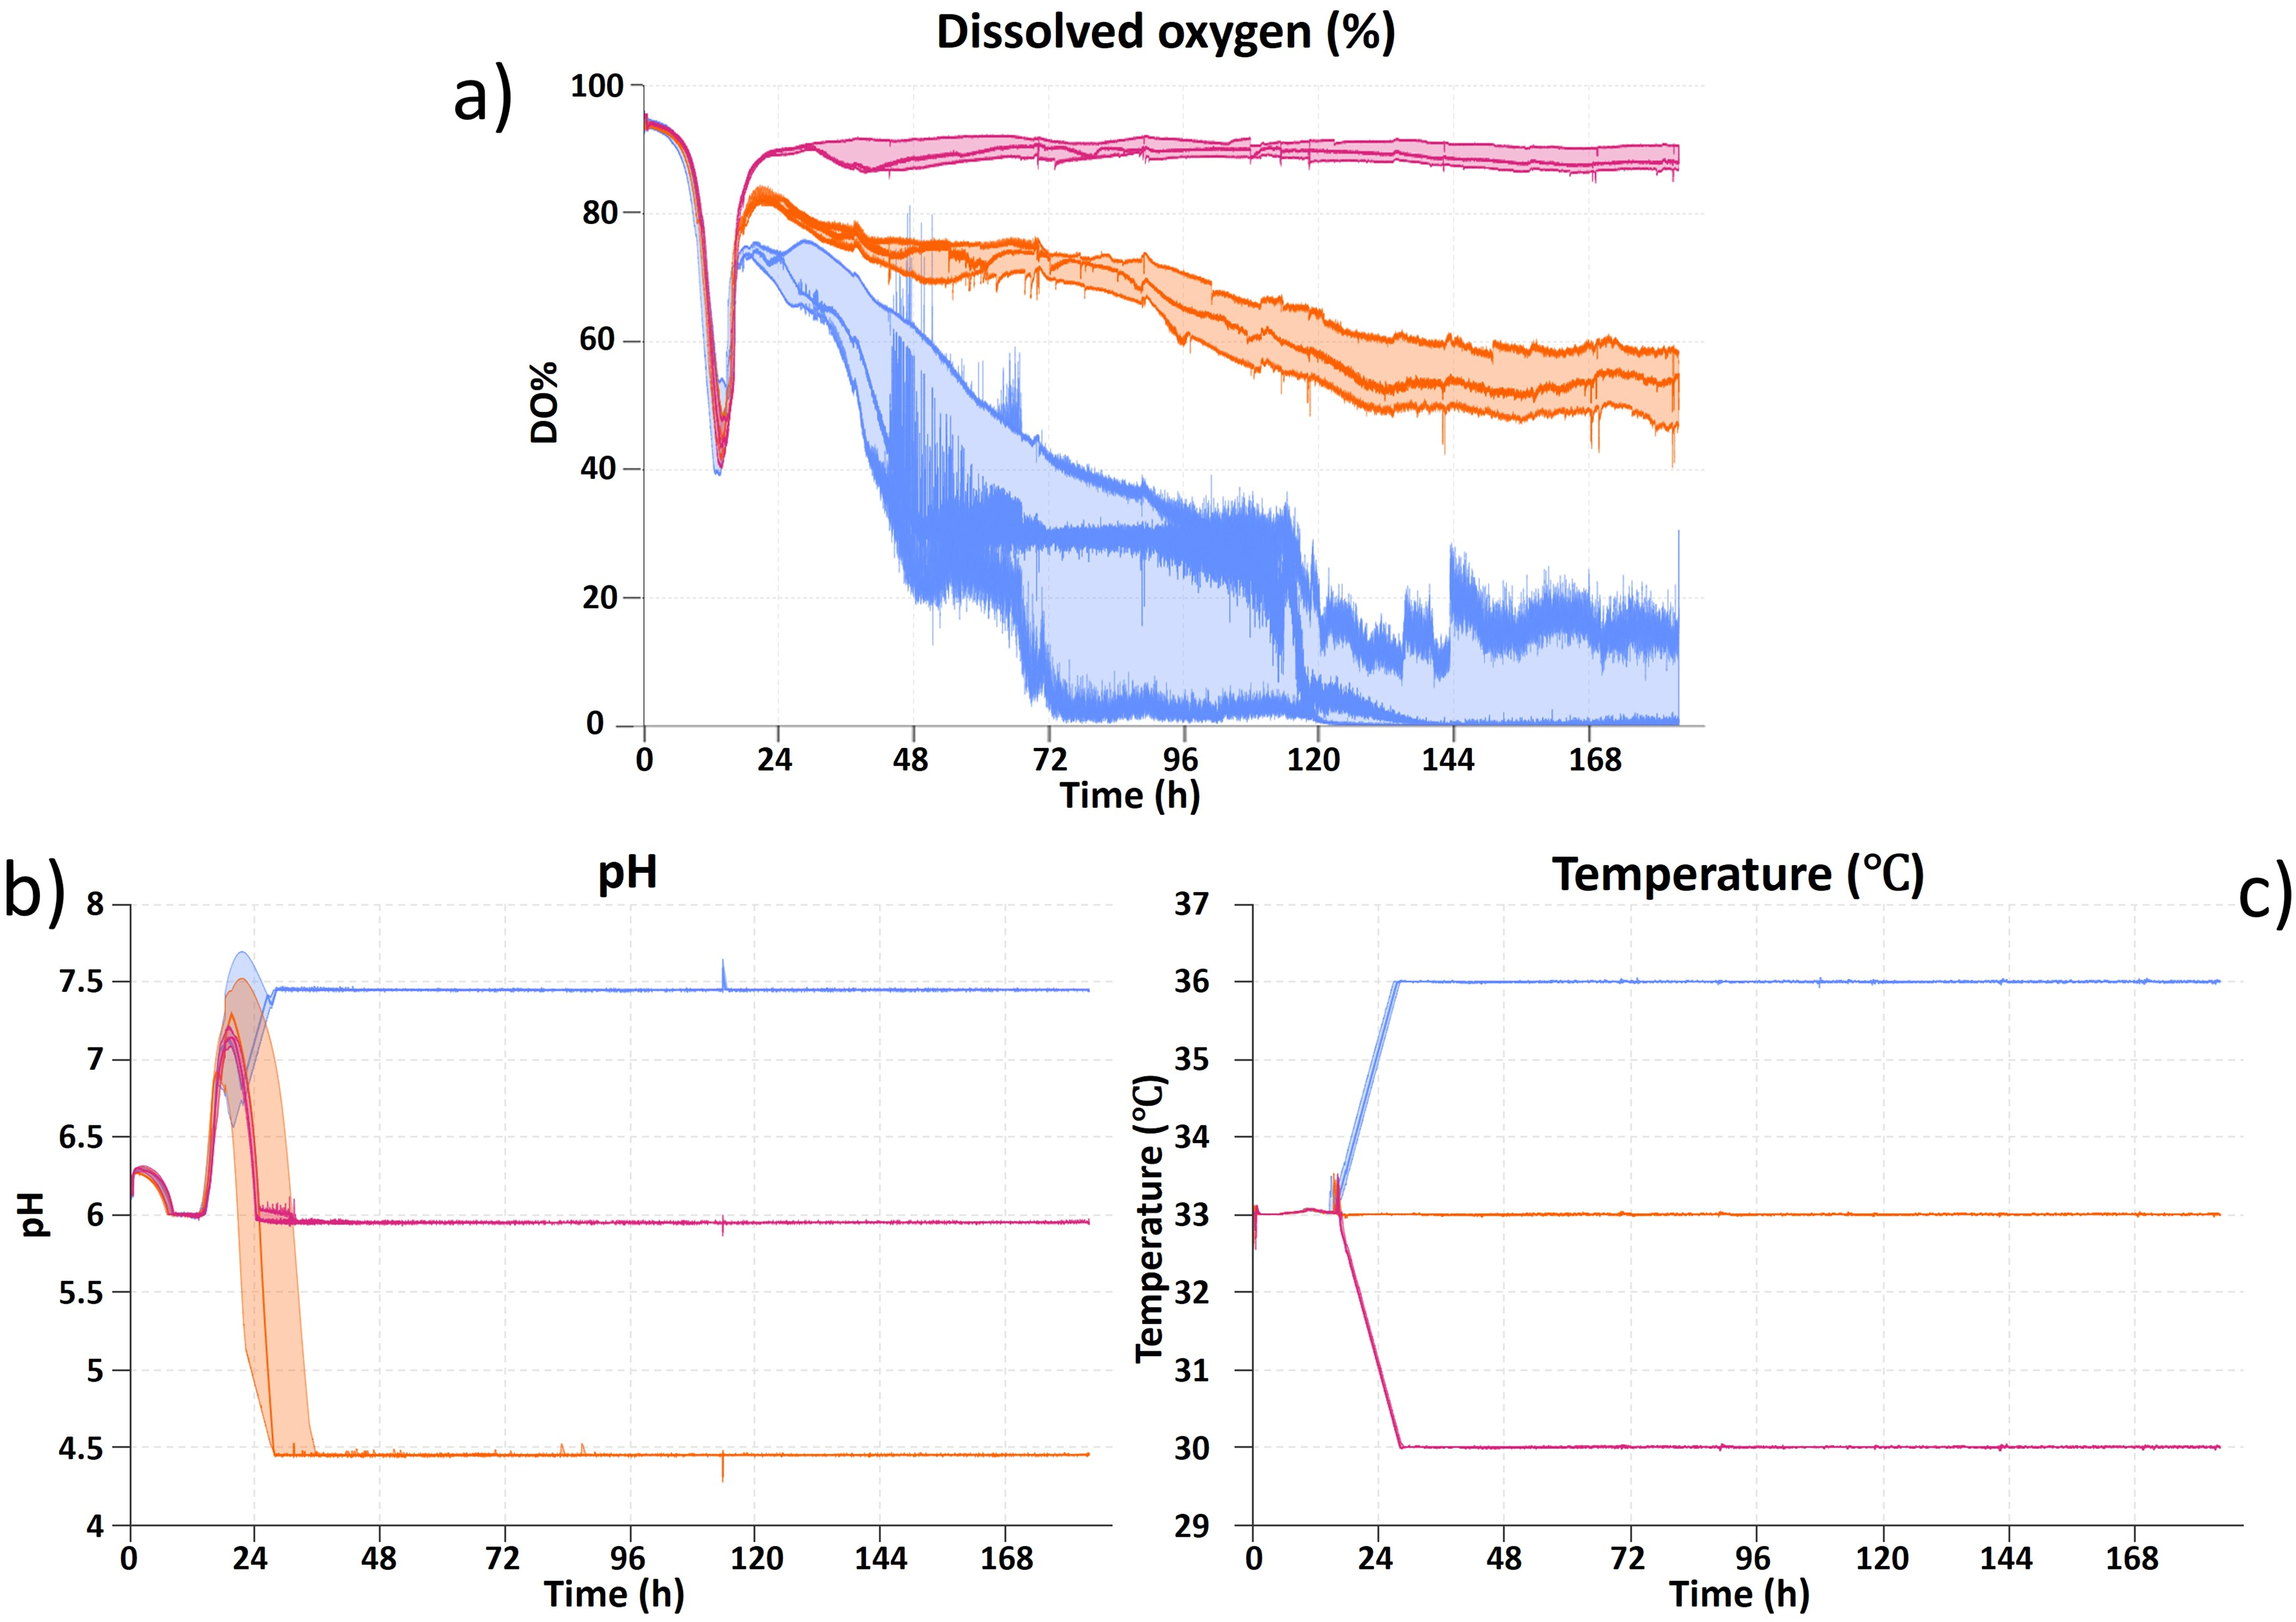
The effect of the independent variables carbon-input, pH, and temperature is shown as function of time for all 17 Ambr bioreactors in
The batch phase of the runs was similar to the dissolved oxygen until the timepoint where the dosing of feed was initiated, indicating the start of the production phase. The dissolved oxygen profiles for all 17 bioreactors in the experiment were grouped based on carbon-input of 0.72× (pink), 1.3× (orange), and 1.88× (blue) to illustrate the effect of feed dosing (Fig. 2a). The production phase began almost simultaneously for all runs, confirming the consistency of the batch phase. Once the feed started, the dissolved oxygen profiles differed more, likely due to differences in the concentration of the feed and how this impacted the carbon limitation of the cells. The Ambr 250 bioreactors with a carbon-input of 1.88× (blue) (Fig. 2) reached a dissolved oxygen concentration of 0% despite being supplied with enriched oxygen to the air composition, resulting in oxygen limitation rather than the preferred carbon limitation. Thus, it was not possible to maintain a dissolved oxygen set point of 30% for the bioreactors with 1.88× carbon-input through altering the air inlet composition alone. Thus, the performance of these bioreactors was ambiguous, due to the potential benefit of adding more enriched oxygen, and the potential disadvantage of exposing the cells to an oxygen-limited environment. For simplicity (and to avoid a disproportionate bias in the models), these effects were not taken into consideration in the DoE results. The pH profiles for all 17 bioreactors were grouped based on their pH set point being pH 4.5 (orange), 6.0 (pink), or 7.5 (blue) to illustrate the robustness of the batch phase, and the pH control capabilities especially with no acid line present (Fig. 2b). A small delay before reaching the pH set point was observed especially for pH 4.5. However, it was not expected that this delay of about 11 hours compared to pH 6.0 would have any major impact on the performance of the system, as the production phase at pH 4.5 continued for about 130 hours (Fig. 2b). Temperature control was quite stable and well-regulated throughout the entirety of the run, and barely any variance was observed (Fig. 2c).
The BLG titer of samples from Days 3, 5, and 7 was analyzed using size-exclusion HPLC. PA was calculated by multiplying the titer (g/L) with the calculated total volume of the whole broth (L). The total volume of whole broth was automatically processed by the Ambr 250 throughout the fermentation, and the system accounted for the addition of substrate and base, while also accounting for the volume removed through subtracting samples and evaporation. PA and CY were both displayed as relative values and were calculated using the average PA and CY for the center points on Day 7 as reference points.
An overview of process conditions, PA and CY at Day 7 samples is shown (Table 1), where the process conditions are sorted from largest to smallest based on PA. The process conditions showing the lowest PA and CY were all run at pH 4.5 and generally resulted in low PA and CY values close to 0%. The process conditions pH 6.0, 36°C, 1.3× and pH 7.5, 33°C, 1.3× resulted in both high PA and CY, while others resulted in mixed performance of a high PA and a low CY or vice versa like pH 7.5, 36°C, 1.88× and pH 7.5, 30°C, 1.88×, respectively. Additionally, a carbon-input of 1.88× only appeared to affect CY negatively and not PA. This could be due to inefficient carbon utilization of the cells, producing more biomass or perhaps a higher production of metabolites due to the oxygen-limited environment and thus shift of metabolism. Alternatively, an excess of carbon in the media could be accumulated in the broth. Table 1 also illustrates more clearly how close the center points being at pH 6.0, temperature 33°C, and 1.3× carbon-input were with a maximum difference of 10% in PA and 15% in CY providing further evidence of the robustness of the system. The variance observed was likely due to typical biological and analytical variation.
Overview of Day 7 Relative Product Amount (%), Relative Carbon Yield (%), and Normalized Dry Cell Weight Including Standard Deviation
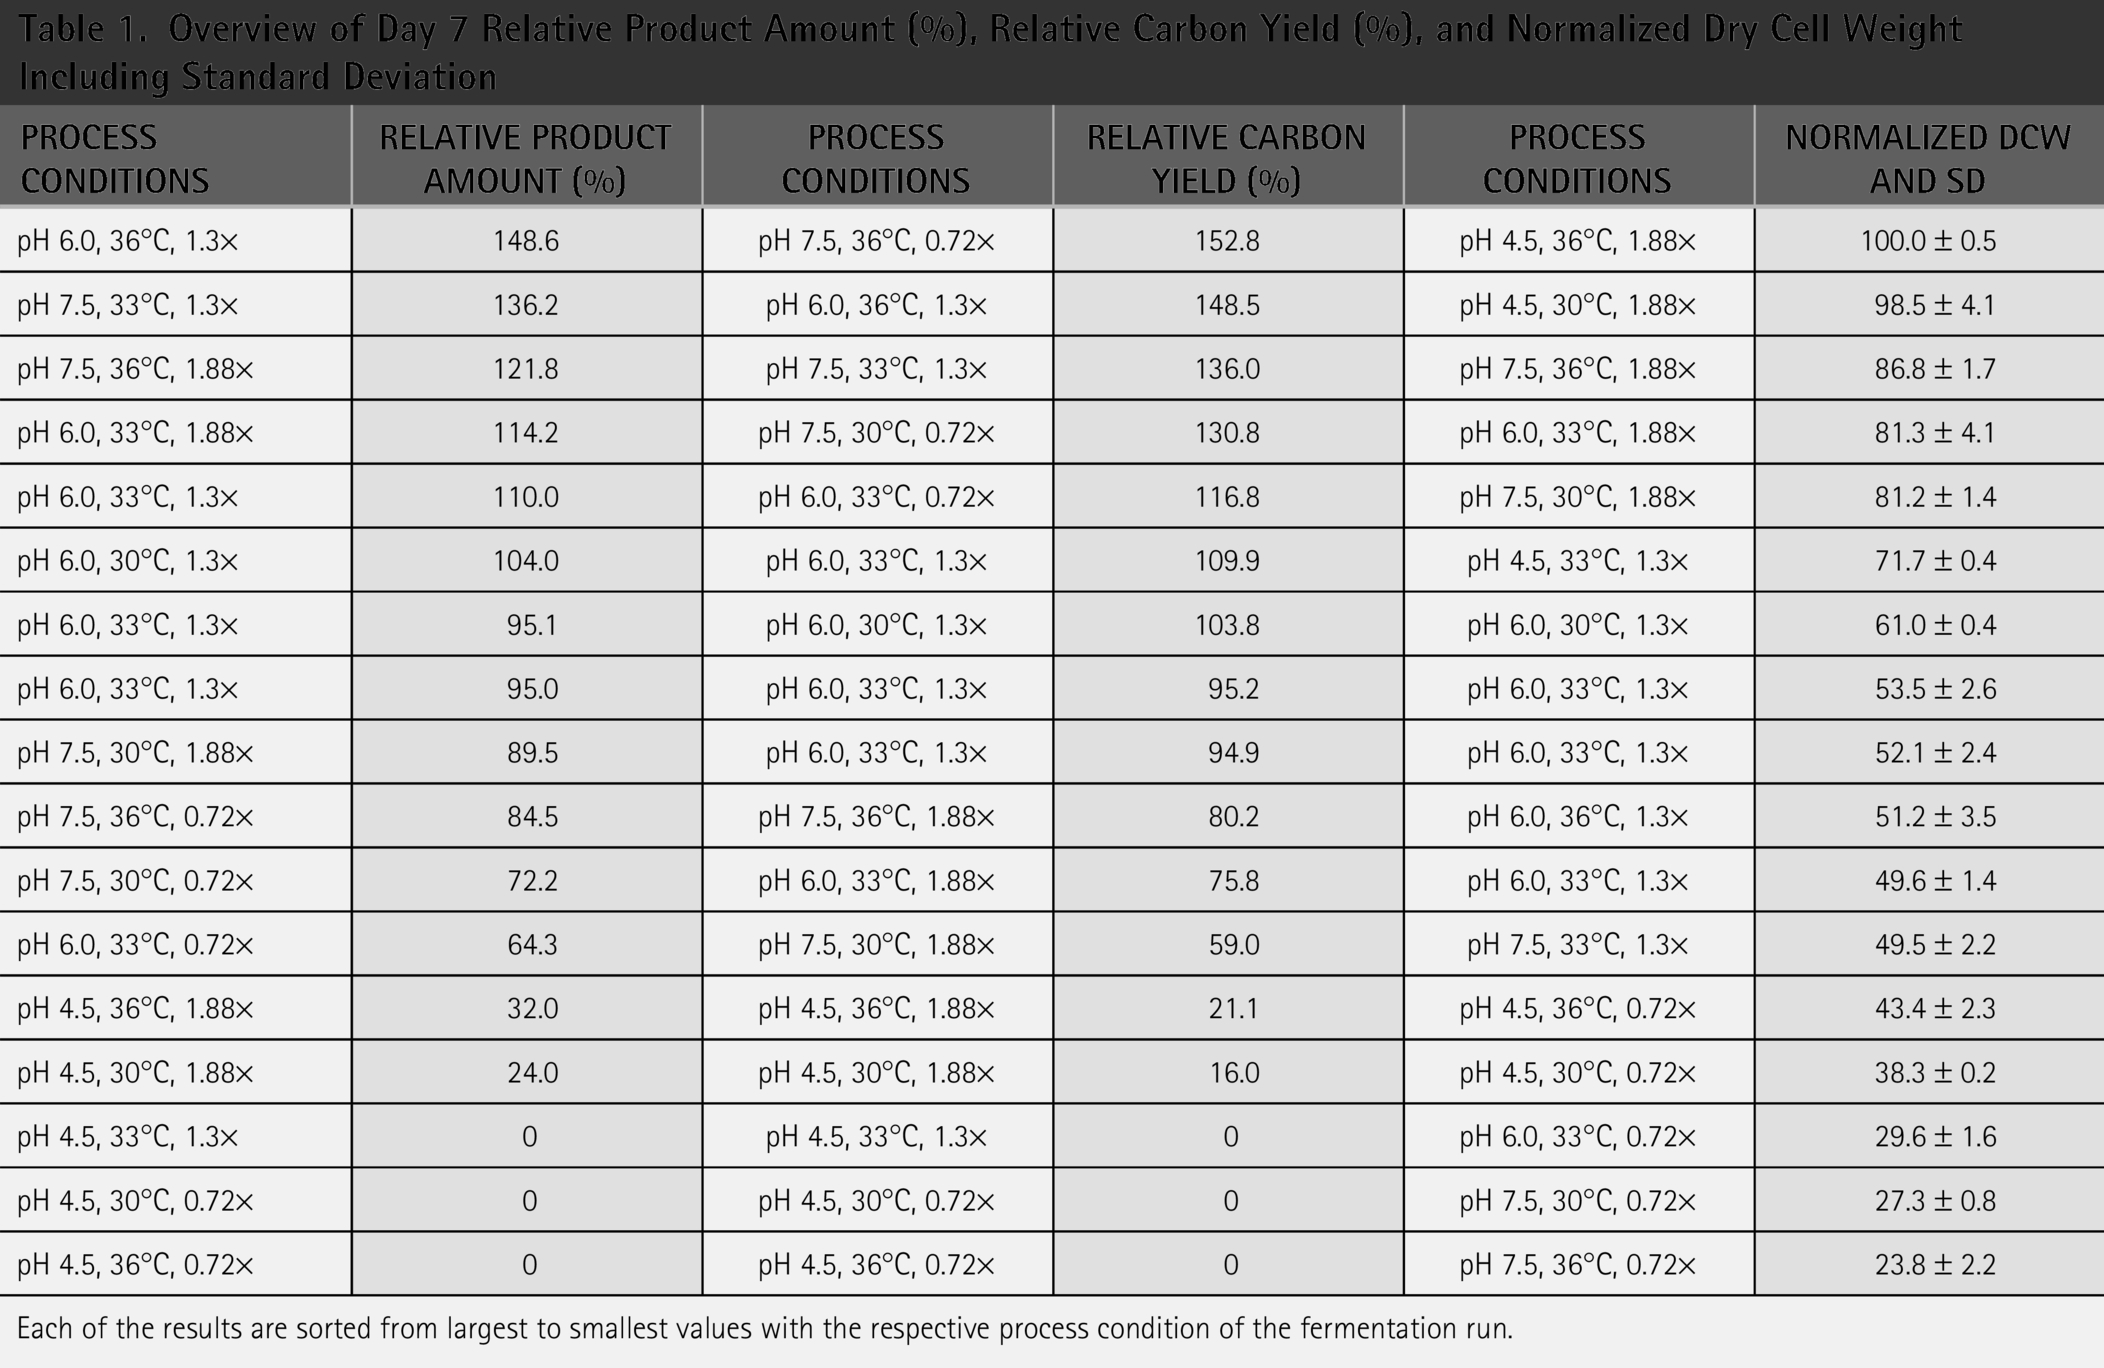
Each of the results are sorted from largest to smallest values with the respective process condition of the fermentation run.
Another interesting aspect that was not considered in the DoE was biomass concentration measured as DCW. As shown, the lower PA and CY obtained at pH 4.5 do not correlate with poor biomass formation. In fact, DCW measurements consistently showed higher biomass formation for all conditions at pH 4.5. Comparing pH 4.5, 6.0, and 7.5 at 33°C and 1.3× resulted in DCW values of 72, 52, and 50, respectively. The robustness of the method was demonstrated by the low standard deviation from all samples (<10%) and the variation between the center points. Carbon-input correlated directly with biomass formation for all conditions tested, and it could explain the lower CY efficiency at carbon-input of 1.88× as previously observed (Table 1). Additionally, temperature had the smallest effect on biomass formation (Table 1).
The performance of each bioreactor in terms of PA and CY was included in the DoE modeling and used to find the predicted optimized process conditions. The prediction profiler was set to maximize desirability, which resulted in the model predicting the optimal conditions to be pH 6.9, temperature 36°C, and a carbon-input of 1.23×. Temperature was shown to be an independent variable with a negligible effect in this study. Therefore, a temperature of 33°C was chosen instead for the follow-up experiment. The effect summary from the initial DoE showed that pH, the quadratic effect of pH, and the interaction of pH with carbon-input were the most significant sources in that specific order (Figs. 3 and 4). It is clear that pH had a significant impact on performance, especially at pH 4.5, as surface plots depicted with PA and CY, respectively (Figs. 3 and 4). The plots were constructed from the prediction formula obtained by the response surface design model, and needles were added to the plots to show variance. The prediction formula for PA and CY showed an R2-value of 0.94 and 0.97, respectively.
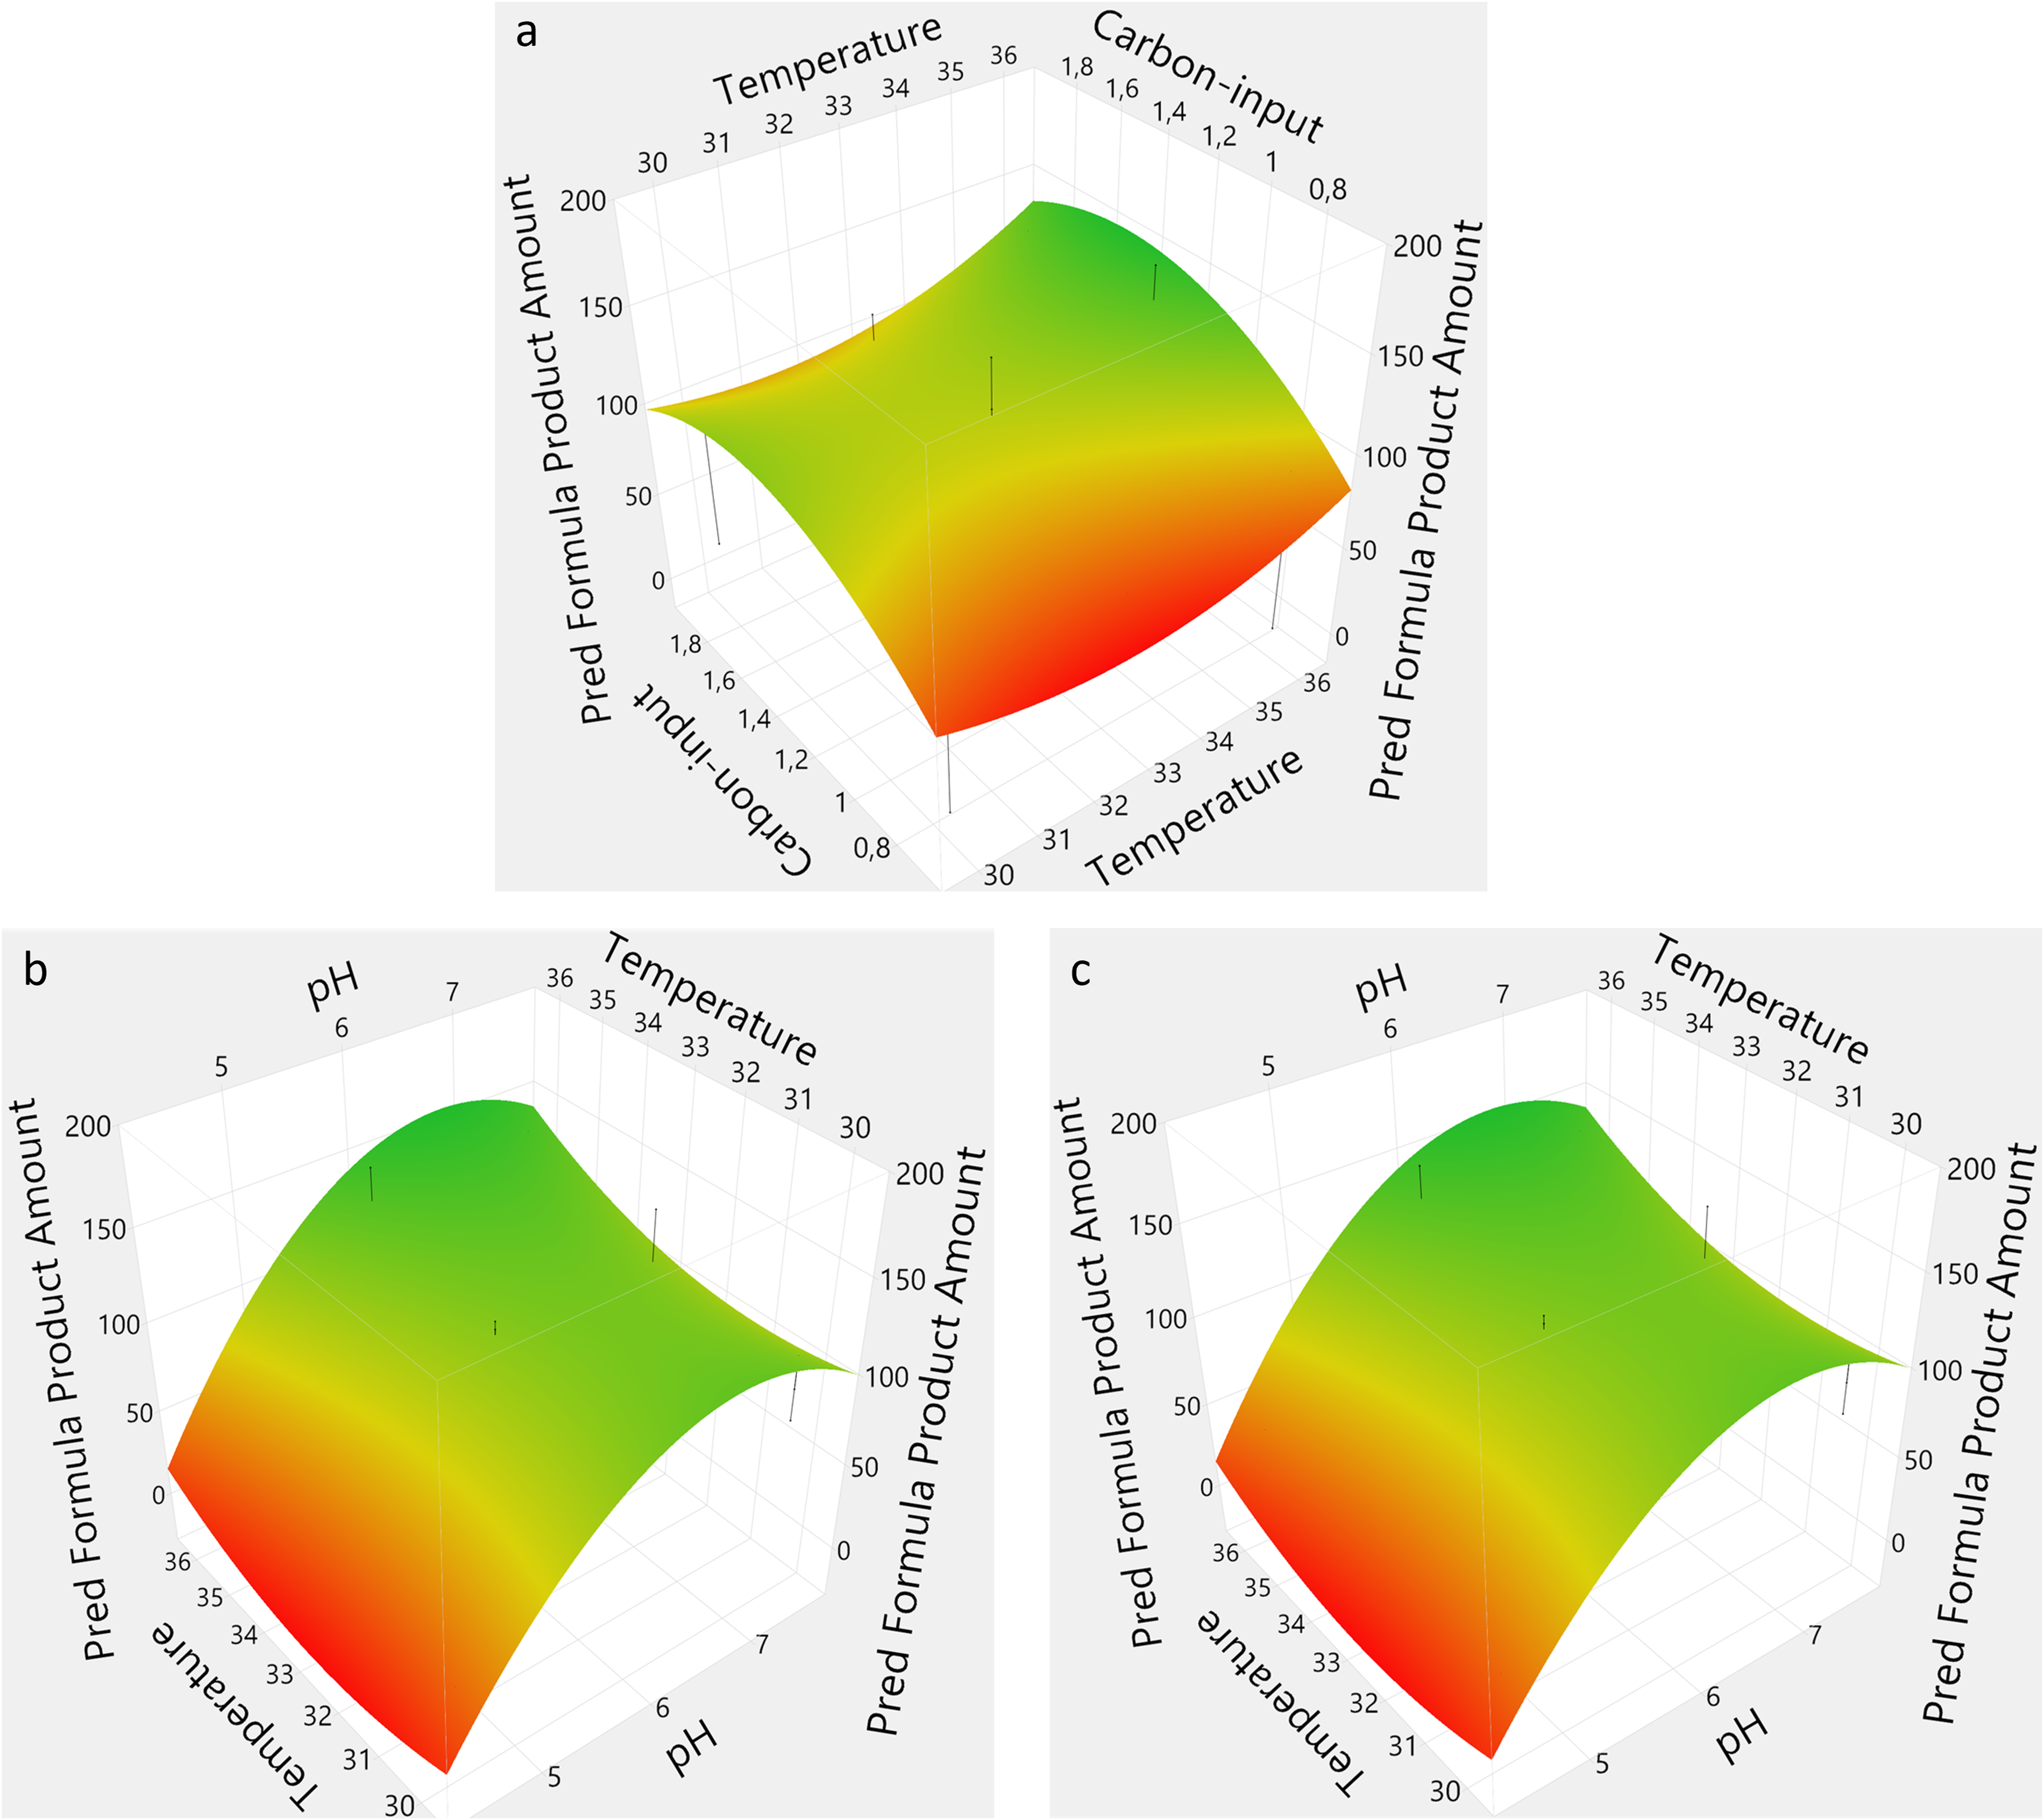
Surface plots showing the product amount as function of a pair of the different independent variables, temperature versus carbon-input
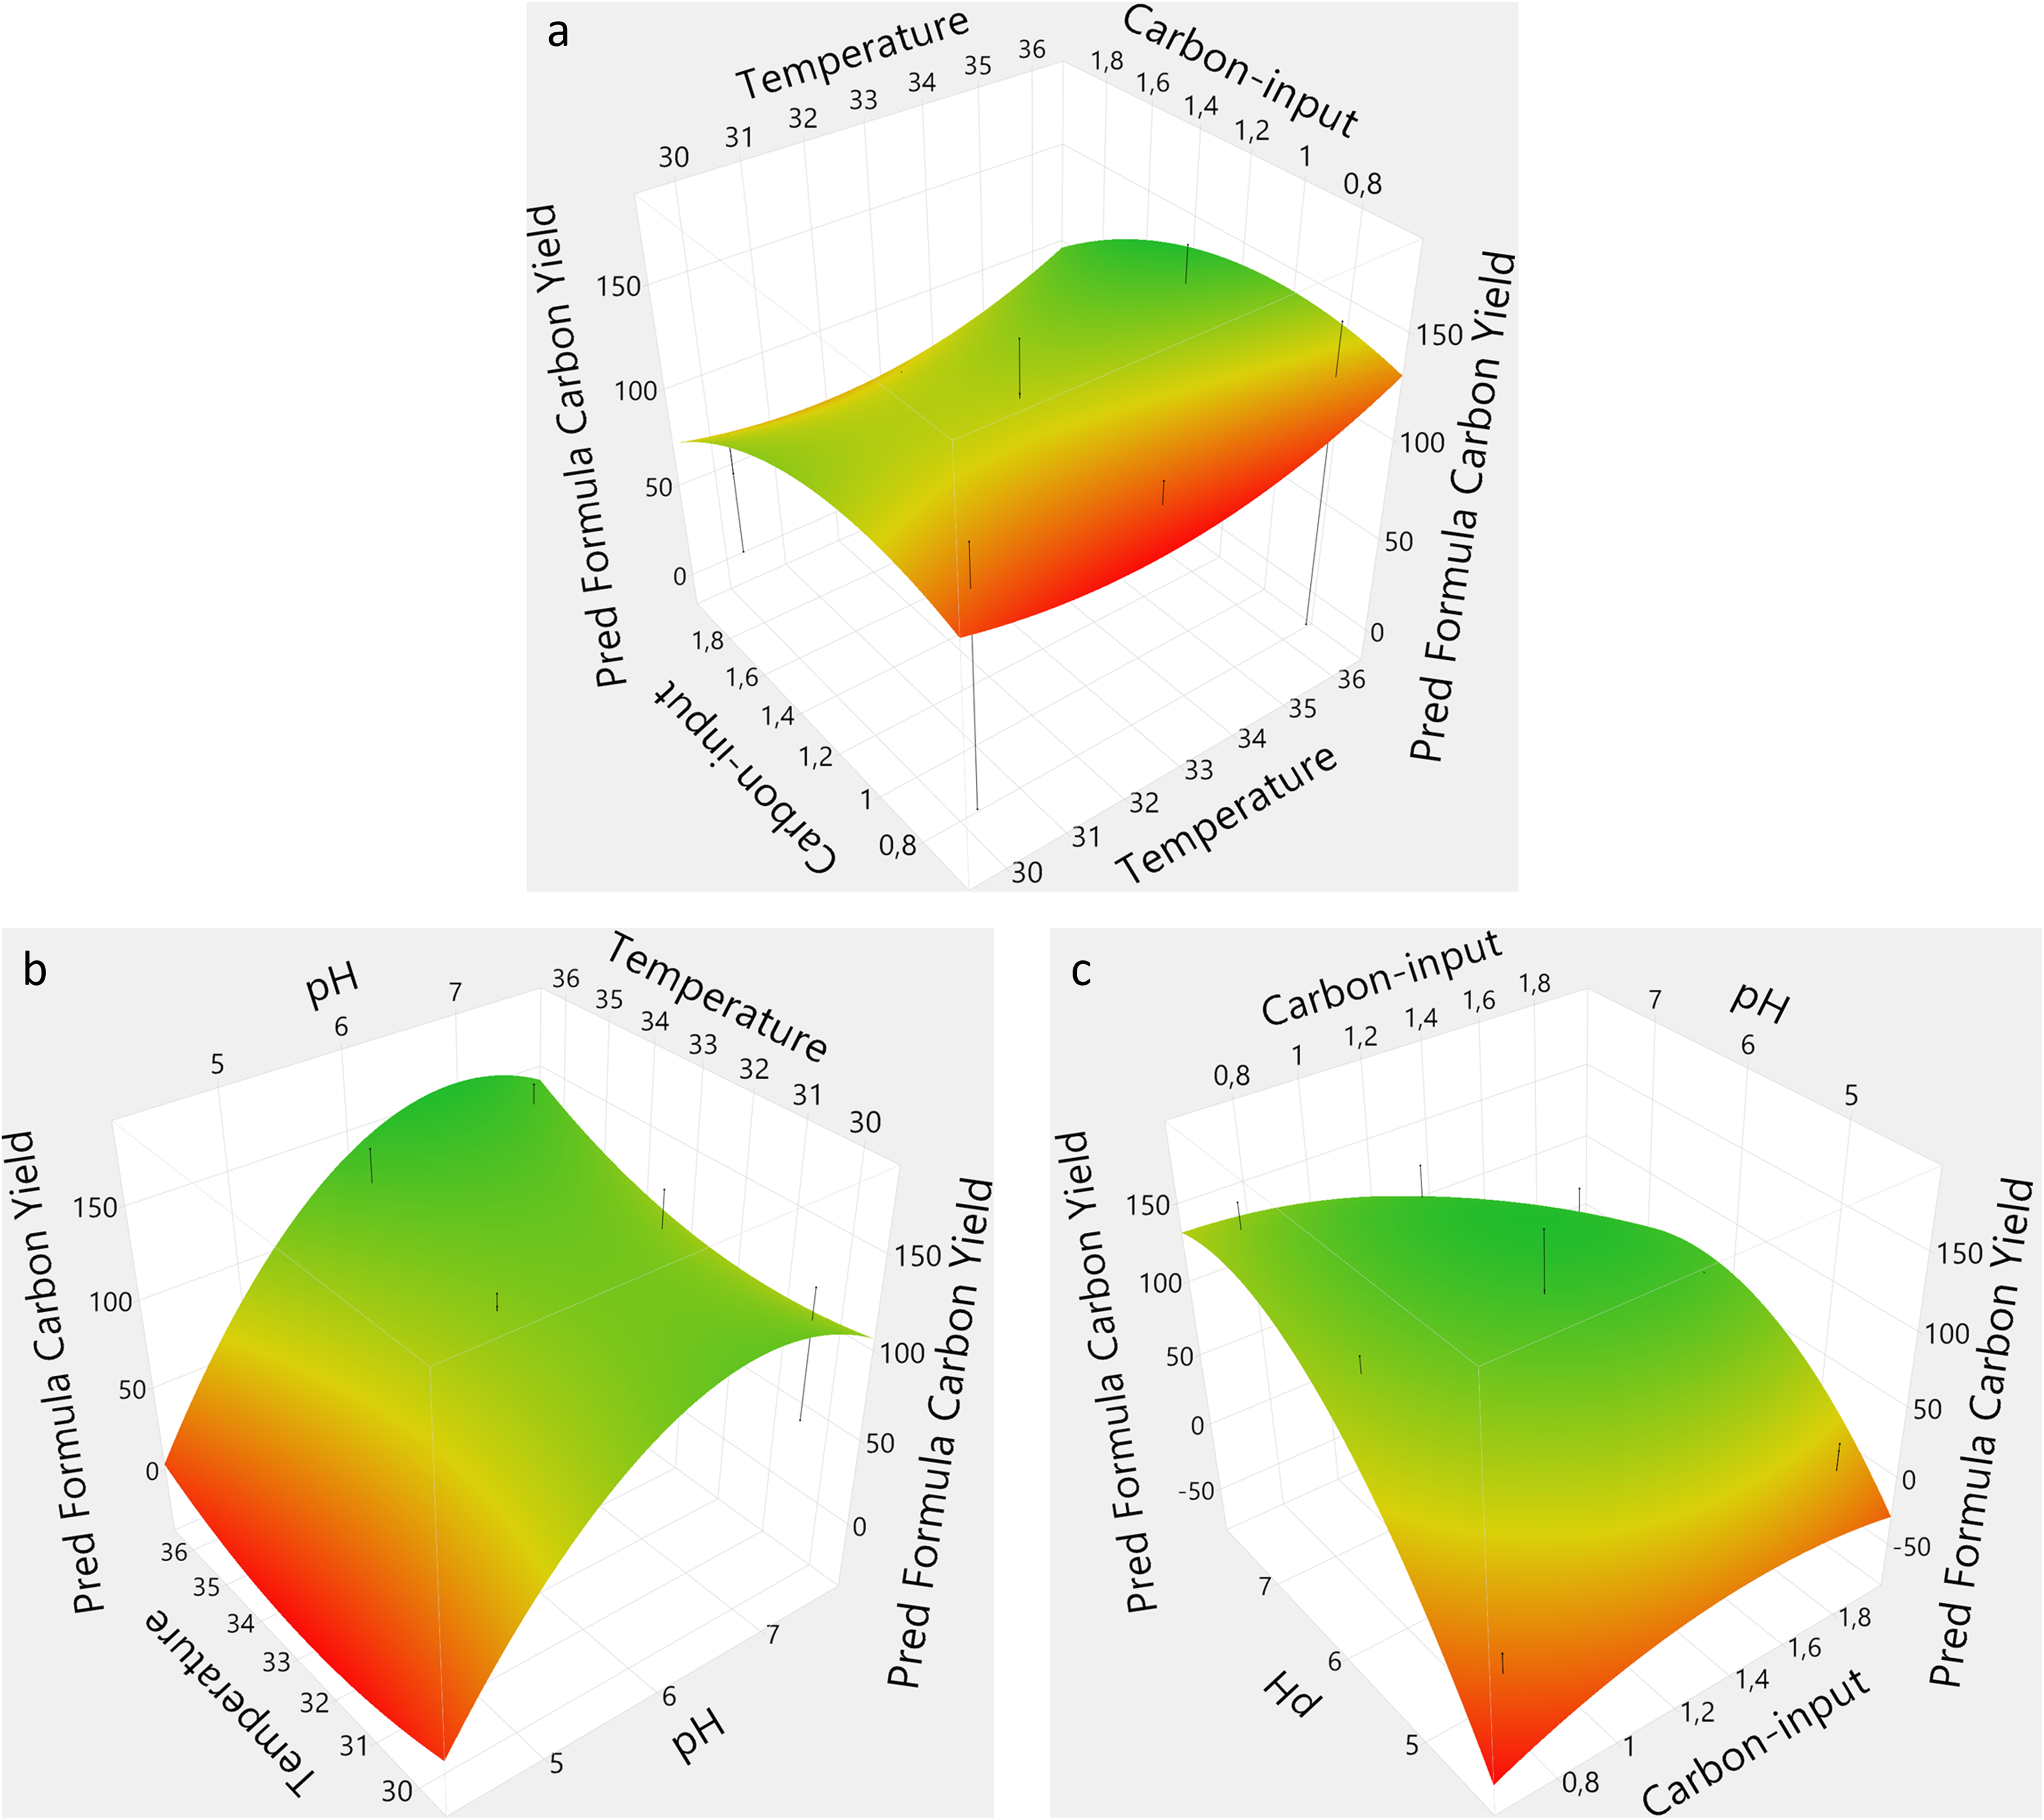
Surface plots showing the carbon yield as function of a pair of the different independent variables, temperature versus carbon-input
A clear tendency was observed on the influence of higher pH on the response variables (Figs. 3a and 4a). Additionally, a saddle-shaped optimum indicates that temperature was not significant, while too high or too low carbon-input negatively affected performance. A classical optimum curve was obtained where the optimal pH and carbon-input are between the outer ranges for both variables (Fig. 3b). Interestingly, a combination of high pH and low carbon-input provided a beneficial effect on BLG production (Fig. 4b). Finally, temperature was shown to be less impactful than pH and depicted the same shape (Figs. 3c and 4c).
AN OPTIMIZED PROCESS FOR BLG PRODUCTION
It was possible to identify an unequivocal pH optimum range for both PA and CY. Additionally, the results shown above indicated that although the pH range used in the study was wide, the bioreactors at pH 4.5 essentially provided no product formation (Table 1). Additionally, temperature within the 30–36°C range was not a significant variable as its p value is higher than 0.05. For the validation of suggested optimal conditions, temperature was changed from 36°C to 33°C, as it is the center point. The follow-up experiment for validating the optimal process conditions was run in duplicates, with one set of duplicates using center point conditions and another set of duplicates being the suggested optimal process conditions. The additional center point bioreactors were added to validate the low variability between separate experiments. Fermentation was executed in the same way as described in the initial trial. PA and CY were calculated for the new conditions.
Optimal process conditions for the production of BLG were investigated and compared to the center point conditions. Using the optimized conditions, a 79% improvement on the PA and a 73% improvement on CY were obtained (Table 2). The optimized conditions were confirmed in duplicates. The center point conditions are at 100% as they are the reference point of the values. Interestingly, both temperature and carbon-input are shown to be statistically insignificant, as their p value is higher than 0.05 in the original design of the experiment response surface model.
Comparison of Center Point and Design of Experiment Predicted Optimized Conditions on Product Amount and Carbon Yield
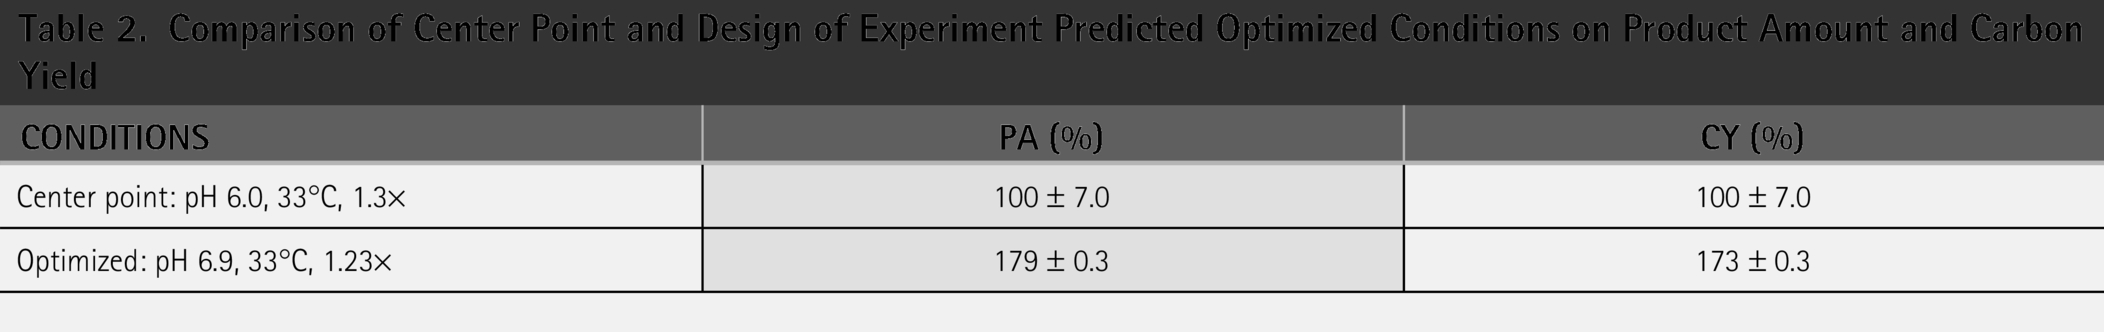
The 73% improvement in the CY results obtained corresponds to a reduction in the total cost of 20% with the substrate cost contribution going from 48% to 35% of the total cost. This is based on the assumption of a process, where the total cost of the raw materials is 60% of which 80% is the substrate cost.16,17 The 20% savings of the total cost would be a tremendous progression toward the economic feasibility of the product.
Choosing PA and CY as response variables and calculating them as above have some advantages and disadvantages. PA is a sensible response variable as it describes how much product is being produced throughout the fermentation. Maximizing a high product amount would also help in reducing the cost of the downstream processing. A conventional method of describing the PA is simply by multiplying the titer of the supernatant at the end of fermentation with the total volume of the whole broth. However, this will give an overestimation of the amount of product being formed as it does not account for the volumetric contribution of the biomass in the whole broth. The volumetric biomass contribution will affect the final quantity of product as the product is secreted into the supernatant. Biomass measurement of filamentous fungi is therefore usually determined using DCW. DCW can potentially be used to determine the volumetric biomass contribution by assuming that the Aspergillus contains 70% water, the cells are completely dried when weighed, and a whole broth density of 1 g/mL. 23 Using these assumptions, a more accurate PA can be estimated. CY is also a sensible response variable, as it describes the quantity of product being produced per quantity of sugar being used. The quantity of sugar being added to the fermenter is assumed to be completely consumed, and the different sugar components contributing to the total amount of sugar being added are sucrose in the batch media and the glucose monohydrate and maltose monohydrate mixture from the feed media. The advantage of keeping CY as quantity of product per quantity of sugar is to facilitate the cost estimation of the sugar, as it helps in answering the question of commercial feasibility of the product.
Discussion
Improving the product titer and the carbon yields of the fermentation are crucial in order to achieve economic feasibility of the process. In this work, optimization of BLG produced by an advanced A. oryzae production strain and fermentation protocol was obtained. Three independent variables (pH, temperature, and carbon-input) were investigated using a response surface design model to maximize the response variables product amount and carbon yield for production of BLG. The results were used to feed the model to generate both predicting formulas for surface plots to illustrate interactions between the independent variables and predicting new optimal process conditions of the three independent variables. The results showed how the interactions between the three independent variables affected product amount and carbon yield, especially the effect of pH, and the interaction between pH and carbon-input had a significant effect. The model also showed that the effect of temperature was negligible within the investigated range. New optimal conditions were deduced (pH 6.9, 36°C, and a carbon-input of 1.23×) and resulted in a significant increase in both the amount of product and carbon yield (79% and 73%, respectively), compared to the center point conditions.
Importantly, the 73% improvement in the carbon yield obtained in this work corresponds to a reduction in the total production cost of 20% with the cost contribution of the substrate going from 48% to 35%. A 20% savings of the total cost of production is a tremendous progression toward the economic feasibility of the product.
This level of optimization represents a remarkable improvement in BLG production levels for a commercial A. oryzae strain, demonstrating the usefulness of the approach used in this work to continue to lower the costs of production of precision fermentation products that are entering the market. This bears promise as the foundation for a new way to produce proteins in a sustainable way for a growing world population. Currently, BLG manufacturing using A. oryzae is being upscaled.
In this work, we demonstrate the use of DoE to optimize the production of recombinant BLG using A. oryzae. The results presented here represent both a valid optimization strategy and substantial progress toward an industrial process for the production of milk proteins on a large scale using well-developed production strains.
Authors’ Contributions
M.B.N. prepared the strategy and performed the work described in this paper. A.S.M. assisted on the strategy and the statistical data analysis. K.H. provided critical review of the data and J.A. participated in the strategy, discussions and manuscript preparation. All authors provided input to the manuscript writing.
Footnotes
Author Disclosure Statement
The authors declare no conflicts of interest.
Funding Information
This work was partially supported by the Innovation Fund Denmark, Grant no. 2040-00001B.
Supplemental Material
References
Supplementary Material
Please find the following supplemental material available below.
For Open Access articles published under a Creative Commons License, all supplemental material carries the same license as the article it is associated with.
For non-Open Access articles published, all supplemental material carries a non-exclusive license, and permission requests for re-use of supplemental material or any part of supplemental material shall be sent directly to the copyright owner as specified in the copyright notice associated with the article.