
Abstract
Gait analysis is an invaluable tool in diagnosing and monitoring human health. Current techniques often rely on specialists or expensive gait measurement systems. There is a clear space in the field for a simple, inexpensive, quantitative way to measure various gait parameters. This study investigates if useful quantitative gait parameters can be extracted from floor acceleration measurements produced by the input of foot falls. A total of 17 participants walked along a 115-ft-long hallway while underfloor mounted accelerometers measured the vertical acceleration of the floor. Signal-energy-based algorithms detect the heel strike of each step during trials. From the detected footsteps, gait parameters such as the average stride length, the time between steps, and the step signal energy were calculated. In this study, a single accelerometer was shown to be enough to detect steps over a 115-ft corridor. Distributions for all gait parameters measured were generated for each participant, showing a normal distribution with low standard deviation. The success of gait analysis using underfloor accelerometers presents possibilities in the widespread adaptation of gait measurements. The ease of installation and operation offers an opportunity to gather long-term gait measurements. Such data will augment current gait diagnostic approaches by filling the gaps between specialist visits.
Introduction
The objective of this work is to investigate the viability of a novel low-cost approach based on floor-mounted accelerometers for gait analysis. In the proposed approach, a section of a corridor is instrumented with accelerometers; these sensors detect the floor vibration resulting from footsteps of a participant walking in the corridor. The study takes place in Virginia Tech’s Goodwin Hall, which is instrumented with 225 highly sensitive accelerometers. One hallway is particularly dense with accelerometers with over 15 sensors mounted to measure vertical acceleration in a 115-ft span. The high density of sensors will allow methods with many or few accelerometers to be compared using the same data. Information learned from this test-bed could then be applied to inform future smart infrastructure layouts, the aim of which is to analyze the gait of the building’s occupants. This work expands the scope of human–building interaction by monitoring and keeping track of occupants’ health. The ability to reliably extract various gait features is investigated by studying the vibratory signals detected by the sensors. Signal-energy-based algorithms detect the heel strike of each step during trials. From the detected footsteps, gait parameters such as the average stride length, the time between steps, and the step signal energy are calculated. Distributions for these parameters are investigated, and the variation of these parameters between the left and right feet was compared for 17 participants in the study.
Background
Gait analysis plays a pivotal role in diagnosing and monitoring human health. 1 Traditionally, in a clinical setting, physical therapists and activity therapists observe deviations in gait parameters to assess the physical condition of patients. 2 Many studies have demonstrated the significance of human gait in monitoring human health with conditions such as diabetics, 3 rehabilitation,4,5 pathological diseases,6,7 neurological abnormalities,8,9 alcohol intake, 10 and aging. 7 Although the significance of gait analysis in monitoring human health condition is evident from years of research, penetration of technology into gait analysis has been mostly limited to research labs. 11 Specialists such as physical therapists evaluate the quality of gait by observing a participant walking in a clinic. Such a subjective approach to evaluating gait has many limitations including keeping track of minor changes in gait over time and estimating the progress of intervention techniques.12,13 Recent technological advancements have made it possible to quantitatively monitor the kinematic motion of humans. Multiple three-dimensional (3D) motion capture systems accurately capture human kinematics to precisely track the marked locations over time. 14 Such measurement techniques determine the orientations and trajectories of multiple joints in the human body that provide the capability to quantitatively monitor multiple features of human gait. Since establishing such a system in a clinical setup is very expensive and time-consuming to test each participant, 15 this has given rise to the development of low-cost wearable or nonwearable technology focused toward gait analysis. Techniques involving image processing with high-speed cameras 16 and Microsoft Kinect 17 have shown considerable promise in observing some gait features in a lab setting.
In addition, multiple studies have also shown that wearable inertial sensors have the potential to detect falls and walking patterns.18–20 Although most of these techniques do not provide the complete kinematic information that a 3D motion capture system does, they are easier to implement outside of a laboratory setting. This allows monitoring of useful features more often than relying on time-consuming and invasive full motion capture systems. Previously, buildings instrumented with accelerometers were also used to detect footsteps, localize events,21–23 and classify various sources of vibrations.24,25 This work is distinct from those performing gait analysis with inertial sensors because it does not rely on a wearable device. Wearable devices suffer from the necessity of the user to remember to use it and make sure it is charged and operating. 26 In this work, gait parameters are estimated from sensors which are a permanent fixture in the building, and therefore are not reliant on the user to ensure they are functioning properly. This work is also distinct from previous building-mounted sensor investigations. Previous work on instrumented buildings addressed other challenges in managing and analyzing continuous streams of data generated by floor-mounted accelerometers. Goodwin Hall is an instrumented test-bed that has allowed researchers to develop algorithms to monitor the condition of the building, 27 to develop localization algorithms for noisy-dispersive environments, 21 and to study human–structure interaction for classification. 24 This work takes the study of human–structure interaction a step further and seeks to use building-mounted sensors to detect occupant health by translating footsteps into gait parameters.
Methods
This work will present a procedure for using one or multiple underfloor accelerometers to extract gait parameters from real measurements of 17 participants walking down a hallway. First, trials were run for each participant at three different speeds. The acceleration measurements were then used to detect steps, and the times of these detected steps were used to extract the gait parameters.
Participants
A total of 17 healthy participants aged between 18 and 27 took part in the study, including 9 female and 8 male. The participants’ mean height is
Participant information for all 17 participants.

Data from participant 9 and 17 were discarded as a result of high noise in the data.
Procedure
This experiment was conducted at Goodwin Hall, a building which is instrumented with 225 high-sensitivity accelerometers on the Virginia Tech campus. A layout of the location of the sensors in a fourth-floor hallway is shown in Figure 3(a). In this study, participants walked along a marked 115-ft portion of this hallway while 17 accelerometers which are permanently mounted under the floor of the hallway recorded acceleration data at 32,768 samples/s. For each trial, participants lined up at the starting line. A hammer strike to the floor marked the beginning of the trial, and the participant began walking with their dominant foot first. As the participant passed the finish line, another hammer strike marked the end of the trial (the magnitudes of the hammer strikes are easily distinguished from any steps or noise and are used to break apart the data sets). After completing one direction, the participant lined up at the new start line and the process was repeated. A total of four trials were recorded for each participant at three self-selected speeds: a walking speed, a brisk walking speed, and a running speed. Participants performed all trials in socks to remove the effect of shoe sole on the acceleration responses. Sample data from a trial are shown in Figure 3(b). All the trials were conducted during weekends and evenings so that the noise from ambient activity in the building was minimized.
Data analysis
As a participant walked toward an accelerometer, the amplitude of the floor vibrations due to heel strikes gradually increased to a maximum and then reduced as the participant moved away. This is shown in Figure 3(b) and is expected as the waves propagating away from the heel strike lose energy exponentially with distance. 28 As a result of this phenomenon, not all accelerometers may capture all heel strikes in a 115-ft-long hallway.
Step detection
Previous literature has shown that seismic sensors such as accelerometers perceive heel strikes as impulse contact and toe slaps as sliding (friction) contact with the floor29–31 As a result, from these studies, a distinctive peak in the vibration signal has been observed during each heel strike. There are many approaches to detect heel strikes on such vibration signatures that are typical of a heel strike. 32 In this work, a signal-energy-based custom algorithm identifies steps by searching for peaks in energy. The highest acceleration energy occurs immediately following the heel strike. Finding where all the energy peaks are in the signal gives the approximate timing of the beginning of each step. An example of an entire acceleration signal with steps detected is included in Figure 3(b).
The algorithm broke up the acceleration signal from a single sensor into windows approximately 0.025 s long. The root mean square (RMS) value represents signal energy as a measure of acceleration in a window. The ratio of each window’s RMS was taken with the window directly preceding it to find the instant when a heel strike occurs. A heel strike is a high-energy event, which is directly preceded by very low signal energy noise. Therefore, the ratio of a window’s energy to that of the window before will be high at each heel strike. Figure 1 shows an example acceleration signal containing two steps, along with the window energy ratio over time. The ratio represents the signal-to-noise ratio (SNR) of the signal, and the steps were found by searching for peaks in the SNR and correlating it to the time vector. Since each participant started with their dominant foot, each heel strike can be identified as a left or a right foot impact.
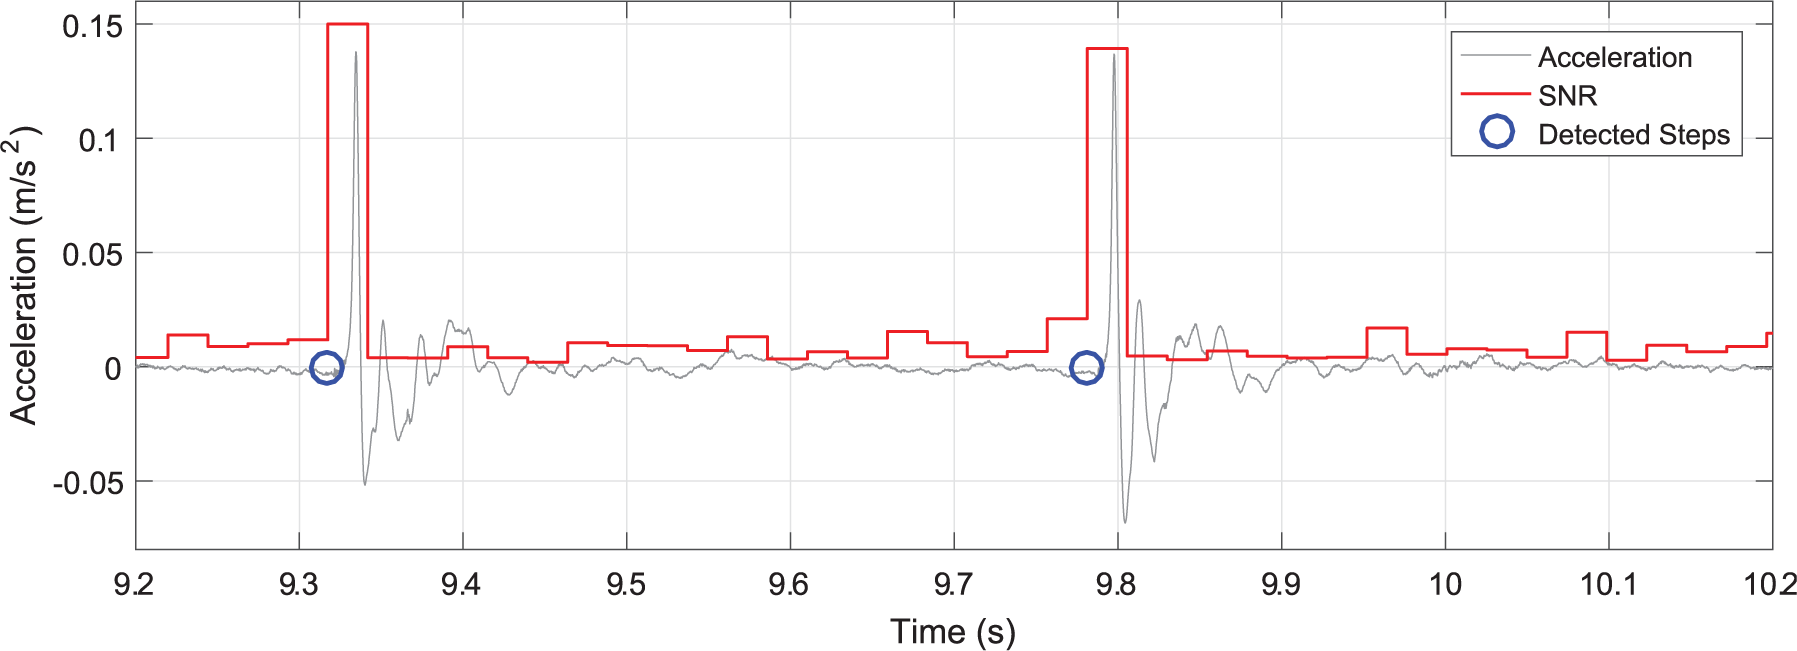
An example of an acceleration measurement containing two steps, the corresponding signal-to-noise ratio (SNR), and the detected step times based on the peaks in SNR.
A traditional gait analysis method for detecting the time of a heel strike uses a force plate to measure when the force from a foot passes a certain threshold. No force data are available for the same walking trials used in this work, meaning that the step detection method in this work cannot be directly compared to traditional gait analysis methods with footstep data. However, a validation of using a floor acceleration measurement to detect when an impact force begins was carried out with an instrumented hammer. Figure 2 shows the force profile of an instrumented hammer as it is used to strike the ground, along with floor vibration measurements directly next to the impact location and at a location 10 ft away. As hypothesized, the high acceleration energy used in the step detection algorithm begins as the force from the impact is applied. Even the measurement location 10 ft away showed an increase in vibration energy about 5 ms after the beginning of the impact. This delay is dependent on the wave speed in the floor. Based on this instrumented hammer validation, acceleration-based detection can match force-based detection within a few milliseconds. In fact, the 0.025-s window chosen for the step detection algorithm corresponds to an impact about 50 ft away from a given sensor.
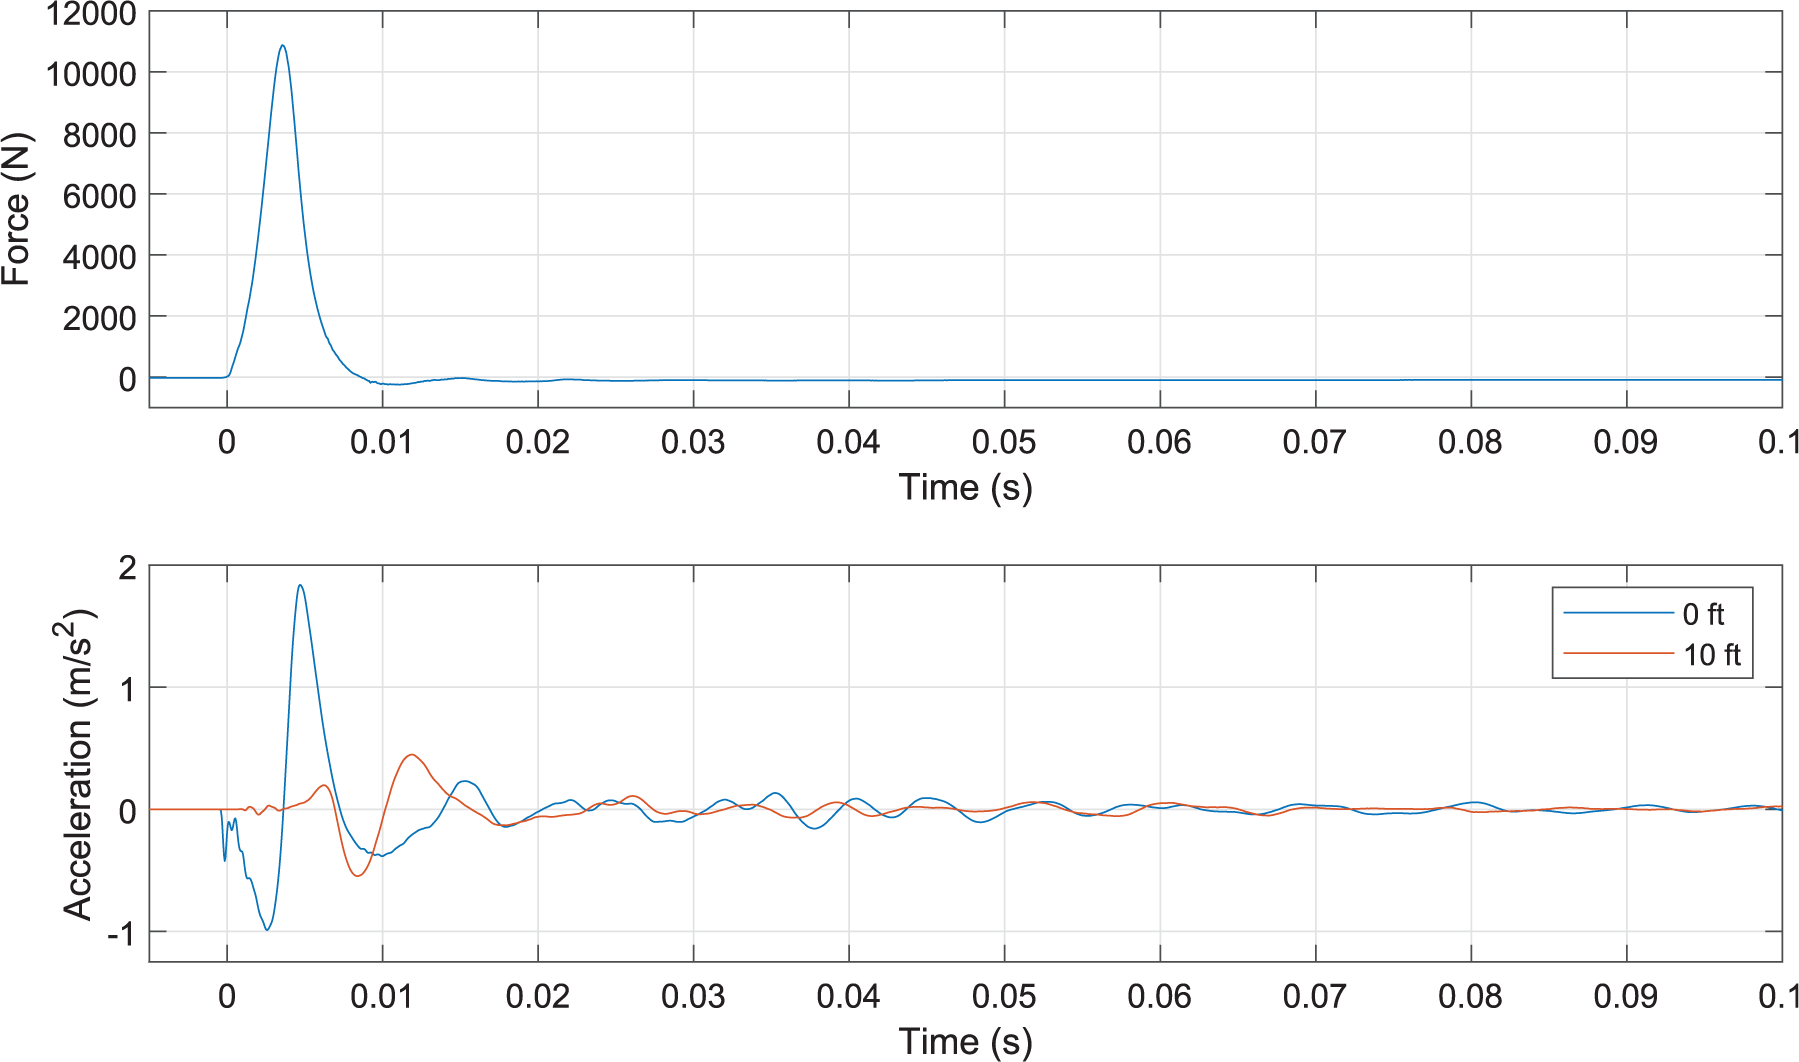
Alignment of force measured by an instrumented hammer and acceleration measurements 0 and 10 ft away.
Parameter estimation
Once the steps were located, the step interval or cadence was estimated from the times between consecutive steps. The cycle time between consecutive left or right foot heel strikes was calculated. The average step length was estimated by dividing the length of the corridor by the number of steps taken by the participants. This step length was normalized by the leg length of that participant. 33 Since this number is an average, any uncertainty comes from knowing the number of steps within plus or minus one step. In this work, the average step length is approximated by taking the number of heel strikes and the length of the hallway into confidence. However, while the traditional gait analysis instrumentation such as 3D motion capture keeps track of the instantaneous step length, the current floor vibration approach estimates the average step length. The average walking speed was also estimated by taking the ratio of the length of the corridor and the time of the trial. A measure of the step energy was calculated similarly to the step detection approach: the RMS of a window spanning between heel strikes. This step signal energy was also normalized with respect to the noise floor of the signal.
Signal processing of a time window
Although Goodwin Hall has a dense network of floor-mounted accelerometers, it is not always feasible to monitor and analyze footstep data from multiple sensors. In addition, to develop a simple and a cost-effective measurement device, it is important to investigate if a single sensor can extract useful gait information. Three approaches were adopted to study the need for multiple sensors in step detection: Approach 1—using data from one sensor in the middle of the hallway (highlighted in Figure 3(a)), Approach 2—using data from all 17 sensors, and Approach 3—using data by selecting the “best sensor” for each step detected. For a given step, the best sensor among the 17 available sensors was the sensor with the highest step signal energy. Therefore, if there are one hundred steps detected, Approach 3 will contain one hundred step detection times, each from 1 of the 17 available sensors.

(a) Diagram of all sensors along the hallway used for testing and (b) an example of an acceleration history from a single trial with all steps detected. The trial comes from the sensor marked in blue in (a).
Toward the start and the end of the trial, participants were either gaining speed or slowing down, leading to artificial variation in step intervals. In addition, low-force foot impacts may result in sensors measuring acceleration signals that are under the noise floor of the sensor, especially when the location of the impact is far away from the sensor. Therefore, along with data from the whole trial, data were also considered from the middle half of the trial. For example, if there were 100 steps in the whole trial, the half trial excludes the first 25 and the last 25 steps, only considering the middle 50 steps. In this study, the results from the whole trial have the complete data set from the start line to the end line.
Results
Sensor selection
Figure 4 shows the distributions of step intervals (time between a step and the following step) for two different participants: Participant 12 was a tall male who was walking at a brisk pace, while Participant 16 was a short female who was traveling at a walking pace. These two cases were chosen because the steps in the trial for Participant 12 created a higher magnitude of acceleration (due to participant height, weight, and speed), while the trial for Participant 16 had a less acceleration magnitude. Comparing methods for both of these cases will ensure that the step detection method works for trials with high and low SNRs. For each participant, all three approaches were used to find the distribution of step intervals over the full trial data and the half trial data.

Step intervals for one trial each of Participant 12 (left) and Participant 16 (right). (a) and (b) correspond to Approach 1, (c) and (d) correspond to Approach 2, and (e) and (f) correspond to Approach 3. The distributions using each approach are shown as histograms, while normal probability distribution fits to each histogram are also shown for reference. Beside each fit are the mean,
Parameter estimation
Once the steps were located, all gait parameters were estimated and are tabulated in Table 2. The step length and step interval parameters are shown in Figure 5, with female participants on the left and male participants on the right. The data from the single sensor (Approach 1) were used to estimate these gait parameters from all trials. For each participant, the step interval estimates and the step length estimates for all trials were averaged at each of the three speeds. The error bars for the step interval estimates represent the standard deviation of the distribution. In Figure 5, the parameters for each participant at each speed are shown connected by lines. The size of each marker in Figure 5 represents the highest ratio of the step signal energy to noise floor for that participant at that speed.
Results for each participant at each speed.

Cadence is the time between steps in seconds, L is the average step length in inches, and v is the average velocity of the participant in feet/s.

Step intervals and relative step lengths for all participants: (a) females in the left plot and (b) males in the right plot. Marker size is related to the maximum energy in a step from each participant.
Leg comparisons
Figure 6 shows the cycle time and step signal energy for the left and right legs of Participants 12 and 16. The cycle time and step signal energy were calculated for all speeds, and the mean estimates and the corresponding standard deviations are presented along with the fitted distributions. Figure 6(a) and (c) shows visual comparison of the cycle time estimates and spread for the left and the right feet. In addition, to quantitatively monitor the acceleration signals generated due to the force of the step impacts, Figure 6(b) and (d) shows comparison of the resulting ratio of the signal energy to noise floor for the left and the right feet.

Comparison of cycle times and step signal energy for Participant 12 (a, b), and Participant 16 (c, d), respectively. Walking trials are shown in blue, brisk walking in orange, and running in yellow. Fitted normal distributions are plotted for cycle times along with the mean,
The distributions for cycle times were calculated for each foot of all participants at each speed. A two-sample t test was carried out to compare the left and right feet at each combination. The null hypothesis was that the two distributions had equal means and variances. The results of all cycle time distributions and two-sample t tests are shown in Table 3.
Results for right cycle time,

Discussion
The results allow comparisons between different methods using different number of sensors. The trend of patterns such as step length increasing with walking speed can also be seen and validated from previous research.
Sensor selection
As shown in Figure 4, when the whole trial was used, there is a larger spread (standard deviations of 0.048, 0.039, and 0.034 s for Participant 12 for each method) compared to when the middle half of the trial was used (0.013, 0.025, and 0.015 s for the same trials). The standard deviation of the half trial is less than the full trail because the data artifacts resulting from starting or ending the trial are avoided. The variation of the step interval estimates based on half interval is higher when data from all 17 sensors are considered as they included estimates from sensor farther away with accelerometer signals containing higher noise. With data from the half trial, there is no significant difference in estimating step interval values from the single sensor (Approach 1) and the data put together by choosing the best sensor for each step (Approach 3).
Using these observations, it is clear that in this application only one sensor is needed over the course of the middle half of the trial. Using only one sensor is also the simplest case and easiest to implement. Therefore, Approach 1 was chosen to report all statistics on step interval or stride cycle time in this work. It should be noted that the dynamics of the floor on which the sensor is installed will have an effect on how far away from that sensor it can accurately detect a footstep. In this case, one sensor was used in the middle of a span of about 50 ft. Further modeling and testing would be needed to extrapolate these results to other surfaces.
Parameter estimation
As shown in Figure 5, as each participant traveled at a faster pace, the step interval time went down and the relative step length went up as expected. This shows that, to go faster, all participants took longer strides at quicker intervals which agrees with previous research on walking speed patterns in adults. 34 Another observation is that as participants traveled faster, there was more signal energy in their steps, represented as the size of each marker, where larger signifies more energy. This is also expected as more force is being imparted into the floor as the participants are running as compared to walking. 35 Although in this study the extracted gait parameters were not compared to another measurement system, the agreement with accepted trends from the literature shows promise for this method.
Leg comparisons
A powerful opportunity provided by this method is the ability to quantitatively compare gait parameters for each leg. Having trials containing 20 or more steps allowed comparisons between legs to be carried out quickly. In a healthy participant, it would be expected that there should be no difference in the time between consecutive right foot steps or consecutive left foot steps (cycle time). 36 The cycle time distributions presented in Figure 6 for each foot have equivalent means down to the hundredth of a second for all speeds. The standard deviations are also very similar between each foot for all cases. Furthermore, out of all 52 combinations of participant and speed, the lowest p value from the two-sample t tests was over 0.5. Therefore, the null hypothesis is never rejected unless a very high threshold is chosen. Since the null hypothesis was that the two distributions have the same mean and variance, this means that there is no statistically significant difference between the cycle times for the left and right feet of any participant.
Similarly, it would be expected that there is no difference in the forces imparted on the floor by each foot. No difference in the forces imparted translates to no difference in the signal energy measured in the floor acceleration response induced by each foot. As shown in Figure 6, there is more spread in the step signal energy distributions because it is sensitive to the distance between the step impact and the sensor as can be expected due to the structural dynamics of the floor. Even with this limitation, the mean of the distribution for step signal energy is still very similar in all cases between the two feet. The standard deviation was not considered for step energy because the distributions are so heavily skewed.
Having demonstrated that a healthy participant has little or no difference between cycle time and step energy between their feet, the question remains if the inverse is true. A participant with a gait abnormality such as hemiplegic gait (where one leg is favored and takes less weight) should show clear asymmetry in gait parameters between the two legs. 37 In future studies, the ability of the present approach to detect gait abnormalities will be considered.
Future work
A novel method for estimating gait parameters using only structurally mounted sensors has been presented and validated using an instrumented hammer impact. In the future, simultaneous measurements using structural sensors and traditional gait measurement systems will be used to further validate this method. Additional future work will investigate if this method is sensitive enough to detect asymmetry in gait parameters in participants with a known gait abnormality. A strength of this method is that measurements over long time spans can be collected and compared since the sensors are always set up and can acquire data at any time. Therefore, another future study could investigate if continuous data acquisition over the course of days or weeks can identify when a single person is in the hallway and extract the shown gait parameters automatically.
Conclusion
This work has demonstrated that certain gait parameters can be extracted using measurements from floor-mounted accelerometers. In the hallway which was used, a single sensor was able to accurately detect the time of step occurrences over about 50 ft centered around the sensor. After detecting the occurrence of steps, step intervals, average step length, and step energies can be estimated from the acceleration time signals. Distributions for these parameters were investigated, and the variation of these parameters between the left and right feet was compared. As expected, no statistically significant difference was found between the cycle times of the two legs.
Although this method of gait analysis shows promise, it is not without its limitations. Currently, only the heel strike event can be detected. The timing of the toe-off event is difficult to distinguish in the floor acceleration signal, meaning that at the current time this method cannot find stance time or swing time, only the entire time between the beginning of steps. Despite these limitations, there are clear advantages. Needing only a single sensor, it can be implemented in a cost-effective manner. It also does not require any special setup and therefore can be readily implemented on any floor. It is also not constrained to a short distance: this work shows that a single sensor allows trials up to 50 ft, while more sensors could increase that distance. Longer trials allow data to be collected more quickly since there is less time spent resetting and changing directions. Compared to traditional methods of gait analysis, this method requires much less data analysis and processing time.
Floor-mounted accelerometers present a novel method to approach gait analysis. The cost-effectiveness and ease of implementation show promise. Once set up, the system also requires little post processing of data and can automatically generate distributions of gait parameters and comparisons between feet.
Footnotes
Acknowledgements
The authors wish to acknowledge the support as well as the collaborative efforts provided by our sponsors, VTI Instruments, PCB Piezotronics, Inc., Dytran Instruments, Inc., and Oregano Systems. The authors are particularly appreciative for the support provided by the College of Engineering at Virginia Tech through Dean Richard Benson and Associate Dean Ed Nelson as well as VT Capital Project Manager, Todd Shelton, and VT University Building Official, William Hinson. The authors would also like to acknowledge Gilbane, Inc., and, in particular, David Childress and Eric Hotek. The authors are especially thankful to the Student Engineering Council (SEC) at Virginia Tech and their financial commitment to this project. The work was conducted under the patronage of the Virginia Tech Smart Infrastructure Laboratory and its members. E.K. and V.V.N.S.M. designed and conducted the experiments and analyzed the results. All authors reviewed and edited the manuscript.
Handling Editor: Oresti Banos
Declaration of conflicting interests
The author(s) declared no potential conflicts of interest with respect to the research, authorship, and/or publication of this article.
Ethical approval
The institutional review board at Virginia Tech approved the study (IRB 15-681).
Funding
The author(s) disclosed receipt of the following financial support for the research, authorship, and/or publication of this article: The authors would like to acknowledge the support received through the John R. Jones III Faculty Fellowship. This work was supported in part by the National Science Foundation via grant no. DGE-1545362, UrbComp (Urban Computing): Data Science for Modeling, Understanding, and Advancing Urban Populations. Any opinions, findings, and conclusions or recommendations expressed in this material are those of the authors and do not necessarily reflect the views of the National Science Foundation.
Informed consent
All participants provided consent before taking part in the study.