
Abstract
Gait patterns of humans and humanoid robots are often described by analysing changes in angular rotation of hip, knee and ankle joints during one gait cycle. Each joint displays specific behaviour and irregularities of the gait pattern could be detected by measuring displacements from the normal rotation curve, while small deviations of individual gait characteristics are usually not easily detected. In this paper, an advanced gait analysis method is proposed, which incorporates analysis of angular data and its derivations of hip, knee, and ankle joints, presented in the phase plane. The gait kinematics was measured using a system based on active markers and fast digital cameras. The experiment included measurements on thirty healthy, barefoot humans while walking on a treadmill. We also simulated types of irregular gait, by measurements on subjects wearing knee constraints. The new kinematic parameters which are introduced clearly indicated the discrepancy between normal, healthy gait trials and irregular gait trials. The proposed gait factor parameter is a valuable measure for the detection of irregularities in gait patterns of humans and humanoid robots.
1. Introduction
Humanoid robotics includes a rich diversity of projects where perception, processing and action are embodied in a recognizably anthropomorphic form in order to emulate some subset of the physical, cognitive and social dimensions of the human body and experience [1]. Humanoid robotics is not an attempt to recreate humans. The goal is not, nor should it ever be, to make machines that can be mistaken for or used interchangeably with real human beings. Rather, the goal is to create a new kind of tool, fundamentally different from any we have yet seen, because it is designed to work with humans as well as for them. Humanoids should interact socially with people in typical, everyday environments. One of the crucial characteristics of humanoid robots is bipedal walking. For nearly the whole of the 20th century, bipedal robots were very difficult to construct and robot locomotion involved only wheels, treads or multiple legs. Giving legs to a robot instead of wheels attributes a lot more to it than just resemblance to a human being. Unlike ordinary mobile robots, humanoids have the unique ability to cross obstacles by stepping over or upon them [2]. A robot system aiming to simulate the human gait must receive gait information that allows the system to mimic this action [3]. Therefore, gait analysis has not only proved to be relevant to research fields like biomechanics, sport analysis and rehabilitation engineering, but also to the field of robotics, especially humanoid robotics [4–7].
The design of robotic bipedal gait simulations and the successful implementation of these movements in a mechatronic structure requires comprehensive techniques for the analysis of the kinematics and kinetics of the human gait. Some of these techniques are oriented toward detections and analysis of irregularities in human gait with the aim of providing diagnostic tools to clinicians in the rehabilitation process. These techniques could also be of great importance in humanoid robotics, because they could provide the tool for detection of irregularities in robot bipedal walking. Afterward, the controlling process of the robot's walk could be improved with the aim of overcoming the previously detected irregularities.
Therefore, the research discussed in this paper presents an effort to develop and evaluate the method for detection of irregularities in the human (or robotic) gait. We propose new kinematic parameters which can clearly indicate where in the gait cycle the discrepancy between normal (healthy) and irregular gait occurs. We measured gait kinematics by using a system based on active markers and fast digital cameras. From the spatial positions of measured markers we calculated rotation angles, angles velocities and accelerations for the hip, knee, and ankle joints. Our experiment included measurements on thirty healthy, barefoot humans while walking on a treadmill. In order to simulate an irregular gait, we performed measurements on subjects wearing knee constraints.
This paper explains our proposed method in detail. It is organized in the following sections. In Section 2 we examine some research related to human gait analysis. Evaluation of our method is analysed in Section 3. The obtained results are presented in Section 4, while the discussion, conclusion and future work ideas are stated in Section 6.
2. Research Related to Human Gait Analysis
An experienced clinician or specialist can make a fast evaluation if a limp or asymmetry is present in the patient's gait. Those evaluations are mainly subjective and some deviations in results have to be expected for identical gait examples. However, even with the assistance of advanced gait analysis systems, objective quantification of the amount by which an individual's gait differs from the normative still remains difficult. There is also an interest in a method which could produce the unique parameters to indicate whether a person's gait falls within the range of a normal gait, and quantify deviation from a predefined normative. The mean values of kinematics data displayed in the form of time-varying curves are provided by Winter [8] and Stoquart [9], both at several walking speeds. Their analyses are basically qualitative and the conclusions about someone's gait are derived only by observing if the individual's kinematics parameters fall within predefined normative bounds, while the interactions between kinematics parameters are not analysed. In clinical practice, gait is analysed visually or by using simple questionnaires which produce mainly subjective results [10]. Advanced motion analysis methods are used to carry out quantitative gait analysis and evaluate the impact of age, gender, anthropometric data or other variables on gait characteristics [11–12].
The Gillette gait index (GGI), defined by Schutte et al. [13], has become one of the most popular indices in paediatrics and clinical routine, and is used to assess therapeutic outcomes for normal and pathological subjects [14–17]. The Gait Deviation Index (GDI) is a new multivariate measure of overall gait pathology [18]. It is defined as a scaled distance between the 15 gait feature scores for a subject and the average of the same 15 gait features. The GDI offers an alternative to the GGI as a comprehensive quantitative gait pathology index, and is replacing the GGI index in practice.
Another proposed gait index is the Gait Profile Score (GPS), which is a single index measure that summarizes the overall deviation of kinematic gait data relative to normative data [19–20]. The GPS can be decomposed to provide Gait Variable Scores (GVS) of nine key component kinematic gait variables, which are presented as a Movement Analysis Profile (MAP).
While all the above-mentioned methods are useful in the detection and classification of gait irregularities, their main disadvantage is the inability to detect and indicate the presence of an irregularity inside the gait cycle. The purpose of this study was to propose several newly defined kinematic parameters which could be used in clinical practice, in sports training or in humanoid gait analysis, by detecting the irregularity itself and the intervals of the gait cycle where the irregularity occurs.
First, gait-related research concentrated on over ground walking trials [8–21]. However, due to limited laboratory size (walking distance), this type of measurement was restricted to only a few steps. Some researchers have realized that large numbers of steps can be recorded and analysed by systems based on motorized treadmills [22–23]. Various studies reported that there were small differences between walking on treadmill and walking over ground [24], while numerous benefits were observed when the treadmills were used, such as: steady steps performed at constant velocity, subject not forced to follow a straight line, unlimited number of recorded gait cycles, etc. [23–25]. Therefore, our study primarily involved measurements on subjects walking on a treadmill.
Oeffinger [26] analysed if a difference exists in the kinematics and temporal spatial gait data of children walking with and without shoes. The major difference noted was the increase in stride length with shoes, while minimal changes in kinematics were observed and did not appear as clinically significant. It is believed that gait analysis for subjects not wearing shoes is sufficient for most clinical studies and additional assessment, while wearing shoes is not necessary. Hence, our study is performed on subjects not wearing shoes, thus eliminating the possible issues caused by subjects wearing different types and sizes of shoes. In order to analyse the irregular gait, and to identify in which gait phases the irregularity is the most expressed, we simulated the irregular gait by using an external knee constraint.
Researchers suggested that the relationship between hip, knee and ankle rotations are easily visualized and analysed in phase plots [27–28]. Multi-dimensional phase plots describe joint angular data, where the data of each joint is arranged on separate axes. The advantages of these plots are that they are presented as a shape, where changes of individual style of locomotion are easily observable [28]. If cyclic movement (gait) is analysed, phase plots form closed curves, where data from each individual cycle is comparable with others. Similar 3D plots were used for understanding differences between astronauts' gait on a treadmill at zero gravity and 1G gravity, advising designers to manufacture treadmills for training astronauts for long-range missions [27]. Data visualized in described multi-dimensional plots could be angular kinematic data of several joints and their first and second derivations. The main focus of phase plots is in the sagittal plane, however many deviations show themselves out of the sagittal plane [29]. If the measurement system is capable of measuring segment's 3D kinematics, it is advised to use 3D angular data. Zanchi developed a methodology for normal gait recognition and evaluation in which all kinematics data have been presented in the phase plane using phase plots [28]. Presentation of human or humanoid locomotion joint kinematics by using phase plane plots provides more information of the joint kinematics and also gives more accurate evaluation of gait events. Uses of similar phase plots were suggested in this paper, from which new kinematics parameters were derived.
3. Methods
3.1 Participants
Thirty male and female volunteers, all students and employees from The University of Split aged between 22 and 36 years (mean = 25.1 STD 5.2 years), were recruited for the study. The purpose and procedures used in the study were thoroughly explained to the subjects and informed consent was obtained. All subjects were healthy and did not suffer from any disease or malformation which could affect their motion patterns. All subjects were able to walk without walking aids and without shoes on a motorized treadmill.
3.2 Experimental Setup
The 3D gait kinematics was measured using the system constructed “in-house”, consisting of a pair of high speed digital cameras, active LED markers and a PC, Figure 1. The cameras used were Basler 602fc fast digital cameras with Fujinon 12.5 mm HF12.5HA-1B lenses. These cameras are capable of feeding the computer raw video with 656 × 490 pixel resolution at a speed of 100 Hz over a high speed fire-wire interface.

Experimental setup: the motion-capturing system consisted of two cameras, a set of ten active markers attached to the subject, treadmill and PC.
Ten active markers were positioned on the subject's specific anatomical landmarks, as shown in Figure 1, which allowed computation of 3D angular displacements of hip, knee and ankle. The active markers used in the experiment were assembled using a small 3.0 mm white LED with maximum light intensity of 5 Cd. LEDs were inserted in specially prepared housing which allows easy attachment to the human body surface. Flexible foot construction was prepared with four embedded markers, in a way that could be used regardless of foot size or shape. Markers were powered with a battery pack contained inside a small box and placed on the subject's belt. Cables were placed in a manner in which they did not obstruct natural movements or limit the joints' range of motion, and were secured using Velcro tape. The treadmill used in the measurements was a Pro Supra motorized treadmill, belt type, with a walking surface of 40 cm × 110 cm. Treadmill allowed speed selection with increments of 0.1 km/h (4 – 14 km/h).
Sadeghi et al.'s study [30] reviewed the work done over the last few decades in demonstrating whether or not the lower limbs behave symmetrically during gait. The authors stated that gait symmetry has often been assumed, in order to simplify data collection and analysis during normal gait. As setup and available equipment (two cameras) allowed us to measure gait kinematics from only one side, gait symmetry during normal gait has to be assumed, while simulated gait irregularity is generally manifested on a limbs where the external constraint is attached.
A flow chart explaining the measurement and gait analysis procedure is shown in Figure 2. Cameras lens distortion was first removed by following the procedure described by Tsai [31]. In the next step, the cameras' calibration matrices (P1 and P2) were obtained using a large calibration object with 12 embedded markers at positions known with 0.02 mm accuracy.

Flow-chart of the gait measurement and analysis procedure
After obtaining the cameras' calibration matrices and markers' centre location in the cameras image, the exact 3D position M(x,y,z) of all markers is reconstructed using the direct linear transformation (DLT) method [32].
The tested accuracy of our system in ideal conditions was 0.2 mm (STD 0.15 mm), while measuring in 4 × 2 × 2 m volume, which is sufficient for analysing body segments' movements during a treadmill gait. To achieve the referred accuracy, an algorithm for sub-pixel marker centre detection was developed and integrated into the system. Building, testing and evaluation of the presented system were explained in the author's paper [33].
Before performing gait measurements, subjects were instructed to stand in the anatomically neutral position within a calibration frame, while each segment's neutral position and marker placement relative to segment centre were acquired. The subjects were instructed to walk continuously on a treadmill at their most comfortable speed (mean 5.2 km/h, STD 0.7 km/h). Sequential collection periods (1 min) for each subject provided 40–60 step cycles and were performed three times in total. In order to simulate an irregular gait pattern, during the second phase of measurements the subjects were instructed to walk with artificial right knee constraints. This procedure produced reduced mobility of a selected joint, thus causing an irregular gait pattern. During measurement all subjects faced the direction of the lab's positive X-axis, Figure 1.
3.3 Data Processing
All measurements were saved as individual video files, which were then rearranged and prepared using the VirtualDub video editing tool. Video analysis, marker detection and tracking, kinematic analysis software, and all graphical representations of the results were done by using the Matlab software package. The X, Y and Z positions of all markers were firstly smoothed by using the zero-lag Butterworth filter with a cut-off frequency of 6 Hz [21,34]. The first six harmonics of marker position signal (at 5 km/h) contain 99.7 % of energy, thus use of a 6Hz cut-off frequency is considered to be adequate.
Missing or invalid marker data in some of the recorded gait cycles did not allow their inclusion in the study; however, for all subjects at least three series of minimum twenty valid gait cycles were obtained.
The gait cycle was defined as the time period between two consecutive foot-ground contacts. On a treadmill, the foot is placed on a constantly moving surface, which results in predictable changes in the position of foot markers at foot contact [35]. In our lab coordinate system, the X coordinates of a heel marker changes from moving in a positive X direction during swing to a negative X direction at each heel strike. Therefore, the X component of the velocity vector at this instant changes from positive to negative, as well. This frame at which the foot begins moving backward on the treadmill is labelled as heel strike [35]. At increased gait speed, or in the case of irregular gait, the foot may move backward at the end of the swing before hitting the ground. Hence, a different definition for gait cycle must be considered for each example separately, by visual inspection and detection of gait events frame by frame. We adopted the division of the gait cycle into eight subsequent phases, which are sufficiently general to be applied to any type of gait [36]: Initial contact (0% of gait cycle), Loading response (0 – 10% of gait cycle), Midstance (10% – 30% of gait cycle), Terminal stance (30% – 50% of gait cycle), Preswing (50% – 60% of gait cycle), Initial Swing (60% – 70% of gait cycle), Midswing (70% – 85% of gait cycle) and Terminal Swing (85% – 100% of gait cycle).
The trajectories of hip, knee and ankle flexion-extension angles, angle velocities, and angle accelerations were calculated, where the seven-link body model was used [8]. All data were resampled to 100 samples and presented against the percentage of the duration of gait cycle. By resampling angular data with the fixed number of samples, all measurements are time invariant and not affected by gait speed. In order to establish the normative of treadmill gait, we calculated mean trajectories and their standard deviations of hip, knee and ankle angles, angle velocities, and accelerations, over all subjects and three series of twenty gait cycles per subject, walking barefoot, and without knee constraint.
We also presented the kinematics of each joint in a form of phase plots, closed 3D curves that portray the relationship between joint angle, angular velocity and acceleration. In order to compare an individual, potentially irregular gait trial with the normative, and to detect and evaluate the difference between irregular and normal gait pattern, we propose the new kinematic parameter, En. Parameter is based on the calculation of Euclidian distance between points in the phase plot of the observed gait cycle, and in the normative phase plot, and this defined as follows:

where:
n: data samples (n = 1 ‥100)
i: ith joint (hip, knee, ankle)
xn_i, ẋ n_i, ẍn_i: ith joint angle, angle velocity and angle acceleration, respectively, of the observed gait cycle
Xn_i, Ẋn_i, Ẍn_i: ith joint angle, angle velocity and angle acceleration, respectively, of the normative gait cycle Xm,Ẋm,Ẍm: highest value of angle, angular velocity and acceleration of normative ith joint's gait cycle together with their standard deviations.
In the calculation of Euclidian distance En_i, numerical values of angles, angular velocities and accelerations are normalized according to the maximum value of normative gait cycle with added standard deviation. With this approach, equally weighted scaling in all dimensions of the phase plot is achieved. Higher deviations of kinematics data of normative gait allow higher deviations of analysed gait kinematics data. As the final results, the trajectories of En for hip, knee and ankle are obtained. En is a set of non-dimensional numerical values, where smaller values indicate joint behaviour close to normative, while larger values indicate significant disparity.
Figure 3 presents the relationship between hip, knee and ankle angle during one gait cycle, for normative data of normal treadmill gait (dashed curve) and gait trial of one, arbitrarily chosen subject (full line). The presented trajectories are 3D self-closed curves, with their central point (denoted as point C on Figure 3) selected as mean values of hip, knee and ankle angles of normative data. For each nth sample of gait cycle (resampled to 100 samples, n=1‥100) we draw the vector pointing from the central point of the normative curve (dotted red line in Figure 3) to the normative curve point which corresponds to the nth sample of the gait cycle. The same procedure is performed for the curve obtained for the gait trial of an arbitrarily chosen subject. The angle formed between two vectors is a new kinematic parameter denoted as phase shift (PSn). Newly introduced parameter PSn indicates the phase difference between the hip, knee and ankle angle trajectories for the normative and particular gait trial. The trajectory of phase shift plotted against the percentage of gait cycle shows us if gait events of a particular subject are shifted according to the gait cycle of the normative gait.

Hip angle – knee angle – ankle angle trajectories for normative gait cycle (dotted red line) and gait cycle measured on arbitrarily chosen subject (full blue line). Phase shift between two different gait cycles is denoted as PSn.
In order to establish a unique kinematic parameter which would indicate difference between normative gait trial and particular gait trial, we propose the third parameter, the gait factor, GFn, defined as:
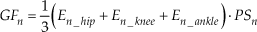
Equation (2) allowed flexible definition of gait factor, where the examiner may expand or reduce the number of analysed joints, regarding available measurement data. Factor 1/3 should be adapted according to the number of joint used in the equation.
4. Results
Prior to analysis of a particular subject's gait, it was mandatory to acquire the normative data which describe the normal treadmill gait. In Figure 4, full lines represent the mean trajectories of hip, knee and ankle angles, and angle velocities over all subjects for all gait trials, where all data is plotted against the percentage of completed gait cycle.

Joint kinematics data (joints angles and angle velocities) for treadmill gait at the subject's most comfortable speed (mean 5.2 km/h, STD 0.7 km/h). These data represent normative data for the healthy human gait. Shaded areas represent standard deviations.
The shaded areas represent intervals of obtained standard deviations. It can be noticed that standard deviations have small values, therefore it can be concluded that the tested healthy subjects display similar gait patterns while walking over the moving surface of a treadmill.
Calculated mean values were used as normative data which describe the normal, healthy gait. These normatives were used for the second part of our research where we compared healthy gait style (represented by normative data) with irregular gait style measured on subjects with knee constraints. As there is considerable lack of normative data for treadmill gait measured in similar conditions, our results were not compared with any referent data. Kinematics data for the normal gait over a stable surface exist in the literature [8], but comparison with that data would raise questions dealing with deviation in gait over stable and moving surfaces, which is not intended as a part of this paper.
Figure 5 presents the results of gait analysis. Figures 5 a), b) and c) present En_hip, En_knee and En_ankle, respectively. Figure 5 d) presents the phase shift parameter, PSn, while Figure 5 e) presents the gait factor parameter, GFn. The shaded areas present intervals of obtained standard deviations. The trajectories presented by full lines are obtained from measurements on subjects walking barefoot, which represent normal, healthy gait. Trajectories denoted by dotted lines are obtained from measurement on subjects with knee constraints, and represent the results of simulated irregular gait.

Comparison of the newly defined gait parameters a) En_hip, b) En_knee, c) En_ankle, d) PSn, e) GFn for normal gait cycle (noted by full line), and the irregular gait cycle (dotted line). Vertical lines denote the duration of midstance and midswing phases of gait cycle, respectively.
5. Discussion and Conclusions
The objective of this paper was to propose the new kinematic parameters which indicate the deviations of the gait of a particular subject from the normal treadmill gait pattern. In order to provide a quantitative measure which would distinguish an irregular from a normal healthy gait pattern, we introduced five new kinematic parameters: En_hip, En_knee, En_ankle, phase shift (PSn) and gait factor (GFn). We calculated the values of the proposed parameters for two types of gait: normal, healthy gait performed by the healthy subject, and irregular gait simulated by the subject wearing an external knee constraint during walking trials.
By focusing on the results shown in Figure 5, the difference between normal and irregular gait patterns is clearly indicated. By analysing trajectories shown in Figure 5, we can conclude that all trajectories are characterized by two dominant peaks, which occur in the middle of the midstance and midswing phases of gait cycle, respectively. Also, it can be noticed that the largest discrepancy between trajectories obtained for normal and irregular gait coincides with the occurrence of the dominant peaks, which leads us to the conclusion that the irregularity of gait patterns is most observable during the midstance and midswing phases of the gait cycle.
This conclusion is especially applicable to the parameter gait factor, GFn (see Figure 5 e), which is obtained by fusing all gait parameters, thus enhancing the discrepancy between normal and irregular gait during the midstance and midswing phases of gait. Therefore, we believe that the proposed gait factor parameter, GFn, is prominent as the most valuable measure for detection of irregularities in human or humanoid gait patterns.
One of the potential limitations of the present study could be the somewhat low number and homogeneity of tested subjects (all students and employees of The University of Split). However, the primary goal of this study was to propose a new method for detection of irregularities and not to create a new gait normative based on a large testing group. Nevertheless, possibilities for future improvements of the research still remain including improving the measurement system with the introduction of two extra (four in total) or more cameras that would incorporate the full body kinematics. Application of the proposed method on other cyclic movements like pedalling or rowing is also in option, as well as testing of our proposed method on the analysis of a humanoid gait.
Footnotes
6. Acknowledgments
This work is supported by the Croatian Ministry of Science, Education and Sports, under the project “Biomechanics of Human Motion, Control and Rehabilitation”. Data collection took place at the Laboratory for Biomechanics, Automatics and Control Systems at the University of Split.