
Abstract
Due to its efficiency to handle uncertain information, Dempster–Shafer evidence theory has become the most important tool in many information fusion systems. However, how to determine basic probability assignment, which is the first step in evidence theory, is still an open issue. In this article, a new method integrating interval number theory and k-means++ cluster method is proposed to determine basic probability assignment. At first, k-means++ clustering method is used to calculate lower and upper bound values of interval number with training data. Then, the differentiation degree based on distance and similarity of interval number between the test sample and constructed models are defined to generate basic probability assignment. Finally, Dempster’s combination rule is used to combine multiple basic probability assignments to get the final basic probability assignment. The experiments on Iris data set that is widely used in classification problem illustrated that the proposed method is effective in determining basic probability assignment and classification problem, and the proposed method shows more accurate results in which the classification accuracy reaches 96.7%.
Introduction
Information fusion is a process to combine information from the multi-source of same object or scene to obtain more complex, reliable, and accurate information. Multi-source information fusion technology plays a significant role in real applications, such as classification problem,1–6 fault diagnosis,7–9 medical diagnosis, 10 risk and reliability analysis, 11 decision-making,12,13 tracking problem,14,15 and online estimation of batteries state-of-charge. 16 There are many methods to analyze fused data from multi-sources including Dempster–Shafer evidence theory (DS theory),1–4 principal component analysis (PCA),17,18 independent component analysis (ICA),19,20 and Z-number.21–23 As an effective tool, 24 DS theory has been widely used especially for classification problem.25–27 Compared with ICA and PCA in combination with another kind of approaches, Dempster’s combination rule can fuse multi-source information without depending on prior information 28 and it has tremendous advantages in uncertainty modeling and evidence combination, that is, it allows for the allocation of probability mass to sets or intervals. 29 Many scholars have made great contribution to improve evidence theory, for example, Su and Xu extended the evidence theory which can combine dependent evidence,30,31 Gong et al. 32 proposed a new basic probability assignment (BPA) construction method, and Jiang and Hu 33 extended Yager’s soft likelihood function to combine BPA. The first step of this evidence theory is to obtain BPA. But how to determine BPA is still an open issue and there is no general method.
Recently, interval number has become more popular in uncertainty measurement field in which the bounds of the uncertain coefficients are only required, not necessarily knowing the probability distributions or membership functions.34,35 The interval method provides a natural way to directly incorporate measurement uncertainty into computation,36,37 and the combination of interval method and DS theory has been demonstrated convenient and comprehensive.38,39 Kang et al. 40 have proposed a method to determine BPA based on interval number. In Kang et al.’s method, the relationship between interval number model of the sample and test sample is determined to obtain BPA. It can be found that their approach can be improved in some way. Because Kang et al. used maximum and minimum values of the sample to be the upper and lower bound values of interval number, their approach cannot handle environmental noises and human disturbances in real application well. In the engineering applications, the data reported by sensors may be imprecise due to noises, that is, the maximum and minimum values are probably much more than or less than any other data in the same sample. If it happens, the maximum and minimum values are not precise enough to describe the detailed information of the target.
To address this issue, an improved method to determine BPA is proposed in this article and its reasonability is verified by some classification problems. First of all, the process of constructing interval number model is focused. The clustering method can divide data points into some clusters and each cluster center can be regarded as the mean point of the points belonging to same cluster. If the sample can be divided into two clusters, the two cluster centers are two mean points of the upper and lower parts of the sample. Then, the two cluster centers can be the upper and lower bound values of the interval number. Based on this idea,k-means++method is used to find cluster centers. After constructing improved interval number model, the distance and similarity between sample and model are calculated. Finally, the similarity is normalized and the value of BPA is obtained. Some experiments prove that the improved interval number model can handle noises well and the proposed method shows more precise results in determining BPA than the related work.
The contribution of this article is conducted as follows:
The proposed method put forward an innovative focus on the problem of BPA determination in DS evidence theory.
A new interval number model is built based on k-means++, which is effective in determining the BPAs.
The proposed method is data-driven, thus can reduce the subjectivity.
The proposed method can be easily used in many engineering applications to accomplish classification problem in reality.
The article is organized as follows. Section “Preliminaries” is about preliminaries’ knowledge of Dempster–Shafer evidence theory, interval number, and k-means++cluster method. The proposed method to determine BPA is presented in section “The proposed method.” Section “Numerical example” illustrates a numerical example. Some experiments and discussion are presented in section “Experiments and analysis.” Conclusions are presented in section “Conclusion.”
Preliminaries
Dempster–Shafer evidence theory
Researchers have put forward many powerful methods to handle uncertainty, including evidence theory, 41 D numbers,42–44 and so on. Dempster–Shafer evidence theory was proposed by Dempster 26 and later developed by Shafer. 27 It is a complete theory of dealing with uncertainty. It can handle not only epistemic uncertainty but also aleatoric uncertainty. It has abilities to deal with uncertainty and unknown information and requires fewer conditions than probability theory. 45 It is hence widely applied in the field of information fusion, such as sensor data fusion,46–48 decision-making,49–51 multicriteria decision-making, 52 risk and reliability analysis, 53 target recognition, 54 failure mode and effects analysis, 55 online energy management strategy, 56 and conflict evidence combination. 57 Formally, DS theory concerns the following preliminary notations.
Frame of discernment
DS evidence theory first supposes the definition of a set of hypotheses

where the set
BPA
Denote

where Ø denotes the empty set and each subset in

which satisfies the following conditions


The BPA m is also called the mass function.
Belief and plausibility functions
The belief function Bel is defined as follows

The plausibility function Pl is defined as follows

and


The function Bel is the lower limit function of proposition G and the function Pl is the upper limit function of proposition G.
Dempster’s combination rule
Suppose

and

where z represents the conflict between two BPAs. The larger the value of z is, the more conflicting are two evidence.
Pignistic probability
Let m be a BPA on

where
Interval number
Interval analysis is an approach to putting bounds on rounding errors and measurement errors in mathematical computation and thus developing numerical methods that yield reliable results.
59
Archimedes is the first one to use interval number with lower and upper bounds
Definition 1
If
Definition 2
The intersection of two interval numbers

Otherwise, the intersection

Definition 3
Let
Definition 4
If

where
k-means++ method
k-means clustering is a method of vector quantization that is popular for cluster analysis in data mining. Given an integer k and a set of n data points in anI-dimensional space

where x is a data point and c is a cluster center. However, the k-means method has at least two major theoretic shortcomings. First, it has been shown that the worst case running time of this method is super-polynomial in the input size. 67 Second, the approximation found can be arbitrarily bad with respect to the objective function compared to the optimal clustering.
To improve these issues, k-means++ method is proposed by Arthur and Vassilvitskii. 67
The proposed method addresses the second shortcoming by specifying a procedure to initialize the cluster centers for the standard k-means method. The main point behind this approach is that the first cluster center is chosen randomly from the given data points after which each subsequent cluster center is chosen from the remaining data points, and the shortest distance

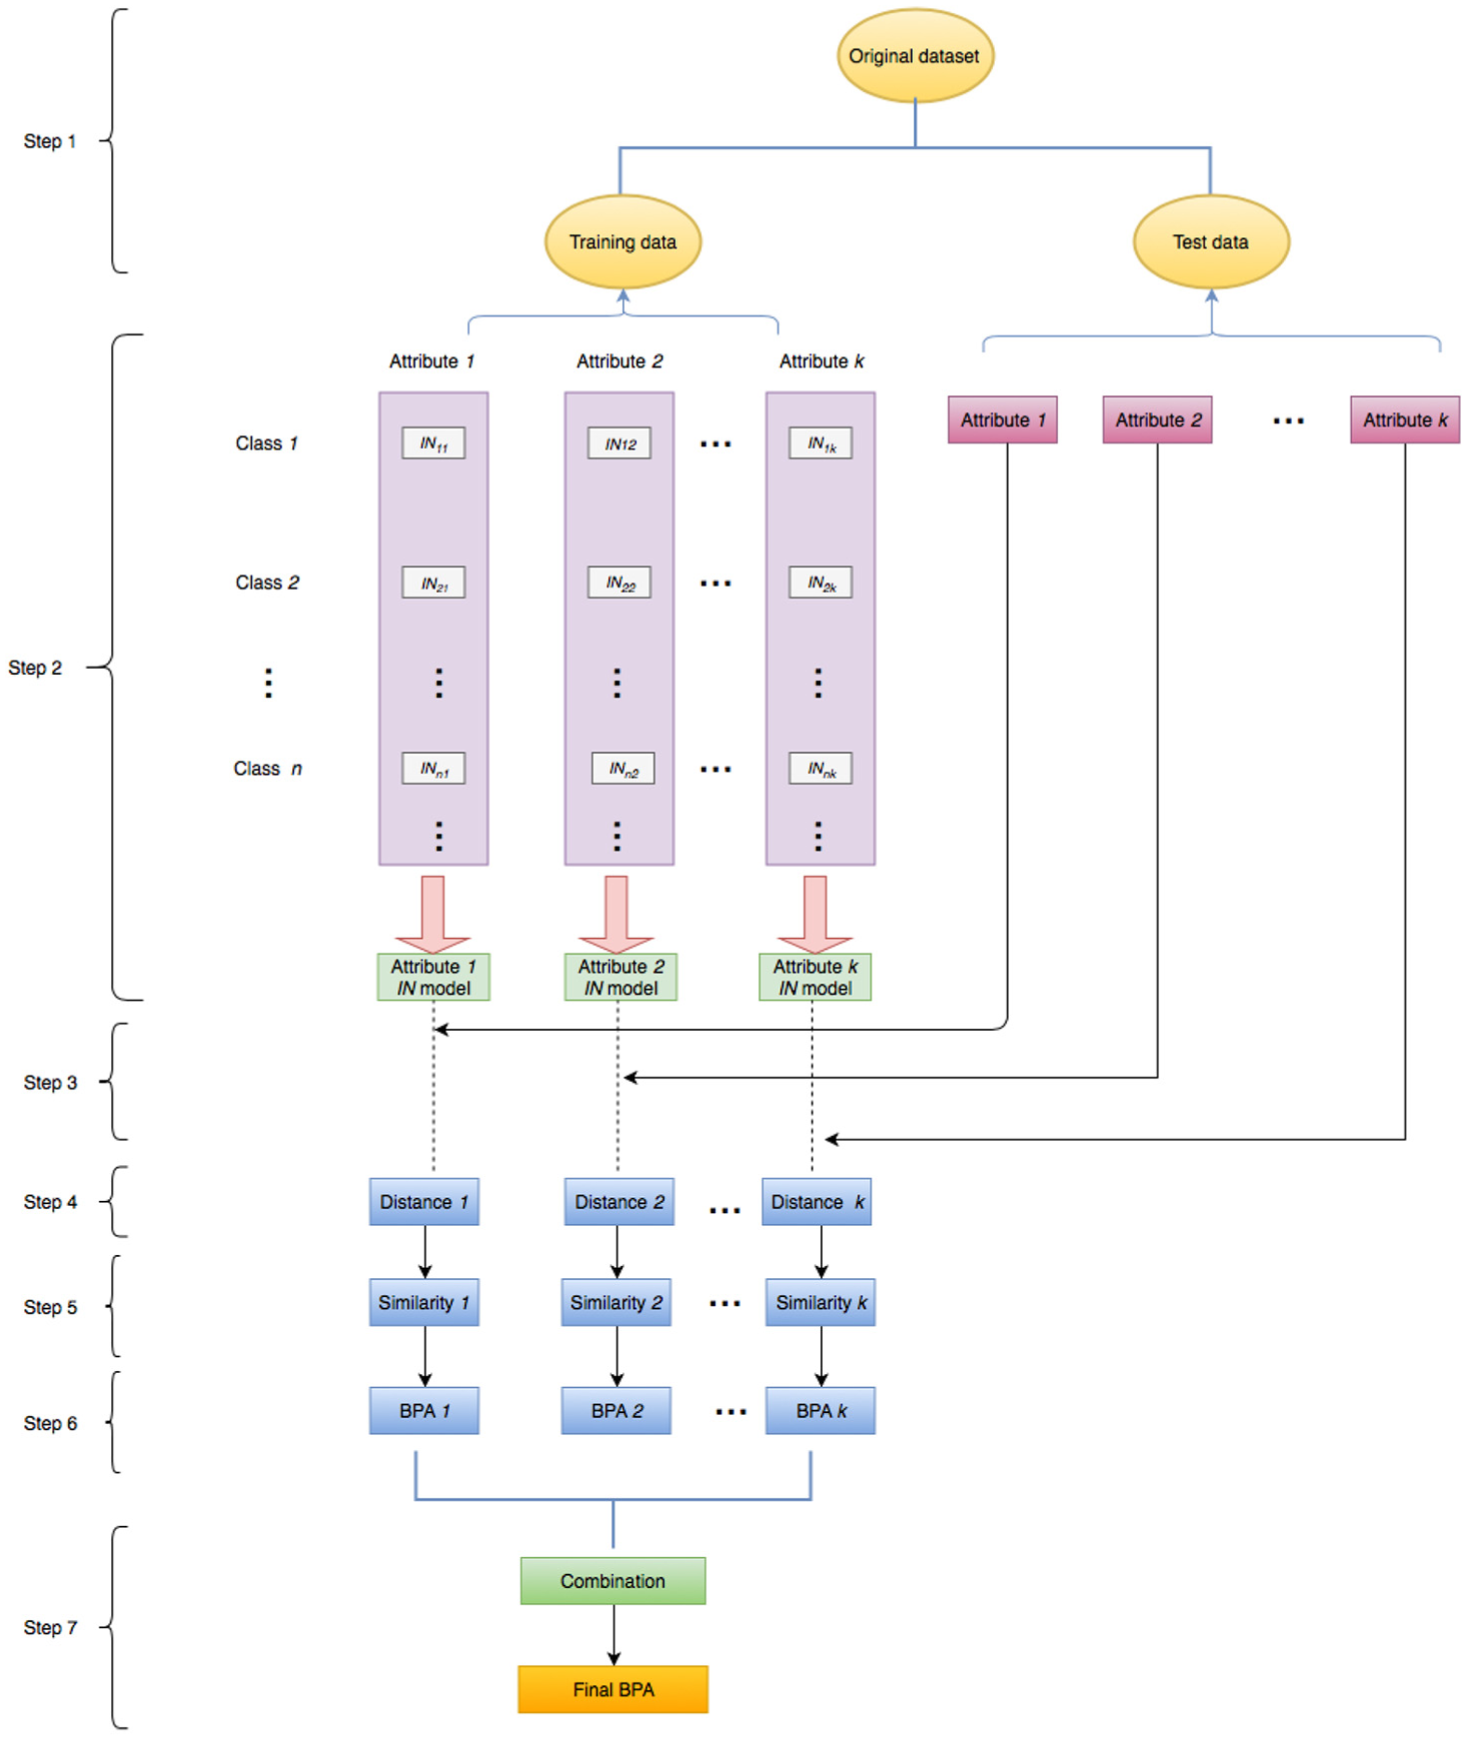
The proposed method
In this section, a new method will be presented for determining BPA. In multiple sensors system, the specific value of the target properties is hard to obtain. And, due to error caused by the actual measurement and the calculation of the processing of data and lack of information, objective error will often be caused. So, some interval range represents the behavior of the feature instead of a specific value, that is, interval number. Using interval number to solve the uncertainty problem can avoid the subjective error and objective error and the result accords with the actual need. Interval number can be used to represent information of an object as mentioned above. But in application, things go different. Not only the procedure of constructing interval number model may cause addition or loss of target information compared to original information but also, in engineering applications, environmental noises and human disturbances often lead to conflict among the reports of multiple sensors. Therefore, data reported by multiple sensors may be imprecise, that is, the maximum value is probably much more than any other data and the minimum is much less than others. Thus, the kind of model using the maximum and minimum values as the upper and lower bounds of interval number is not precise enough to use. Based on the analysis described above, an improved method that constructs the interval number model using k-means++cluster method is proposed. Data of each attribute reported by sensors are divided into two clusters according to its value and each cluster center can be found withk-means++ method. The two cluster centers can be regarded as the upper and lower bounds of interval number. Until now, a new and more accuracy model is constructed.
A flow chart of the proposed method is illustrated in Figure 1 and details are shown as follows. Suppose that there are n classes

where
Step 1. The multi-attribute data set is divided into two parts: the training set and the test set. The training set is used to build interval number model and the test set is used to evaluate the performance of proposed method.
Step 2. Construct improved interval number model.
For each row, divide it into two parts according to ascending order and each part can be regarded as a cluster. Find cluster center for two clusters and an improved interval number can be obtained by k-means++ method, where


Furthermore, a
Step 3. Select a test instance and construct interval number.
Select a test instance
Step 4. Measure the distance between test sample and constructed model.
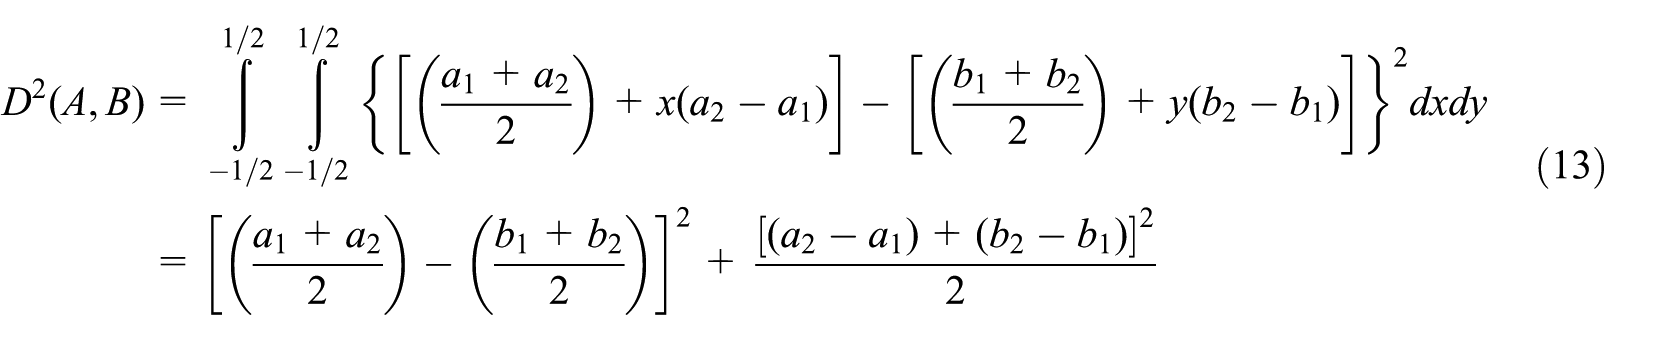
The distance between two interval numbers can be calculated according to equation (13)

Step 5. Measure the similarity between test sample and constructed model.
The similarity can be obtained according to equation (14)

Step 6. Normalize similarity and generate BPA

Step 7. So far, for a test sample
The flow chart of the new method.
Numerical example
Step 1. In this step, 40 instances are randomly selected as the training set, and the remaining 10 instances serve as the test set.
Step 2. Construct improved interval number model. For instance, for attribute sepal length in the class of Setosa, k-means++ method is used first to find two cluster centers that are 4.90 and 5.40, respectively, as shown in Figure 2. Similar procedure is used for the other two classes and result is shown in Figure 3. In order to reflect the relationship between the attribute intervals of different classes, the intersection between them should be taken into account. The intersection of single subset proposition can represent the multi-subset propositions. (Based on the evidence theory, if a frame of discernment is {Setosa, Versicolor, Virginica}, its subset propositions are {Setosa}, {Versicolor}, {Virginica}, {Setosa, Versicolor}, {Versicolor, Virginica}, {Setosa, Virginica}, {Setosa, Versicolor, Virginica}). And, their relationships are shown clearly in Figure 4. Tables 1 and 2 show the numerical results.
Step 3. Select a test sample instance (5.1, 3.5, 1.4, 0.2) which belongs to species Setosa. For the attribute sepal length = 5.1 cm, calculate it as an interval number [5.1, 5.1] (Figure 5).
Step 4. Calculate the similarity between test sample and constructed model. The distance of two interval numbers needs to be calculated first according to equation (13). Then, the support coefficient
Step 5. Normalize the similarity and generate BPA (Table 4).
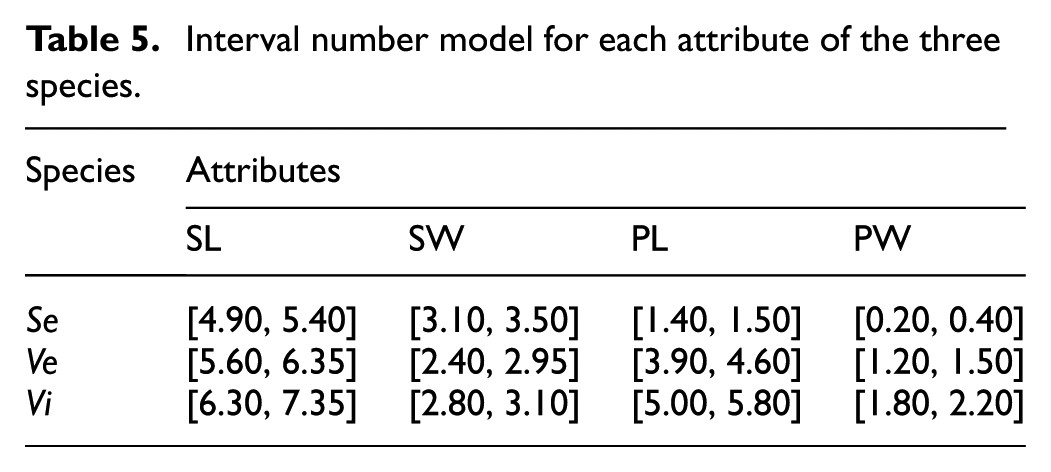
Step 6. Improved interval number model for the four attributes of the three species is constructed using the proposed method as shown in Table 5.
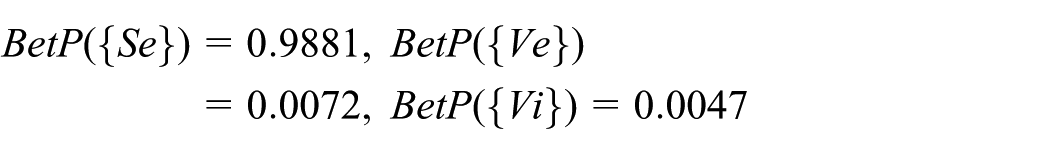
Step 7. In this step, BPAs for each attribute of each test sample are obtained and combined using Dempster’s combination rule to get the final BPA. For an arbitrary instance, its result is shown in Table 6. Obviously, the final BPA of hypothesis {Se} is the biggest and the result is almost equal to 1.
Step 8. The final BPA can be transformed to pignistic probability and it can be obtained as follows

The process of finding cluster center using k-means++.

Interval numbers of sepal length of each species.

Intersection of Versicolor and Virginica.
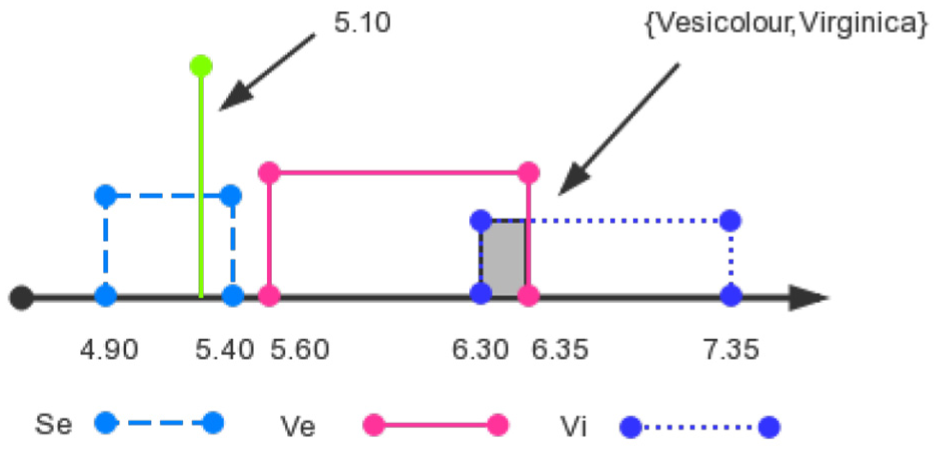
Relationship between the selected test sample and the interval number model.
Interval numbers of sepal length (SL) of each species.

Interval numbers of the intersection.

SL: sepal length.
Similarity between sample’s sepal length and interval number model.

BPA between sample’s sepal length and interval number model.

BPA: basic probability assignment.
Interval number model for each attribute of the three species.
BPAs for each attribute and final combined BPA.

BPA: basic probability assignment.
The maximum pignistic probability is taken as the decision-making criterion. As the result shows, the test sample belongs to Setosa and it is consistent with its actual class, and the final true pignistic probability is almost equal to 1 which illustrates proposed method has the superiority.
Experiments and analysis
Data set
Data set employed in this article is from UCI repository of machine learning databases (https://archive.ics.uci.edu/ml/index.php). This database contains many kinds of multi-attribute data and the Iris data set is one of the classic data sets used in the classification problem. 68 Iris data set contains the three classes (Setosa, Versicolor, and Virginica) and there are 50 instances for each of the three classes. Each type of iris plant contains the four attributes, namely, sepal length, sepal width, petal length, and petal width.
Experiments
Several experiments are conducted in this section to demonstrate the proposed approach. Multi-attribute data are common in many application systems and each attribute can be considered as an information source. Iris data set is a typical multi-attribute data set so it is suitable to do classification recognition. The whole data set is divided into training set and test sample as mentioned above. First, training set is used to build interval number model. The proposed method can be used to obtain BPAs for different attributes of a test sample. Then, these BPAs can be combined to get a final BPA for the test samples. The maximum pignistic probability can be regarded as the decision-making criterion. Therefore, when the final BPA is obtained, it can be transformed to pignistic probability by equation (12) and its classification can be determined according to its belief.
Experiment without noise
In order to demonstrate that the proposed method has better superiority and recognition rate than Kang et al.’s method, 50 instances of each class are tested to obtain their belief and its results are shown in Figure 6(a)–(c). Apparently, the proposed method can identify the correct category with higher probability than Kang et al.’s method. And, the training percentage is set from 50% to 100% to test two methods’ classification accuracy. Figure 6(a) shows the probability result of class Setosa, from which it is obvious that the proposed method can identify the correct category with a much higher probability. Figure 6(b) shows the probability result of class Versicolor; the proposed method also performs better than Kang et al.’s method in most cases. Figure 6(c) shows the probability result of class Virginica; for some instances, Kang et al.’s method fails to recognize the correct class as its results reach below 0.5, but for the proposed rule, it still can identify the correct class. Figure 6(d) shows the classification accuracy for the average of three classes, and our result is 95.33%, whereas Kang et al.’s result is 92.80%. Apparently, the proposed method is still better and has a more stable performance.

(a–c) Probability results of three classes and (d) classification accuracy without noise.
Experiment with noise
As mentioned above, environmental noises and human disturbances often lead to conflict among the reports of multiple sensors in engineering applications. So, in this experiment, these circumstances are simulated by adding Gaussian noise to Iris data set to test the ability of proposed method in application. First, Gaussian noise is added to training set randomly and interval number model is constructed. Then, same steps are conducted and results are shown in Figure 7. Generally speaking, the proposed method performs better than Kang et al.’s method although in noise situation as it is more effective and stable to determine BPA and classify category in application. It is obvious from Figure 7(a) that probability result of class Setosa by Kang et al.’s method has an average drop of 0.5 but the proposed method still performs well without noise. The probability result of class Versicolor in Figure 7(b) shows that the proposed method is still better but not as obvious as without noise. The probability result of class Virginica in Figure 7(c) shows that it is similar to condition without noise; in some instances, the probability results can reach below 0.5, but the number increases. In addition, results of some instances are less than 0.4 which loses much accuracy. The proposed method is still convincing. Similarly, Kang et al.’s method does not perform well in classification in noise environment as its average accuracy decreases from 92.80% to 91% but the proposed method increases from 95.33% to 96% (Figure 7(d)). Obviously, the proposed method is not influenced by noise and even improves in accuracy.

Probability results of three classes (a–c) and (d) classification accuracy with noise.
Classification test on different data sets
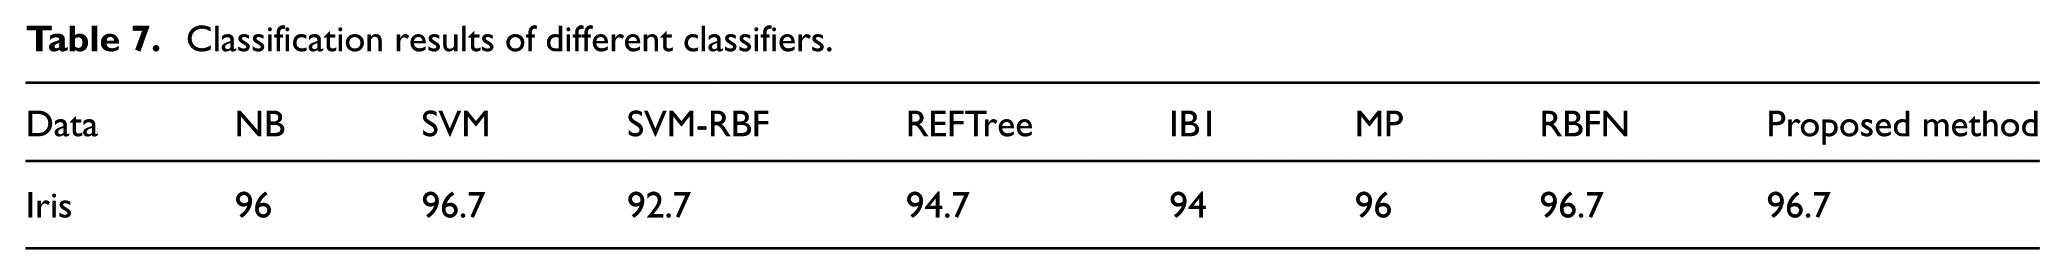
There are other well-known classifier algorithms in Waikato Environment for Knowledge Analysis (WEKA), 69 including naive Bayes (NB), support vector machine (SVM), SVM with radial basis function (RBF), decision tree learner (REFTree), 1 nearest neighbor (1NN), multilayer perceptron (MP), RBF network (RBFN), and so on. These are popular machine learning and data mining algorithms which have a good performance in classification problem. The comparison of identification accuracy between proposed method and these classifiers is presented in Table 7.
Classification results of different classifiers.
About the support coefficient
In the previous section, a support coefficient

Judgment performance of support coefficient (a) without noise and (b) with noise.
Discussion
The two experiments prove that the proposed method has a better performance both in generating BPA and in classification and whether there is noise in data or not. For class Setosa, the belief of each instance is larger than 0.9 and some are even almost equal to 1 both in circumstances with noise and without noise. For classes Versicolor and Virginica, although the results are better than Kang et al.’s method, it is not as obvious as class Setosa. Kang et al.’s method apparently loses much accuracy in noise environment as most belief of class Virginica can reach below 0.5 and its classification rate decreases 1.8% in noise environment. The reason is that the shortcomings of their representation of interval number model, which only considers the maximum and minimum values, are considered and it is solved using k-means++ method. The proposed method can handle imprecise data and uncertain information as it constructs model using data from sensors. In the third experiment, it is clear that the classification accuracy of our method is one of the highest and it can be proved that our method has a good performance as other well-known classifiers. Based on the results, it is not difficult to see that the proposed method has a significant capacity to determine BPA compared with Kang et al.’s method.
Conclusion
In this article, a method based on interval number and k-means++ method to obtain BPA was proposed. The proposed method effectively avoids high data conflict reported from sensors caused by environmental noises and human disturbances so that it can be helpful to build reasonable model. Since the interval number is available with fewer data from the information source, in the real application, it is easy to apply this method in many engineering applications to accomplish multi-source data fusion and classification. Meanwhile, it is data-driven and can reduce the uncertainty of subjectivity. Finally, the experiment results supported that the proposed method is superior in determining BPA and simple and practical in actual engineering application, whereas the object lying in overlapping borders of several classes could be hard to classify and its classification result is considered with low reliability. In further research, this issue would be improved. Some researchers compared different classification algorithms and found that DS theory has marginal improvement in classification performance in fusion algorithm. 70 In the future work, the new BPA determination method will be applied in fusion algorithm to improve classification performance.
Footnotes
Acknowledgements
The authors greatly appreciate the reviewers’ suggestions and the editor’s encouragement.
Handling Editor: Daming Zhou
Declaration of conflicting interests
The author(s) declared no potential conflicts of interest with respect to the research, authorship, and/or publication of this article.
Funding
The author(s) disclosed receipt of the following financial support for the research, authorship, and/or publication of this article: This research was funded by the Chongqing Overseas Scholars Innovation Program (no. cx2018077), the National Natural Science Foundation of China (grant numbers 61672435, 61702427, and 61702426), and the 1000-Plan of Chongqing by Southwest University (grant number SWU116007).