
Abstract
Multi-sensor information fusion occurs in a vast variety of applications, including medical diagnosis, automatic drive, speech recognition, and so on. Often these problems can be modeled by Dempster–Shafer theory. In Dempster–Shafer theory, the most primary processing unit is the basic probability assignment, which is a description of objective information in the real world. How to make this description more effective is a vital but open issue. A novel basic probability assignment generation model is proposed in this article whose objective is to provide perspective with respect to how basic probability assignment can be determined based on learning algorithms. First, the basic probability assignment generation model is constructed based on clustering idea using K-means method, which is employed to determine basic probability assignment with the proposed basic probability assignment generation method. Moreover, the proposed basic probability assignment generation method is extended by K–nearest neighbor (K-NN) algorithm. The detailed implementation of the proposed method is demonstrated by several numerical examples. As an extension, a classifier called KKC is constructed according to the developed approach, and its classification effect is compared with several famous classification algorithms. Experiments manifest desirable results with regard to classification accuracy, which illustrates the applicability of the proposed method to determine basic probability assignment.
Keywords
Introduction
Information fusion is an information processing technology, also known as data fusion. 1 It refers to the process of combining multiple groups of information from different sources with certain methods and rules to obtain the final fusion results, which is also called multi-source (multi-sensor) information fusion technology. 2 Dempster–Shafer evidence theory (DST) is widely applied in information fusion, which is also called theory of belief function. Its basic concept was put forward by Dempster in 1967, 3 and then developed and improved by Shafer, 4 making it a complete uncertain reasoning theory. DST is the generalized form of the classical probability theory, which expands the basic event space into its power set, and establishes the basic probability assignment (BPA) function. Dempster 3 proposed a fusion rule, which can combine evidence without prior information. In the past decades, 5 DST has been applied in a large number of scientific fields, such as medical diagnosis,6–10 multi-sensor fusion,11–13 pattern recognition,14–17 and intelligent decision-making.18–22
How to generate BPA effectively is a crucial and open issue in DST.23–26 BPA is the most basic processing unit and a way of information expression in DST. The fusion process in DST is based on the BPA function, so the rationality of the generated BPA directly affects the accuracy of fusion results, and also determines the efficiency of evaluation and decision. There are usually two perspectives to determine BPAs.27,28 First, it is given subjectively by experts or decision makers based on their experience and survey results; second, a model is established based on collected data to automatically generate BPAs. To solve this problem, scholars have proposed various methods, which are described below.
As analysis, these methods of generating BPA can be divided into several categories, which are probability distribution-based method, fuzzy theory-based method, and other methods. For methods using probability distribution, a method to obtain BPA was proposed by Xu et al. 29 ground on the normal distribution and they also proposed a non-parametric method to determine BPA by Gaussian process regression. 30 And a method to determine BPA using core samples was introduced by Zhang et al. 31 For methods employing fuzzy theory, a few BPA generation algorithms based on (triangular) fuzzy numbers were provided in previous literature32–35 and the generalized BPAs generation algorithm was proposed by Deng and colleagues.36–38 In addition, there are other methods for generating BPAs of sample attribute values, such as the BPA generation algorithm found on interval number proposed by Qin and Xiao 39 and the algorithm based on confusion matrix proposed by Deng et al. 40 Some BPA generation algorithms are presented in Table 1.
Overview of research on basic probability assignment generation methods.

BPA: basic probability assignment; GBPA: generalized basic probability assignment; MST: minimum spanning tree.
The above introduces several popular methods of BPA generation. Different models can be established from different perspectives, and different results may be obtained. As for which method is employed to construct BPA, it needs to be selected according to the specific situation in practical application. There is no general rule for BPA determination, so it is an open issue.32,39 Different from the traditional BPA method, in this article, a novel BPA generation algorithm is put forward from the perspective of machine learning (i.e. K-means and K–nearest neighbor (K-NN)).
First, the model to generate BPA is constructed based on K-means method, where the concepts of centroid and radius are defined to represent the scope of the model. Then, the BPAs of different attribute values associated samples to be classified can be determined based on the built model introduced in section “Generate BPAs based on the constructed model.” A numerical example is provided to illustrate the utilization of the presented approach. In addition, the BPA generation method in section “Generate BPAs based on the constructed model” is extended by K-NN algorithm. The K NNs of the sample to be identified are investigated. And the BPAs of them are determined based on the proposed generation model, which are processed to obtain the final BPA for the sample to be tested. A numerical example is also given to demonstrate the procedure of this method. To apply the proposed method to different fields easily, a classifier is constructed based on the developed BPAs determination method. The classification validity of the constructed classifier is verified by a comparative experiment with other state-of-the-art machine learning algorithms.
The remainder of this article is organized as follows. The “Preliminaries” section introduces the concept of DST, K-means method, and K-NN algorithm. “The model to determine BPA based on K-means method” section presents the model to determine BPA based on K-means method. The section “An improved method for BPA generation based on K-NN algorithm” introduces an improved method for BPA generation based on K-NN algorithm. “An application for classification based on multi-sensor information fusion” section constructs an application for classification based on the proposed BPA generation method. In the “Conclusions and future research” section, the conclusions and future research directions are provided.
Preliminaries
DST
DST was first introduced by Dempster
3
and then developed by Shafer,
4
which is widely applied in uncertainty modeling.43–46 Its job is to numerically deal with the “probabilities” of events without sharply definite boundary. In DST, all the basic events constitute the frame of discernment (FOD), which is expressed as

where A denotes one of the propositions in
DST is mostly employed in multi-source information fusion.47–49 In such applications, multi-source information is usually expressed in the form of BPAs. These sources need to be combined for decision making and classification.50–53 In DST, the concept of orthogonal sum was presented by Dempster 3 as follows.
with

Note that the rule of Dempster only works for two such BPAs where
For decision or classification, the combination results of multi-source information usually need to be transformed into probability distribution.54,55 The common method is pignistic probability, 56 which can be defined as follows.

where
K-means clustering method
For most multi-sensor information fusion applications, it is suitable to employ clustering method to process the involved data, which can divide similar objects into the same or similar groups, so that the data objects in the same group have the same or similar characteristics. This data processing method can greatly reduce the difficulty in dealing with high-dimensional data, and subsequent processing can eliminate data redundancy to achieve the purpose of refining data sources.
The K-means algorithm is a relatively simple one among machine learning clustering algorithms. It is an iterative algorithm based on distance. 57 Its core idea is to classify n samples into K clusters so that each sample is closer to the center point of the cluster than the other clusters. The following is a brief introduction of the core idea of K-means algorithm. First, K points are initialized as the centroid of the class cluster, and then the distance measure function is selected to calculate the distance from each cluster sample to each centroid. According to the obtained distance, each sample is divided into the cluster where the nearest particle is located. Update the centroid next, and continue to measure distance to the centroid of the sample. Divide each sample according to the nearest distance principle, and keep repeating this step. When the number of cycles reaches the preset maximum number of iterations, or the sum of squared errors of each two iterations is less than the set threshold, stop iteration, and the output is the final clustering result. The specific process of K-means algorithm is described in Algorithm 1.

In the K-means clustering algorithm, the selection of distance measure is also important. There are many ways to calculate the distance, such as Euclidean distance, Manhattan distance, Chebyshev distance, cosine distance, Jaccard similarity coefficient, and so on. The selection of different distance measures will have a certain impact on the clustering results. Since this is not the focus of this article, the detailed introduction is not given. The K-means algorithm is selected in this article because it has the following advantages:
This algorithm is simple and fast
This algorithm converges after a certain number of iterations
The clustering effect is better when the clusters are spherical or cluster, and the differences between clusters are obvious
This algorithm has certain advantages for big data processing.
Based on the above analysis and aiming at how to effectively generate the BPA of sensor data, this article breaks the traditional statistical modeling method and proposes the BPA generation algorithm innovatively using clustering ideas based on the advantages of K-means clustering algorithm. The specific algorithm flow is introduced in Algorithm I.
K-NN method
K-NN algorithm is a classical classification algorithm in machine learning. It classifies objects by measuring the distance between different features.
58
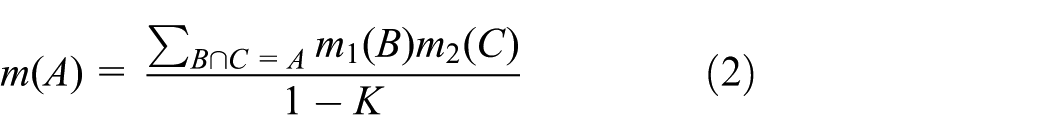
Its basic idea can be described as follows: the category of the sample to be tested is equal to the category of its K most similar samples in the feature space. This is the core of the K-NN algorithm, that is, the category of the K samples closest to the sample to be tested is the correct classification of this sample. K-NN method makes decision according to the principle of quantity superiority and avoids the uncertainty brought by single object decision. This ensures the accuracy of K-NN method classification and becomes its main advantage. The K-NN method is briefly illustrated by an example below. In Figure 1, the coordinates of all sample points in the plane graph have been given, and now it is necessary to determine the category of purple triangle. According to the sample distribution in the graph, it can be known that the possible category of purple triangle is one of rectangle, circle, or diamond. K-NN method is employed to classify it. When
The illustration for K-NN algorithm.
The distance measure in K-NN algorithm is also a crucial problem, because the algorithm determines the proximity by measuring the distance between samples and each object. The common distance measure is Euclidean distance and Manhattan distance, and which one should be employed depends on the actual environment.
The model to determine BPA basedon K-means method
To obtain reasonable, effective and representative BPA, two aspects need to be taken into account: (1) What are the definitions and requirements for the rationality of BPA? (2) How to ensure the efficiency of BPA generation model? For the first aspect, the definition of rationality is given as follows: the generated BPA should contain as much effective information of the original data set as possible and minimize the information loss caused by the conversion of data type, which can serve as the basis for the information fusion and decision-making process. For the second aspect, the efficiency of the model is mainly concerned with the effectiveness of generating BPA and the complexity of the algorithm. To meet the above two requirements, the model developed in this article fully considers and utilizes the information of the original data set to ensure that the information loss can be minimized. The complexity of the algorithm is reduced as far as possible on the premise of rationality.
Based on the introduction and analysis of K-means algorithm in the “K-means clustering method” section, in this study, a model to generate BPA using the K-means clustering algorithm is developed, and the flow chart of the proposed model is manifested in Figure 2. The algorithm is described in detail below.

The flowchart of K-means-based BPA generation model.
Construct the model to generate BPA based on K-means method
BPA generation process generally occurs before multi-sensor information fusion. Based on the investigation of a large number of practical applications,59,60 without loss of generality, the following problem descriptions are presented. For a given data set, the number of samples is assumed to be n, the number of attributes is m, and the number of categories is p, that is, the number of elements in the FOD in DST. Let us consider a classification problem. A certain proportion of samples are selected randomly according to the practical application environment as the training set, and the rest as the test set. Let
In the constructed model, the m attributes will be divided into
Generate BPAs based on the constructed model
In the previous section, the BPA generation model is built, and then we will introduce how to generate BPA according to the established model. The following details of BPA generation based on this model will be introduced. For a certain attribute value in a sample of BPA to be generated, according to the model established in the previous step, the number of s-dimensional clustering regions corresponding to it is
For example, in data set D, four attributes are represented as a, b, c, and d, respectively, and

Perform this operation on the three BPAs corresponding to the attribute value
Numerical example
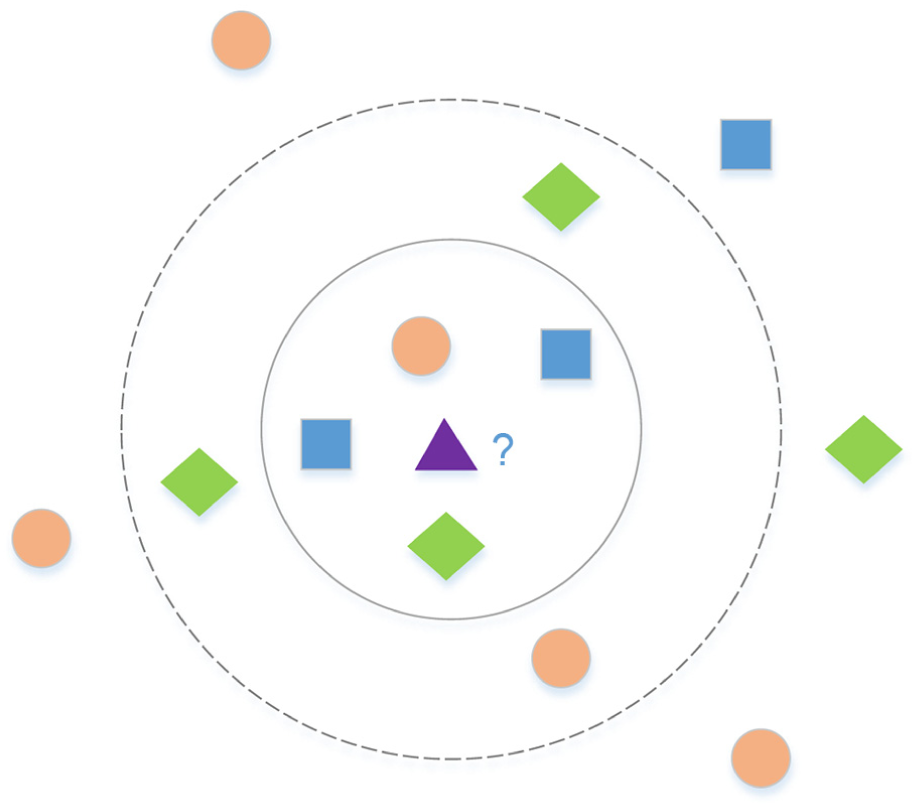
In this section, to demonstrate the BPA generation algorithm proposed in the article, we take IRIS data set as an example to introduce the application process of the constructed model in detail. First, we briefly introduce the basic structure of IRIS data set. IRIS data set is a very famous pattern recognition data set, which was established in the mid-1930s by R.A. Fisher, a distinguished statistician. At present, it is widely cited in UCI machine learning database. The IRIS data set contains three categories, namely Setosa, Versicolor, and Virginica, with a total of 150 samples and 50 samples in each category. The data set consists of four attribute variables, namely Sepal Length, Sepal Width, Petal Length, and Petal Width. As the data types in this data set are all numerical and the selection of attribute characteristics is representative, it is generally recognized as the most useful data set in the field of data mining and analysis. The following example will be conducted based on this data set.
According to the process shown in Figure 2, we first divided the data set into training set and test set with a proportion of 80%. The following two aspects demonstrate how to generate the BPAs associated with the samples in the test set.
1. Construct the BPA generation model
In this example, we assume that
2. Generate BPAs of test samples based on the established model
BPA generation model for IRIS data set, as the order from left to right and from top to bottom, the two-dimensional attributes are (SL, SW), (PL, PW), (SL, PW), (SL, PL), (SW, PW), and (SW, PL).
In this part, we take the second test sample of IRIS-setosa as an example to demonstrate how to generate the BPA associated with each attribute value of this sample. According to IRIS data set, the four attribute values of Sepal Length, Sepal Width, Petal Length, and Petal Width of sample 2 are 4.9, 3.0, 1.4, and 0.2, respectively. According to introduction in section “Generate BPAs based on the constructed model,” the division of four attribute values is determined and denoted as


The process of generating BPA from attributes
After obtaining the corresponding BPA of each subset, Definition 3 is employed to average all the BPAs obtained, and the final BPA of the first attribute value of sample 2 can be calculated as 
Note that

According to the above process, the BPAs of other attribute values 3.0, 1.4, and 0.2 in sample 2 are


According to the above process, the BPAs of all samples in the test set can be calculated. The BPAs of the samples of IRIS-setosa, IRIS-versicolor, and IRIS-virginica are manifested in Tables 2–4, respectively.
The BPAs of each sample to be tested in IRIS data set assigned to class “setosa.”

BPA: basic probability assignment. “S” denotes setosa, “C” denotes versicolor, and “V” denotes virginica. Unless otherwise stated below, the classes of IRIS data set are defined according to this table.
The BPAs of each sample to be tested in IRIS data set assigned to class “versicolor.”

BPA: basic probability assignment.
The BPAs of each sample to be tested in IRIS data set assigned to class “virginica.”

BPA: basic probability assignment.
An improved method for BPA generation based on K-NN algorithm
In “Construct the model to generate BPA based on K-means method” section, a BPA generation model is constructed based on K-means algorithm, and its use process is demonstrated by a numerical example. Inspired by K-NN algorithm, in this section, the BPA generation method in section “Generate BPAs based on the constructed model” will be improved from a novel perspective. For the sample to be tested, its K nearest “neighbors” will be obtained through distance measure, and the belief distribution of each focal element associated with the sample will be determined based on the information of “neighbors.” Then, the corresponding BPAs are generated. The method is described in detail below.
The BPA generation method developed in this section can be considered as an extended version of the one in section “Generate BPAs based on the constructed model,” which is based on the BPA generation model built in “Construct the model to generate BPA based on K-means method” section. In the section “Generate BPAs based on the constructed model,” the BPAs of samples are directly determined by attribute values. However, in practical applications, for samples to be classified, there are many cases of overlapping of class domains. In this situation, the method in section “Generate BPAs based on the constructed model” is no longer applicable, while K-NN algorithm provides a admirable solution for such problems.
The K-NN-based BPA generation method
Based on the constructed model in Section “Construct the model to generate BPA based on K-means method,” let us denote the set of attributes to be tested x, where the number of elements in x is 1 to m. Let us denote the set of the K NNs of x be


where function
Note that in equation (13), if one or more neighbors coincide with the sample to be tested, that is,

it satisfies that
To determine the final BPA of x, the BPAs of its K neighbors need to be combined by the rule of Dempster considering the weights. First, the weighted average BPA of x associated with K neighbors can be calculated as
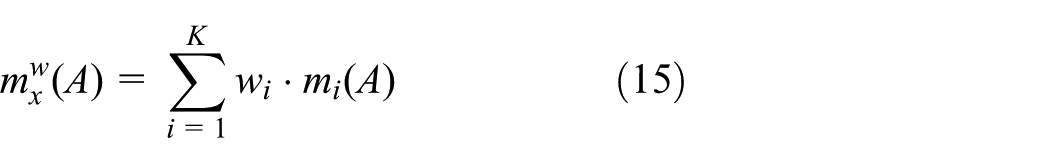
Then the weighted average BPA

where
Numerical examples
To demonstrate the improved BPA generation method based on K-NN, several numerical examples are given as follows. These examples are also based on the IRIS data set. The specific information about the IRIS data set has been introduced in detail in “Numerical example” under “The model to determine BPA based on K-means method” section, which will not be repeated here. In this section, the parameter
In the first example, let

BPA generation model when the number of subsets is equal to the number of attributes.
In the second example, the effect of K value in K-NN algorithm on BPA generation results is demonstrated. Let

The process of generating BPA with different K values.
An application for classification based on multi-sensor information fusion
In this section, a K-means and K-NN based classifier (KKC) is constructed based on the proposed method to determined BPAs. The real data set in the UCI machine learning database (http://archive.ics.uci.edu/ml/datasets/) is employed to test the performance of the classifier. And the test results are compared with other classical classifiers to highlight the effectiveness of KKC in this article. The experiment is conducted based on the method of 10-fold cross-validation. Next, the classifier, KKC will be constructed first and then the experiment will be described.
A classifier based on the proposed BPA generation method
A classifier called KKC is constructed in this section based on the proposed BPA generation method. Let the number of attributes in sample S be
Experiment
The data sets employed in this experiment are all from UCI machine learning database, which will be briefly described below. Ionosphere data set, from the Johns Hopkins university Ionosphere database, was collected by a radar system in Goose Bay, Labrador. The system consists of 16 phased-array antennas with a total transmitting power of about 6.4 kW. The data set is categorized into two categories: “good” and “bad.”“Good” radar echoes are those that show some type of structure in the ionosphere and “Bad” is evidence that there is no structure. This data set contains 351 samples associated with 34 attributes. IRIS data set has been introduced in section “The model to determine BPA based on K-means method.”Heart data set, a heart disease database, records the symptoms of 270 heart patients with 13 attributes that determine whether a person has heart disease. Wine data set records the results of chemical analysis of three different wines produced in the same region of Italy, by analyzing the content of 13 components in wine to classify different wines. Australian data set records relevant information of credit approval in Australia. The attribute names and attribute values in the data set have been replaced by meaningless symbols. This data set contains 14 attributes and records 690 samples. Hepatitis data set records 19 results for 155 patients for hepatitis classification. Connectionist Bench data set uses 60 attributes to study the classification of sonar signals. A total of 208 samples are recorded. According to the collected sonar signals, they can be divided into two categories: metal cylinder reflection and rock cylinder reflection. These data sets cover the fields of medical diagnosis, physics and science, which can more comprehensively verify the effectiveness of KKC in this article. The basic information is given in Table 5.
General information about the real data sets.

aThe suffix R is short for Real, I is short for Integer, and C is short for Categorical.
To demonstrate the superiority of the classifier in this article, several classical classification algorithms are selected: Support Vector Machine (SVM), Decision Trees, Multi-layer Perceptron Classifier, Naive Bayes, SVM with Radial Basis Function (SVM-RBF), and RBF Network (RBFN). The above classification algorithms are only employed as the comparison methods, so the detailed introduction of them is ignored here.
In order to carry out comparative experiments, all data sets are divided into training set and test set in proportion. The BPA generation models are constructed based on training sets using the method developed in Section “Construct the model to generate BPA based on K-means method.” For each sample in different test sets, BPAs of all the attributes are calculated based on the method presented in sections “Generate BPAs based on the constructed model” and “The K-NN-based BPA generation method.” The classifier KKC is employed for BPAs of attributes associated samples from different test sets, then all the samples to be classified are assigned class labels. In this experiment, for classifier KKC, we set the parameters
Classification accuracy of different methods.

SVM: Support Vector Machine; DT: Decision Trees; MPC: Multi-layer Perceptron Classifier; NB: Naive Bayes; SVM-RBF: SVM with Radial Basis Function; RBFN: RBF Network; KKC: K-means and K-NN based classifier.
As can be observed from Table 6, classifier KKC works as well as the state-of-the-art classifiers, and KKC has slight advantages over other classifiers. A large number of practical applications can be transformed into classification problems (e.g. decision making, medical diagnosis, fault diagnosis, etc.), so the developed classifier would be easily employed on demand. The performance of KKC demonstrates that the constructed model to determine BPAs is effective.
Conclusions and future research
In this article, we tried to establish a model for determining BPA in DST. Models which employ two well-known types of machine learning algorithms, K-means and K-NN, would play a crucial part in multi-sensor information fusion. The implementation details of the method presented in this article on real data sets are demonstrated with several numerical examples. The approach proposed in this article is considered sufficiently general and capable of being usefully adapted to situations involving the BPAs generation problem. In order to generalize the BPAs determination method to real environment, a classifier called KKC is constructed, which can be easily extended to other multi-source information fusion applications, such as evaluation, decision, prediction, and so on. In the empirical part of our study, the classification accuracy of KKC is compared with other advanced classifiers based on several real data sets. Experimental results indicate that KKC performs better in classification than other algorithms, which would be attributed to the BPAs generation method proposed in this article.
Note that there still remains some problems to be solved in future research. A few crucial points are summarized below. When using the model proposed in this article, the problem of parameter determination is involved, such as K in K-means, K in K-NN, and parameter
In short, although the current version of BPAs generation model has some shortcomings, it is still an effective method to determine BPAs in DST. First, a model to generate BPAs is innovatively constructed based on K-means method. Second, BPAs of objects to be identified can be determined based on the constructed model. Third, the BPA generation method is improved by K-NN algorithm. Moreover, an efficient classifier is bulit based on the proposed approaches. In the future research, the theoretical framework of the BPAs determination method could be increasingly perfected. And the presented methodology should be employed to a wider range of applications in multi-sensor information rule.
Footnotes
Acknowledgements
The authors greatly appreciate the reviewers’ valuable comments and the editor’s encouragement.
Handling Editor: Miguel Ardid
Declaration of conflicting interests
The author(s) declared no potential conflicts of interest with respect to the research, authorship, and/or publication of this article.
Funding
The author(s) disclosed receipt of the following financial support for the research, authorship, and/or publication of this article: The work is partially supported by National Natural Science Foundation of China (Grant Nos. 71472053, 71429001, 91646105).