
Abstract
The absolute stress in the in-service steel members is a critical indicator employed for the evaluation of structural performance. In the field of structural health monitoring, the stress is usually monitored by the stress monitoring system. However, the monitored stress is the relative value, rather than the absolute value. The longitudinal critically refracted wave has shown potential for use in absolute stress measurement. The accurate measurement of the longitudinal critically refracted wave time-of-flight is the core issue with this method. In this study, a cross-correlation-based algorithm is presented for stress evaluation using the longitudinal critically refracted wave. Specifically, a cross-correlation theoretical formula is derived and a five-step framework is proposed for the longitudinal critically refracted wave time-of-flight measurement. Four steel members are employed to investigate the parametric calibration using the longitudinal critically refracted wave to measure the stress. On this basis, the proposed cross-correlation-based algorithm is used to evaluate the stress of a steel member. The results indicate that the cross-correlation-based algorithm can measure the longitudinal critically refracted wave time-of-flight without filtering the noise signal, and the stress measurement results are better than those of the traditional peak value method. The proposed method provides a potential way to measure the absolute stress in practical engineering applications.
Keywords
Introduction
Importance of the absolute stress measurement
Structural health monitoring (SHM)1,2 plays an important role in studying structural performance evolution and ensuring structural safety. SHM is not only used in civil engineering applications, such as high-rise buildings, 3 million-ton offshore platforms, 4 long tunnels, 5 and bridges, 6 but is also used in aerospace 7 and other fields. 8 Stress evaluation is an important part of SHM. 9 Traditionally, the structural stress, especially the stress of large steel members, is usually measured by designing a stress monitoring system. 10 The sensors, such as the resistance strain gauge, 11 vibrational chord strain gauge, 12 and fiber grating strain sensor13,14 are often attached to the steel member surface to collect stress data in real time. 15 However, the monitored stress using SHM technologies is the relative value over a period of time, rather than the absolute value in the current state. 12 The absolute stress, which is the applied mechanical stress at the present moment but not the stress variation in steel members, is a direct indicator for the evaluation of structural safety. 16 The early evaluation of absolute stress in steel components can provide valuable information to assist in overall maintenance and design of civil infrastructures in extreme climatic conditions.
The techniques used for absolute stress measurement can be destructive methods or non-destructive methods. 17 Destructive methods require material removal of the tested steel members,18,19 and thus, these methods are not appropriate for online component evaluation. Non-destructive methods, such as the X-ray diffraction method 20 and neutron diffraction method, 21 measure the change in waveforms and rays caused by stress. The implementation of these methods requires complex equipment, which are usually used at the laboratory scale. Therefore, these methods are unsuitable for large component evaluation and field applications.
Absolute stress measurement using the Lcr wave method
Recently, the ultrasonic methods, which are based on the acoustoelastic effect, have received research attention in the field of SHM.22,23 The ultrasonic methods are not limited by the component size and material under study, which makes them potentially useful in steel member absolute stress measurement. 24 Among all ultrasonic waves, the longitudinal critically refracted (Lcr) wave has been regarded as the best candidate to evaluate the absolute stress in materials. 25 The Lcr wave is generated by the longitudinal wave mode conversion, and it can travel parallel to the material surface. After being refracted into the wedge that is in contact with the steel member surface, the ultrasonic wave can be received by the transducer that is attached to the wedge. 26 Because the change in the Lcr wave velocity caused by stress is hard to be measured, the fixed acoustic path method is commonly used to measure the Lcr wave time-of-flight (TOF) on a certain path. 27 QM Zhu et al. 28 studied the effects of stress and microstructures on the Lcr wave TOF and stress coefficient and investigated the residual stress evaluation both with and without different corrections. Furthermore, the Lcr wave attenuation velocity (LCR-AV) method was presented to measure the welding residual stresses, and the hole-drilling reference method was used to verify the measurement reliability and precision. 29 ZH Li et al. 22 investigated the relationship between the applied stress and Lcr wave TOF difference and measured the applied stress in in-service steel members. Furthermore, the absolute stress distribution measurement method was presented to evaluate the stress field in the components with variable cross sections. 30 Y Javadi et al. 31 combined the Lcr wave and finite-element (FE) analysis to investigate the effects of clamping and post-weld heat-treatment on welding residual stress and deformation.32,33 The combination of FE analysis and the Lcr wave, that is, the FELCR method, 34 is an innovative work to evaluate the residual stress distribution through thickness of the objects, which is an improvement of the traditional Lcr wave method. The implementation of the FELCR wave method provides a reference for the absolute stress evaluation in steel members. To improve the Lcr wave TOF measurement accuracy, the laser ultrasonic technique35,36 was used to generate a wide-frequency band pulse. The TOF of the ultrasonic pulses can be measured with an accuracy of approximately 0.5 ns using the designed optoacoustic transducer. Generally, the Lcr wave has been widely studied and used in the laboratory.
However, there is a limited number of practical engineering applications of the Lcr wave method.17,25 The main reason for its limited use is that the Lcr waveform is easily affected by environmental factors, which results in inaccurate measurements of TOF.17,25 Bouda et al. 37 noted that the major drawback of the Lcr wave in field measurements is the microstructure of the materials, and their experiment confirmed that the Lcr wave attenuation and velocity were related to the metal grain size. ZH Li et al. 22 investigated the influence of the material properties on the parametric calibration of the Lcr wave method and concluded that parametric calibration is a necessary step for the absolute stress evaluation. W Djerir et al. 38 explored the effects of crack on the Lcr wave propagation characteristics, and the experiment showed that the amplitude of the Lcr wave decreased and its frequency spectrum changed with a given defect. In addition, temperature 39 and coupling conditions 40 also have a direct influence on the ultrasonic wave attenuation and TOF. All these factors may reduce the signal-to-noise ratio of the Lcr wave. In general, the goal of improving the stress measurement precision requires accurate measurement of the Lcr wave TOF.
At present, the research on the Lcr wave TOF measurement is mainly focused on signal de-noising.17,25 After being filtered, a characteristic point, such as the peak or valley point, is selected to judge the delay of the Lcr wave. In fact, the Lcr wave signal-to-noise ratio depends on noise reduction parameters, that is, the Lcr wave TOF is different when different de-noising methods and noise reduction parameters are used. In addition, the inhomogeneous material 41 and microcrack 38 in the steel member may lead to the distortion of the Lcr waveform, which may cause the Lcr wave peak or valley point to fluctuate in a certain range. Therefore, investigating a method to accurately measure the Lcr wave TOF is necessary. In signal processing, the cross-correlation method 42 is used to judge the similarity between two signals at different times, which has the advantage of resisting environmental noise. ZW Ling et al. 43 employed the cross-correlation algorithm to measure the time delay of the Rayleigh wave and the Lcr wave; and the pressure of the vessel could be evaluated. The cross-correlation method provides a potential way to measure the Lcr wave TOF.
Goals of this study
In this study, the algorithm of measuring the Lcr wave TOF was developed based on the cross-correlation analysis by making the best use of the similarity between the two Lcr waves received by the two different receivers. The cross-correlation-based algorithm has the advantages of low computational cost and measurement of the Lcr wave TOF without signal de-noising. The features of the cross-correlation-based algorithm were demonstrated in laboratory experimental studies. Specifically, the cross-correlation algorithm is used to measure the Lcr wave TOF under different stress conditions for four samples, and the correlation between the Lcr wave TOF difference and the stress is discussed. The applied stresses on a steel member loaded by the testing machine are measured using the presented method, and the results are compared with those obtained using the traditional peak value method. In addition, the influence of the sampling rate on the Lcr wave TOF is discussed.
Theory
Absolute stress measurement using Lcr waves
A typical schematic diagram of the Lcr wave method is shown in Figure 1. The center frequency of the three transducers (one transmitter and two receivers) is identical. The transmitter transducer transmits a longitudinal wave. When the longitudinal wave travels from the poly(methyl methacrylate) (PMMA) material to the steel at the first critical angle (approximate 25.7°), the first refracted longitudinal wave transforms into the Lcr wave. Then, the Lcr wave is generated and travels in parallel to the component surface and is finally received by two receiver transducers.
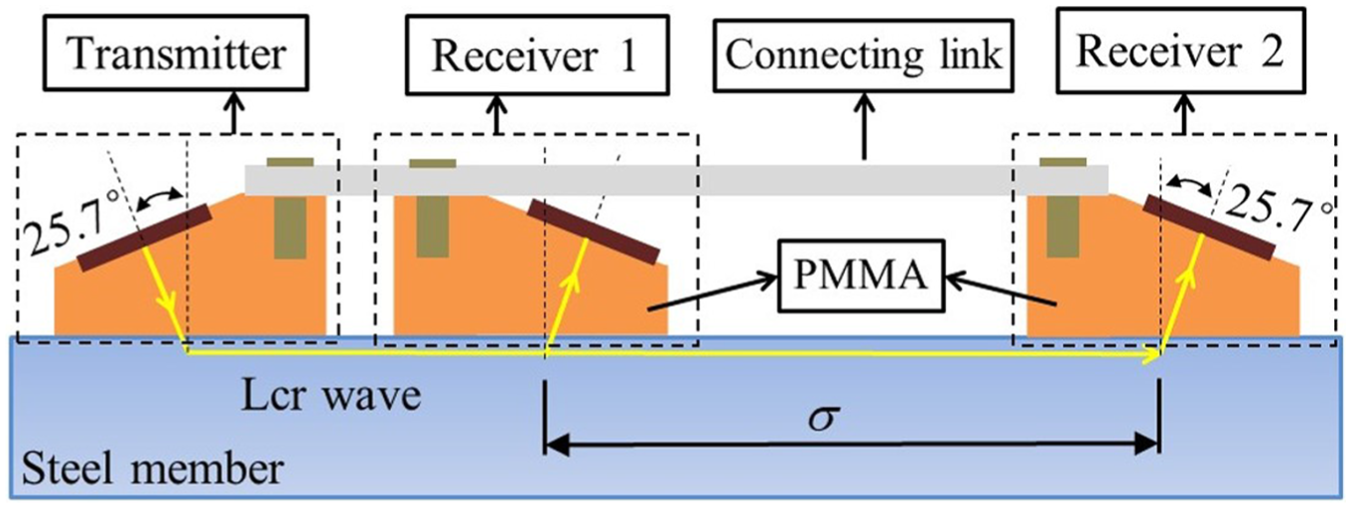
Schematic diagram of the Lcr wave method.
According to the acoustoelastic theory, the relationship between the stress and Lcr wave velocity traveling parallel to the stress direction can be written in the following form 26

where V is the Lcr wave velocity when the steel member is under free-stress condition; ρ0 is the material density; λ and μ are the Lamé constants; and l, m, and n are the Murnaghan constants.
By using the fixed acoustic path method, the relationship between stress and the Lcr wave TOF can be obtained. By making further simplifications, the following formulas can be obtained 22

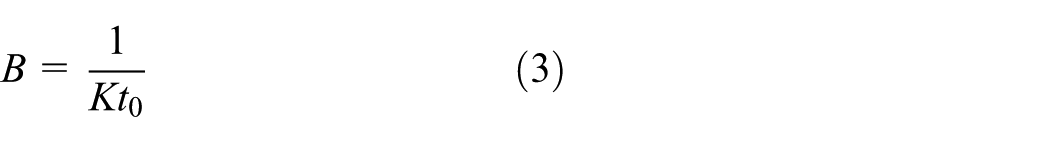

where B is the factor of stress to the acoustic time difference (SATD) and t0 and t are the Lcr wave TOFs in the free-stressed and stressed steel members, respectively. From equation (2), the accuracy of the stress depends on the Lcr wave TOF measurement.
Cross-correlation-based algorithm for Lcr wave TOF measurement
Typical waveforms received by the two receiver transducers from Figure 1 are shown in Figure 2. Because the Lcr wave received by the second receiver travels a longer distance, its energy is more seriously attenuated, and thus, a lower amplitude in the time-domain signals is the result. However, the waveforms of the first and second Lcr waves are nearly the same, which makes it possible to measure the Lcr wave TOF between the two receivers using the cross-correlation-based algorithm.
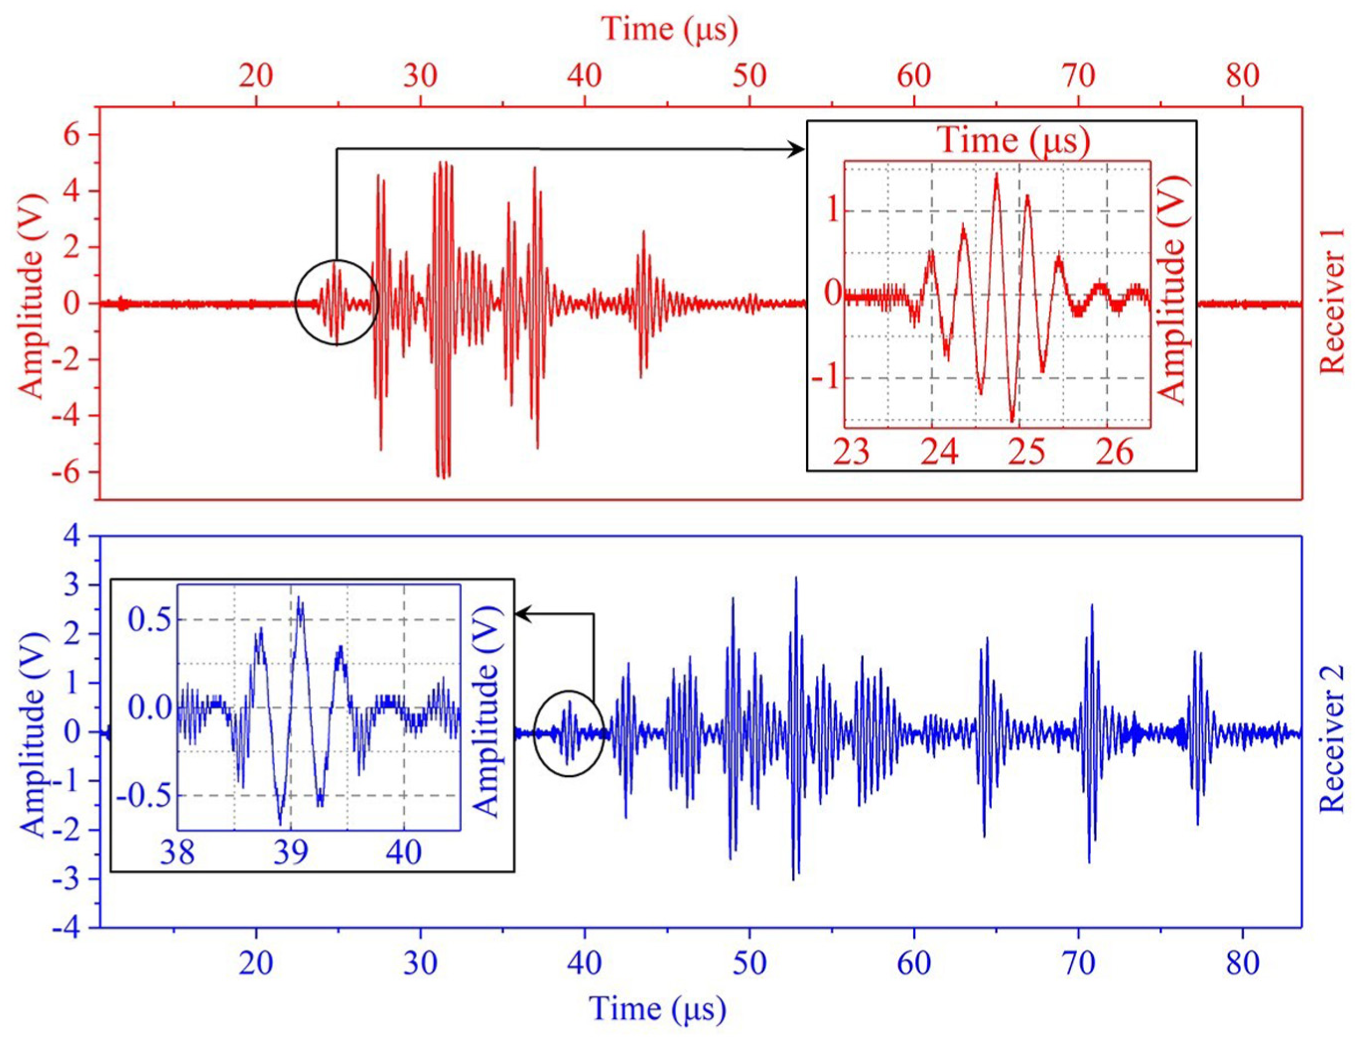
Typical waveforms received by the two receivers.
Assuming S(n) is a series of points representing the waveform of the Lcr wave, the waves received by the two receivers can be written in the following forms


where F(n) and G(n) are two signal series received by receiver 1 and receiver 2, respectively; m* is the Lcr wave signal delay; N1(n) and N2(n) are noises received by receiver 1 and receiver 2, respectively; and n is the number of sampling points.
The cross-correlation function between F(n) and G(n) is as follows

where F(n – m) is the sequence right slided m points by F(n). By substituting equations (5) and (6) into equation (7), a new formula can be obtained
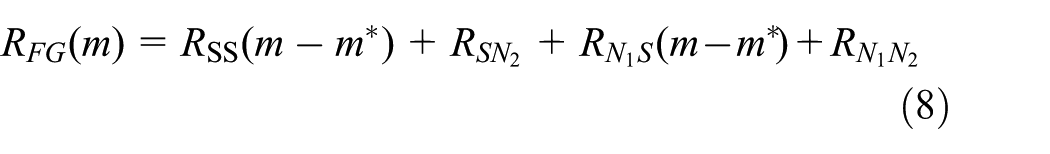
The cross-correlation between the noise and Lcr wave is zero. 42 Therefore, equation (8) can be simplified as follows

According to the nature of the self-correlation function, when m = m*, RSS(m – m*) obtains the maximum value. Therefore, the position in time of the maximum amplitude corresponds to the signal delay.
The center frequency of the transducer is approximately 3 MHz. The generated Lcr wave contains the frequency components from 1 to 5 MHz. Thus, the cross-correlation function, RFG(m), fluctuates over a limited range, which is shown in Figure 3. Because the Savitzky–Golay method can effectively preserve the original features of the data, it is used to smooth the cross-correlation curve. When the peak value of the cross-correlation curve reaches the maximum, the first Lcr wave can be regarded as slided to the position of the second Lcr wave, that is, the two Lcr waves coincide with each other. Then, the Lcr wave TOF between the two receivers is as follows

where Δt is the interval time between two points and m* is the m*th point when the cross-correlation curve reaches the maximum value.
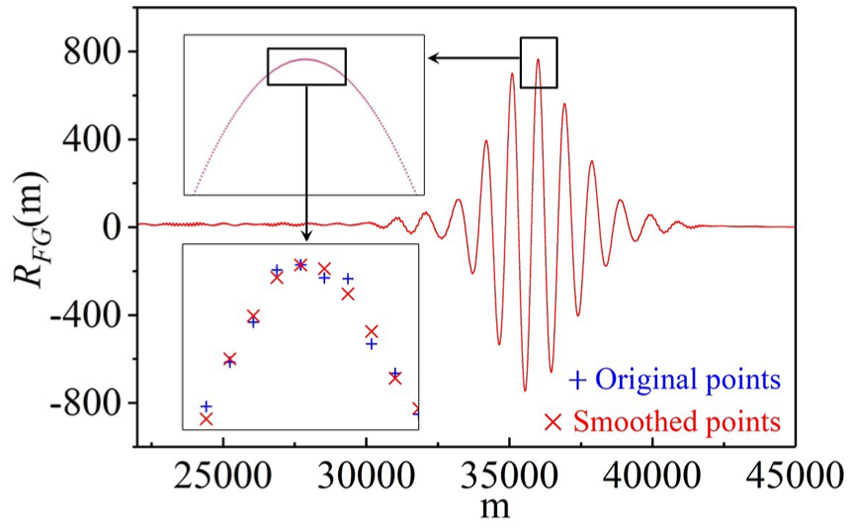
Illustration of the cross-correlation sequence RFG(m).
Methodology
According to the Lcr wave stress measurement theory and cross-correlation-based algorithm, the measurement devices are selected and a measurement system is designed in this study, which is shown in Figure 4. A sensor group, which contains one transmitter and two receivers, is designed to transmit and receive Lcr waves. The sensor group can accurately characterize the Lcr wave propagation path and the Lcr wave TOF. 30 In addition, the environmental effects, such as ambient temperature, on the Lcr wave velocity can be decreased.31,32,34,44

Experimental setup for the measurement system.
The ultrasonic generator transmits a beam of pulse voltage signals and shunts them into the transmitter, which contains a chip made of piezoelectric ceramics. Because of the inverse piezoelectric effect, a longitudinal wave is produced and travels from the PMMA to the steel at the angle of 25.7°. The Lcr wave is generated and travels in the steel member. Then, the Lcr wave is received by two receivers with the same center frequency. The two Lcr waves are amplified by two ultrasonic preamplifiers and then collected by the oscilloscope. The Lcr wave TOF between the two receivers can be obtained by measuring the time delay of the second Lcr wave. To make a constant coupling film thickness between the transducers and steel member, two high-strength magnets are embedded in each probe to ensure a constant pressure.
In this work, the critical angle is calculated from the Snell’s law. Then, the piezoelectric chip angle knob on the transducer is fine-tuned to ensure that the amplitude of Lcr wave reaches maximum. Therefore, the critical angle of the transmitter and receivers is 25.7°. Note that the critical angle is different from some previous works.31,32,34,44 This difference may be caused by the different steel materials under study. The dimension of the magnet is 10 mm × 5 mm × 2 mm. The magnet is embedded in the edge of the PMMA to enable close contact and effective coupling between the PMMA and the steel member. The Lcr wave signals were collected by oscilloscope with a sampling rate of 2.5 GSa/s, and the wavelet transform method was used for signal de-noising. The experiment results show that the Lcr wave TOFs with and without the magnet are identical. Therefore, the influence of the magnets on the Lcr wave propagation is not taken into account during the experiments.
A five-step framework for measuring the Lcr wave TOF and absolute stress is proposed:
1. A replication member, with the same material as the tested object, is employed for parametric calibration. The transducers are attached to the replicated member surface when it is under free stress. The signal sequence received by receiver 1 when the steel member is under a free-stress condition is defined as F(n). The signal sequences received by receiver 1 and receiver 2 when the steel member is under the stress condition are defined as G1(n) and G2(n), respectively.
2. Calculating the cross-correlation function of the two sequences. For the sequence F(n), the starting and ending points are on the left and right sides of the Lcr wave, respectively, such that the whole Lcr wave signal is selected as an analysis object. For the sequences G1(n) and G2(n), the starting points are the same position as F(n), while the ending point is on the right side of the second Lcr wave. By right sliding the sequence F(n), the cross-correlation function in the different sliding positions can be calculated, and the cross-correlation curve can be obtained. After smoothing the cross-correlation curve using the Savitzky–Golay method, the maximum value in the cross-correlation curve can be collected. When the sample is under the free-stress condition, the signals received from the receivers 1 and 2 can be used to calculate the Lcr wave TOF, t0, using equation (10).
3. Measurement of the Lcr wave TOF under different stress conditions. The testing machine is used to increase the tensile stress in the replicated member. The Lcr wave TOF between the two receivers under the ith stress condition is as follows

where ti is the Lcr wave TOF between the two receivers under the ith stress condition,
4. Linear fitting of the factor, B, in equation (2). The Lcr wave TOF difference between free-stressed and stressed condition can be calculated. Thus, a set of data ((t1 – t0, σ1), (t2 – t0, σ2), …, (tn – t0, σn)) can be obtained. Using the least square method, the slope of the trend line can be calibrated.
5. The absolute stress measurement for the tested object. The Lcr wave TOF in the tested steel member can be measured as that in step 3. Using the fitted SATD factor B and equation (2), the absolute stress in the tested object can be calculated.
Experimental procedures
Sample description
In civil engineering, Q235 steel is widely used in load-bearing components and in connecting members. In this work, four Q235 steel members (samples A, B, C and D), with the same dimensions of 370 mm × 40 mm × 10 mm, are employed as research objects. The four specimens are cut and machined from the same steel plate. To reduce the influence of the specimen surface roughness on the coupling film thickness, the steel member surface is polished until the surface roughness is less than 10 μm. The mechanical properties and chemical composition of the four steel members are shown in Table 1. The calibration of the parameters and the stress measurement for the steel members are completed at room temperature.
Mechanical properties and chemical composition of Q235 steel.

Parametric calibration
The four samples were used for parametric calibration. The transducers, which are connected by a Vernier caliper, were attached to the center of the four steel member surfaces. The distance between receiver 1 and receiver 2 is approximately 60 mm. The central frequency of the three transducers is approximately 3 MHz, and the frequency spectrum is shown in Figure 5.

The frequency spectrum of the transducers.
The steel members were loaded with an increase in stress of approximately 20 MPa using the electronic universal testing machine. The Lcr waves received by the two receivers were recorded by the oscilloscope at a sampling rate of 2.5 GSa/s under each stress condition. Using equation (7), the cross-correlation sequences were calculated, and the corresponding cross-correlation curves were obtained. After being smoothed, the maximum peak points in the cross-correlation curves were collected and the Lcr wave TOFs under each stress condition were calculated using equation (11). Thus, the SATD factors in equation (2) were fitted for the four specimens using the least-squares method. To investigate the influence of the sampling rate on the Lcr wave TOF measurement and parameter calibration, the above process was repeated at sampling rates of 2.0, 1.0, and 0.5 GSa/s.
The peak value method was also employed to process the above signals, and the measurement method can be found in previous papers.22,30 Because the high-frequency noises hinder the accurate capture of the peak point in the Lcr wave, the Lcr wave signals were filtered using the wavelet transform method. The MATLAB software (MATLAB R2014b) was used to write a program. Specifically, the function “ddencmp” returned default values for denoising the Lcr wave signal; then, the function “wavedec” returned the wavelet decomposition of the Lcr wave signal at level 4, using “db16”; finally, the function “wdencmp” performed a de-noising process of the Lcr wave signal. The SATD factors were fitted for the four samples with sampling rates of 2.5, 2.0, 1.0, and 0.5 GSa/s.
Absolute stress measurement in a steel member
A set of loads were applied to sample A using the testing machine. The transducers were attached to the sample A surface, and the distance of the two receivers was the same as that of the parametric calibration. The cross-correlation-based algorithm and the peak value method were used to measure the Lcr wave TOF. With the calibrated coefficients under the sampling rate of 2.5 GSa/s, the applied stresses in sample A can be calculated using equation (2). The strain gauge method was used to verify the results measured by the cross-correlation-based algorithm and the peak value method.
Results and discussions
Stress coefficient under different sampling rates
Change in the cross-correlation curves affected by the stresses in sample A (sampling rate: 2.5 GSa/s) is illustrated in Figure 6, and the fitting lines of the SATD factors for the four specimens are shown in Figure 7. For the peak value method, the Lcr waves (received by the second receiver) affected by the stresses and the fitting lines are shown in Figures 8 and 9, respectively. Figure 6 shows that the cross-correlation curve has a tendency to move right with the increase in the tensile stress in sample A. This indicates that the Lcr wave TOF between the two receivers increases with the tensile stress, which is in accordance with the phenomena shown in Figure 8. Both Figures 7 and 9 illustrate that the Lcr wave TOF difference exhibits a perfect linear relationship with the stress in all four samples.

Change in the cross-correlation curves affected by the stresses in sample A (sampling rate: 2.5 GSa/s).
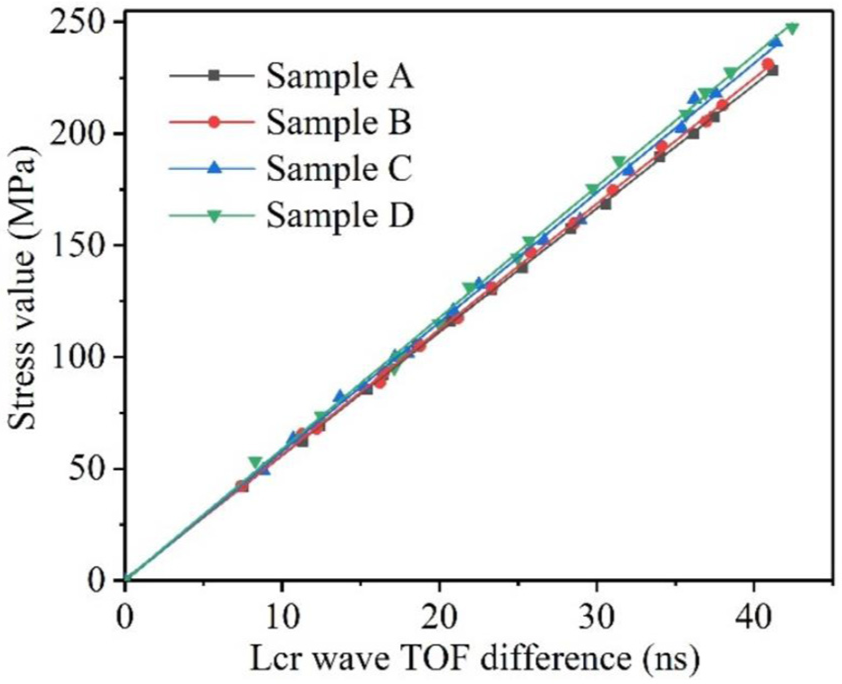
Fitting lines of the SATD factors for the four specimens using the cross-correlation-based algorithm (sampling rate: 2.5 GSa/s).

Change in the Lcr waves (received by the second receiver) affected by the stresses in sample A (sampling rate: 2.5 GSa/s).
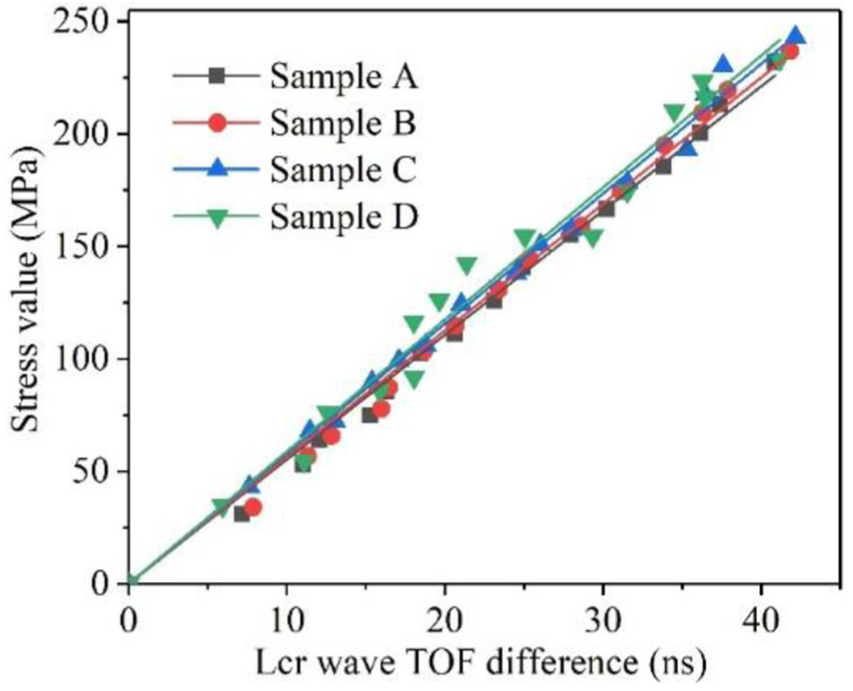
Fitting lines of the SATD factors for the four specimens using the peak value method (sampling rate: 2.5 GSa/s).
All the fitted SATD factors for the four specimens under different sampling rate and the corresponding correlation coefficient (R2) using the two methods are shown in Figures 10 and 11, respectively. The comparison of the coefficients is listed in Table 2. In comparison with the peak value method, the correlation coefficients of the SATD factors using the cross-correlation-based algorithm are better at each sampling rate, which is shown in Figure 11. In addition, the stress errors caused by the Lcr wave TOF measurement are smaller. This indicates that the cross-correlation-based algorithm can obtain a more accurate Lcr wave TOF than the peak value method. The main reason is that the cross-correlation-based algorithm calculates the similarity of two Lcr waves at different times, while the peak value method evaluates the time delay of a peak point in the Lcr wave. In fact, when the Lcr wave propagates in steel members, the waveform is easily affected by factors such as inhomogeneous material and microcracks in steel, which may lead to the distortion of the Lcr waveform. Thus, the peak and valley points may fluctuate over a small range, which results in an inaccurate measurement of the Lcr wave TOF. In this study, the aim of using the cross-correlation algorithm is to analyze the whole Lcr wave signal, but not a single peak point in the Lcr wave. The fluctuation of the distortion points exerts a relatively small impact on the Lcr wave TOF measurement. Therefore, the cross-correlation-based algorithm obtains a better correlation coefficient than the peak value method.

The SATD factors of the four samples with different sampling rates.

The correlation coefficients (R2) of the four samples with different sampling rates.
Coefficients of the fitting lines with four sampling rates using the two methods.

Average is the mean value of a specific coefficient for the four samples.
The stress error is the product of the average value of the SATD factor (B) and the standard deviation of the Lcr wave TOF (t0).
The coefficients in Figure 11 with red color are measured using the cross-correlation-based algorithm. The four samples show the same tendency, in which the correlation coefficient (R2) is reduced with a decrease in the sampling rate. When the sampling rates are 2.5 GSa/n and 0.5 GSa/s, the correlation coefficients are 0.9994 and 0.9533, respectively, which shows a certain difference. In fact, the sampling rate of the signal is related to the time resolution. When the sampling rates are 2.5 GSa/n and 0.5 GSa/s, the time resolution is 0.4 and 2.0 ns, respectively. This illustrates that the low sampling rate leads to a decrease in the Lcr wave TOF recognition accuracy. Although the cross-correlation-based algorithm can offer better Lcr wave TOF results than the peak value method, it is difficult to improve the Lcr wave TOF resolution. The effective way to obtain a better Lcr wave TOF resolution is to increase the signal sampling rate.
When the sampling rate is 2.5 GSa/s, Figure 11 shows some discrepancies of the fitted SATD factors for the four samples, which may be caused by the texture of the materials. Although the four samples are cut from the same steel plate, the machine process may lead to uneven changes in the surface and internal material of the four samples. However, these differences are small and can usually be ignored.
Absolute stress measurement results
The measurement results of the applied stresses in sample A using the three methods are shown in Figure 12. The error comparison between the cross-correlation-based algorithm and peak value method is shown in Figure 13. Figure 12 shows that the applied stress in sample A can be measured using the cross-correlation-based algorithm and the peak value method. The maximum difference for the cross-correlation-based algorithm is 6.7 MPa, while the peak value is approximately 16.0 MPa. Overall, the cross-correlation-based algorithm is more consistent with the strain gauge method.

The measurement results of the three methods.

The error comparison between the cross-correlation-based algorithm and peak value method.
Note that the original Lcr waves are not de-noised when the cross-correlation-based algorithm is used to measure TOF. The essence of the cross-correlation-based algorithm is the amplification of the Lcr wave energy and the suppression of the noise signal. Theoretically, the effects of the noise signal on the cross-correlation-based curve are ignored, which is illustrated in equations (8) and (9). The noise signal can lead to small fluctuations in the cross-correlation sequences. Thus, the Savitzky–Golay method is used to smooth the cross-correlation curve. Figure 3 indicates that there is little difference between the two sequences before and after smoothing, but the smoothed curve is more convenient for the maximum peak value collection. The cross-correlation algorithm in this study provides a potential way to measure the Lcr wave TOF for steel member absolute stress evaluation in practical engineering applications.
Conclusion
In this article, a cross-correlation-based algorithm is presented to measure the Lcr wave TOF and absolute stress in steel members. According to the achieved results, the conclusions are summarized as follows:
The cross-correlation-based algorithm makes use of the cross-correlation to study the similarity of two Lcr waves, which are received by two different receivers. The original Lcr waves are used directly without being filtered to calculate the cross-correlation sequence. The maximum peak point in the cross-correlation curve corresponds to the Lcr wave TOF.
The cross-correlation-based algorithm and the peak value method are used to measure the Lcr wave TOF under different stress conditions. The stress and corresponding Lcr TOF difference is linearly fitted. The correlation coefficients of the cross-correlation-based algorithm are better than the peak value method.
With the decrease in the sampling rate, the correlation coefficient is reduced and the stress measurement error increases. The presented cross-correlation-based algorithm cannot compensate for the shortage of high sampling rates of the Lcr wave method.
A set of random stresses are measured using the cross-correlation-based algorithm and the peak value method, and the results of the former are more accurate. As the cross-correlation-based algorithm has the advantage of resisting environmental noise, it provides a potential way to accurately measure the Lcr wave TOF and evaluate the absolute stress in practical engineering applications.
Footnotes
Acknowledgements
The co-first authors (Z.L. and J.H.) contributed equally to this work.
Handling Editor: Lalit Borana
Declaration of conflicting interests
The author(s) declared no potential conflicts of interest with respect to the research, authorship, and/or publication of this article.
Funding
The author(s) disclosed receipt of the following financial support for the research, authorship, and/or publication of this article: This work was financially supported by the National Key Research and Development Program of China under Grant 2016YFC0701102, the National Natural Science Foundation of China under Grant 51538003, the National Major Scientific Research Instrument Development Program of China under Grant 51827811, and Shenzhen Technology Innovation Program under Grant JCYJ20170811160003571. The authors would like to thank these financial supports.