
Abstract
Continuously welded rail (CWR) has been widely applied in modern railway structures, and its performance is directly related to the safety of railway transportation. After the removal of the rail joints, the CWR cannot expand and contract freely. The longitudinal temperature stress within the CWR turns out to be the core structural parameter in the maintenance and repair of the track. In this study, an ultrasonic theoretical model of the rail temperature force was established, and the mechanism of the critical refracted longitudinal wave to detect the rail temperature stress was analyzed. A numerical simulation calculation was conducted with the three-dimensional finite element model, and the longitudinal wave incidence angle, frequency, and transducer spacing were calculated. The impact of critical factors on the accuracy of refracted longitudinal wave detection temperature stress was investigated. The ultrasonic acoustic propagation under the corresponding stress value of the rail was calibrated to eliminate the influence of residual stress and ensure the accuracy of ultrasonic detection of temperature stress. Finally, an online rail temperature stress monitoring system was built, and a long-term operation was carried out in the Changzhou section of the Shanghai-Nanjing high-speed rail. The monitoring data of the line in 2019 was obtained, and the temperature stress change of the line was recorded. The data showed that the ultrasonic sound obtained by real-time monitoring could accurately reflect the temperature and force changes of the rail. This proposed method is expected to provide a solution for online and remote acquisition of the temperature stress of the CWR. The accumulated long-term monitoring data is of great significance to the prevention plan for rail expansion and rail breakage.
Keywords
Introduction
The continuous welded rail (CWR) has gained wide application throughout the world because it reduces the impact load between the wheels and the rails with no rail joints to effectively reduce train vibration, improve the train speed, and extend the service life of the rails and wheels. 1 However, the long steel rail cannot expand and contract freely caused by external temperature changes. Under the combined action of multiple factors such as temperature and wheel/rail load, rail breakage, and rail expansion 2 often occur.
The temperature-stress CWR can be divided into energy methods, 3 strain methods, and stress methods 4 according to the detection principle. Energy methods, such as forced lateral displacement and rail lifting, 5 release the stress in the line by large machinery and estimate the internal accumulated stress, which is laborious and affects the normal operation of the line, especially in the short maintenance period of high-speed railway.
Strain method, such as resistance or fiber Bragg grating sensor, is used to detect the strain of rail and calculate the stress of rail. However, as the most important component of the railway structure, the rails are subjected to temperature stress and the huge wheel-rail force interaction, so zero drift 6 is inevitable. The high cost of the fiber-optic strain sensor also hinders its large-scale promotion.
Stress methods use the acoustic, electrical, or magnetic changes caused by the material’s physical changes of CWR under the stress field to characterize the internal temperature stress of CWR. 7 The representative methods include the ultrasonic method, 8 the X-ray method, 9 and Barkhausen method, 10 etc. However, the X-ray method and Barkhausen method are more suitable for detecting rail surface temperature stress 11 because of their shallow detection depth. The ultrasonic method is concerned with acoustic elasticity. 12 The rail temperature fluctuation caused by the change of ambient temperature can change the density, elastic modulus, and Poisson’s ratio of jointless track in microcosmic, thus changing the internal stress and the ultrasonic wave velocity of the rail. By calibrating13–16 the acoustic time under the corresponding stress value of the rail, the interference of residual stress on the temperature stress detection can be eliminated. The transverse and longitudinal stress detection range of the ultrasonic method is large, and it is not affected by the locked rail temperature. 17
Leon-Salamanca and Bray 18 first proposed to detect stress using critical refraction longitudinal wave, which demonstrated the sensitivity of different acoustic waves to stress varied, with the critical refraction P-wave showing the highest sensitivity. Then the critical refraction longitudinal wave was applied in the stress detection of pressure vessel and weld, which verified its engineering value for stress detection. Javadi19,20 studied the residual stress of different materials with critical refraction P-wave and compared the results with that from studies adopting the traditional damage detection method and finite element simulation. This research complemented Bray’s, but it did not analyze the influencing factors of critical refraction longitudinal wave detection, and the detection accuracy needed to be further improved. Xu et al. 21 built an experimental and calibration system for detecting stress by critical refraction longitudinal wave and gained several fruits. The influence factors such as temperature, material structure, component curvature, surface roughness, and transducer frequency on the detection results and signal strength were analyzed briefly. Li et al., 22 He et al.,23,24 Wei et al.,25,26 and Haibo et al. 27 established a critical refraction P-wave stress detection system with a generator and two receivers. The change of critical refraction longitudinal wave velocity caused by stress was calculated with the cross-correlation algorithm and digital image correlation, which improved the accuracy of the detection results. The result was checked with the strain gauge method, and more accurate detection results were achieved. Jin et al. 28 mainly studied the relationship between the critical propagation direction of simultaneous interpreting critical waves and the sensitivity of residual stress detection. The results showed the strong sensitivity of critical refraction longitudinal waves to the residual stresses of the components. Yang et al. 29 detected the residual stress of rail under different states using critical refraction P-wave and analyzed the influence of transducer position, size, incident angle, and frequency of a longitudinal wave on the accuracy of residual stress detection of critical refraction longitudinal wave. However, there were also some problems in the research: firstly, the influence of the ambient temperature on the experimental results was not excluded in the analysis of the influencing factors, which resulted in some errors; secondly, the numerical simulation analysis was missing in the analysis of the influencing factors.
The critical refracted longitudinal wave is sensitive to the internal and near-surface temperature stress of the rail in the same direction as its propagation, but the change of sound velocity in ultrasonic rail temperature stress detection is weak. 30 Therefore, the analysis of influencing factors is expected to improve detection accuracy. In addition, most of the current research on the detection of critical refraction P-wave temperature stress is carried out in the laboratory, which fails to simulate the environment along the high-speed railway. In this study, a mathematical model of ultrasonic stress detection was first established, the feasibility of critical refraction P-wave detection of rail temperature stress was analyzed; the influence of key factors on the accuracy of critical refraction P-wave detection of rail temperature stress was studied through numerical simulation, and the key parameters of critical refraction P-wave detection of rail temperature stress were obtained. Finally, an online monitoring system for the temperature stress of critically refracted longitudinal wave steel rails was built in the Changzhou section of Shanghai-Nanjing high-speed rail in China. The temperature stress monitoring data of the line throughout the year of 2019 was obtained to get the temperature stress change of the line.
Critical refraction longitudinal wave detection model of rail temperature stress
According to Mumaghan’s finite deformation theory and strain energy expression, 31 the elastic wave velocity in a stressed solid can be expressed as:

where,
When the stress distribution is the same as the ultrasonic propagation direction, the strain in this direction 32 can be expressed as:

where

Assuming that the relative change of stress is small, the relative change of wave velocity with axial strain can be calculated from equations (1) and (3):

where
For isotropic materials, the relationship between strain and stress can be displayed as follows:

Substituting equation (5) into (4), the relationship between stress and wave velocity can be obtained as follows:
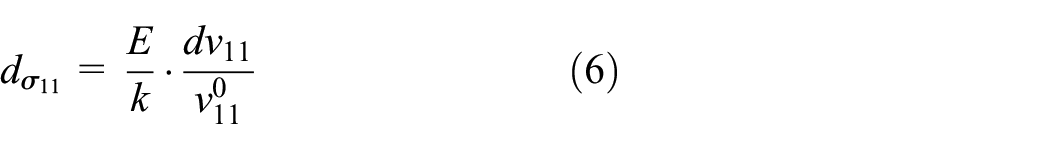
where
The elastic modulus and acoustoelastic coefficient of materials are fixed, and the amount of change in stress is proportional to the amount of change in ultrasonic wave velocity under zero axial stress. Therefore, with equal distance, the change of acoustic wave velocity in the object is equal to that of time, and the relationship between the change in stress and in acoustic wave propagation time can be further described as:

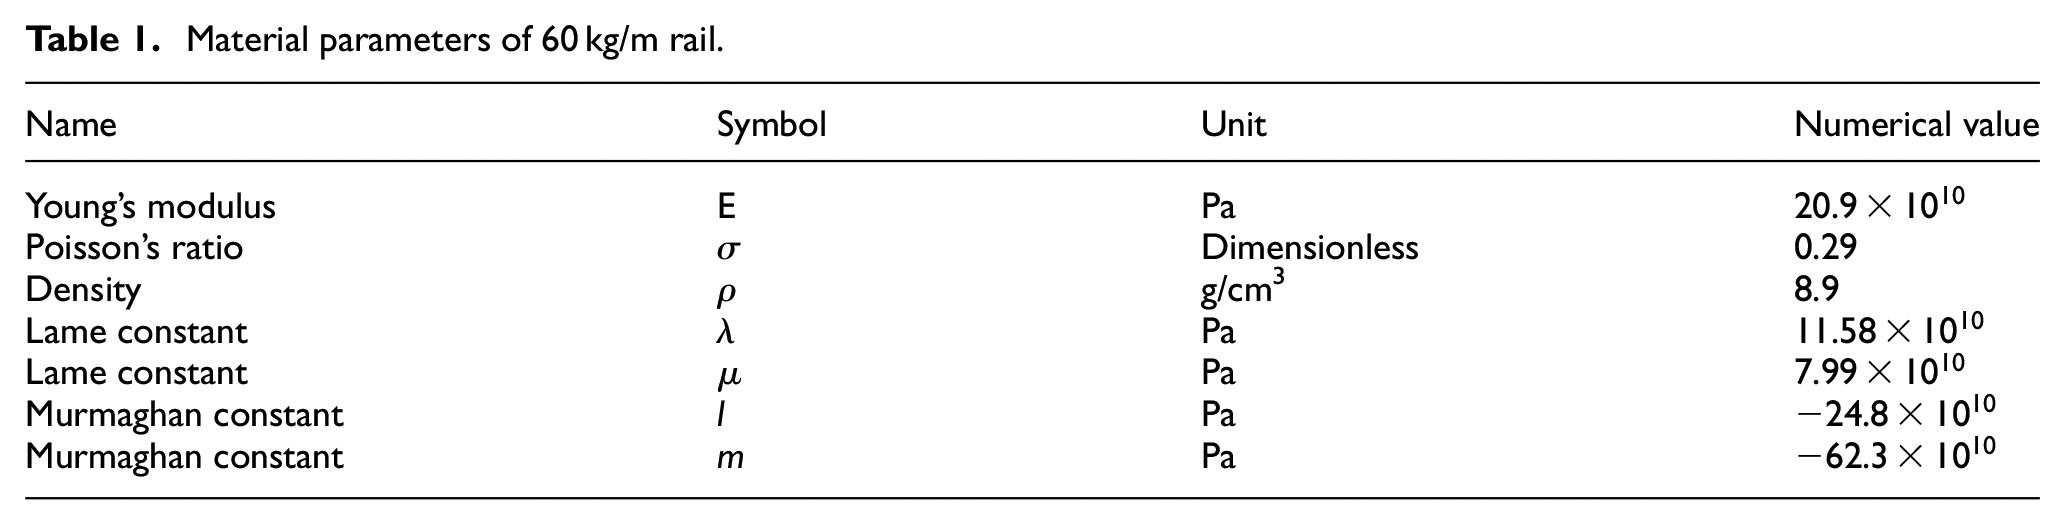
Equation (7) describes the relationship between the change in stress and in acoustic wave propagation time in an elastic material. Therefore, equation (7) is called the stress-acoustic time model. Rail is an elastic and isotropic material, and its material parameters are shown in Table 1,
Material parameters of 60 kg/m rail.

Broken track and rail expansion.

Rail stress-acoustic time relationship diagram.
Ultrasonic longitudinal waves are sensitive to stress but susceptible to echo interference that affects the extraction of acoustic time. According to Snell’s theorem, when the ultrasonic longitudinal wave propagates from the medium with slower acoustic speed to the medium with faster acoustic speed, it will be refracted, as shown in Figure 3. When the incident angle of the ultrasonic longitudinal wave satisfies

Schematic diagram of the critical refraction P-wave principle.
Acoustic physical parameters of PMMA and rail.

Numerical simulation analysis
Finite element model
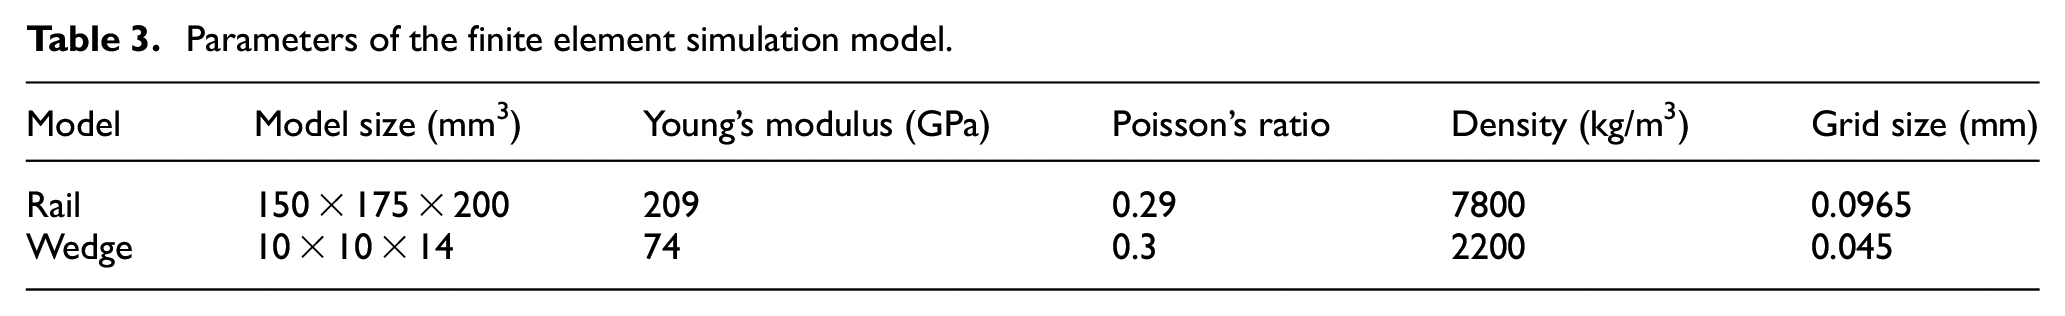
In this paper, a three-dimensional finite element model of critical refraction longitudinal wave for detecting rail temperature force was built with the finite element software ANSYS, as shown in Figure 4. The parameter settings of the 3D finite element model33–35 are shown in Table 3.
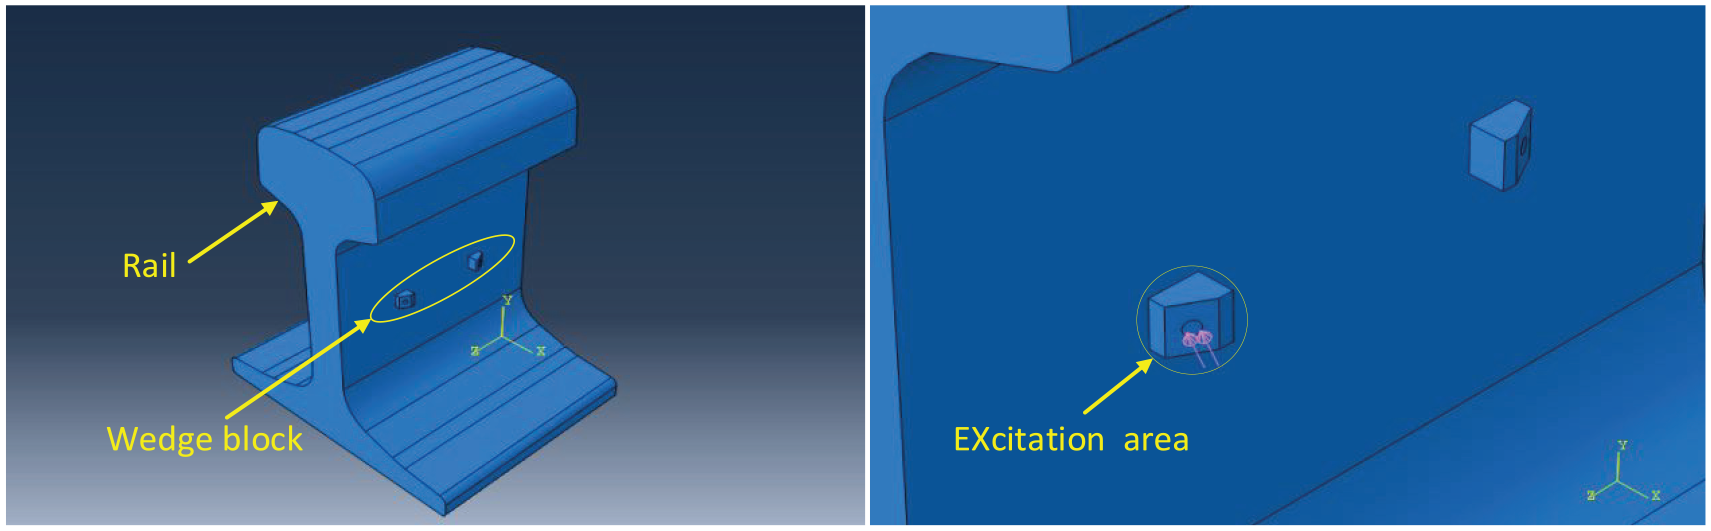
The three-dimensional finite element model.
Parameters of the finite element simulation model.
When the ambient temperature entered the steel rail through heat transfer, the non-uniformly distributed temperature field and thermal stress state were generated. The thermal stress analysis of the rail was carried out to obtain its thermal stress distribution field to ensure the accuracy of the simulation results. The thermal stress distribution field was used as the initial condition of the simulation to improve numerical simulation accuracy. Figure 5 shows the thermal stress distribution of the rail. Figure 5(a) shows the thermal stress distribution of the rail section when the rail temperature slowly rose from −10° to 60°. Figure 5(b) shows the weak deformation of the rail after the thermal stress.
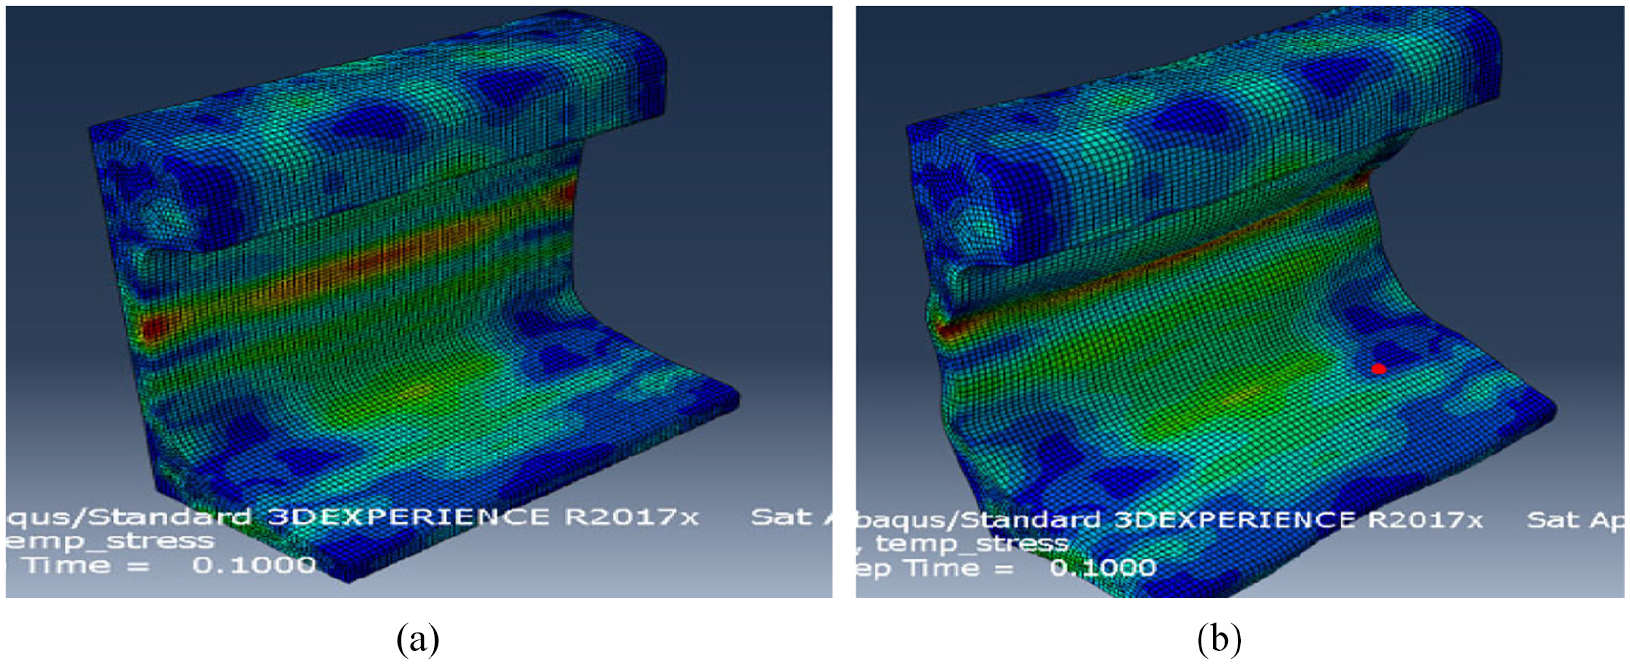
The sectional view of rail: (a) thermal stress distribution diagram and (b) weak deformation diagram.
The rail thermal stress distribution from −10°C to 60°C was taken as the initial condition and imported into the 3D simulation model of ultrasonic temperature stress detection to complete the coupling of temperature stress field and acoustic field. In this paper, a five-cycle Hanning-windowed sinusoidal wave pulse was used as the excitation signal, and the center frequency of the signal was 5 MHz. The time-domain and frequency spectrum of the excitation signal are shown in Figure 6.

Excitation signal and spectrogram: (a) time-domain diagram of excitation signal and (b) spectrogram.
Propagation law of critical refraction longitudinal wave in rail
The propagation process of the ultrasonic wave from wedge to rail is shown in Figure 7(a) to (d). When t = 0.5, the excitation signal generates two surface waves on the wedge slope; when t = 1, the ultrasonic wave is reflected and refracted at the wedge and steel junction, and part of the ultrasonic wave is refracted to the rail waist; when t = 3, the waveform conversion of the acoustic signal refracts to the rail; when t = 6, the acoustic signal in the rail produces refracted S-wave, refracted P-wave, critical refracted P-wave, and Rayleigh wave. The refracted P-wave propagates at a larger angle than the refracted S-wave. The refracted S-wave is perpendicular to the wave vibration surface at a slow speed. The critical refracted P-wave propagates on the subsurface, parallel to the rail waist, and first reaches the acoustic matching block. The Rayleigh wave propagates along the orbital waist at the slowest speed.
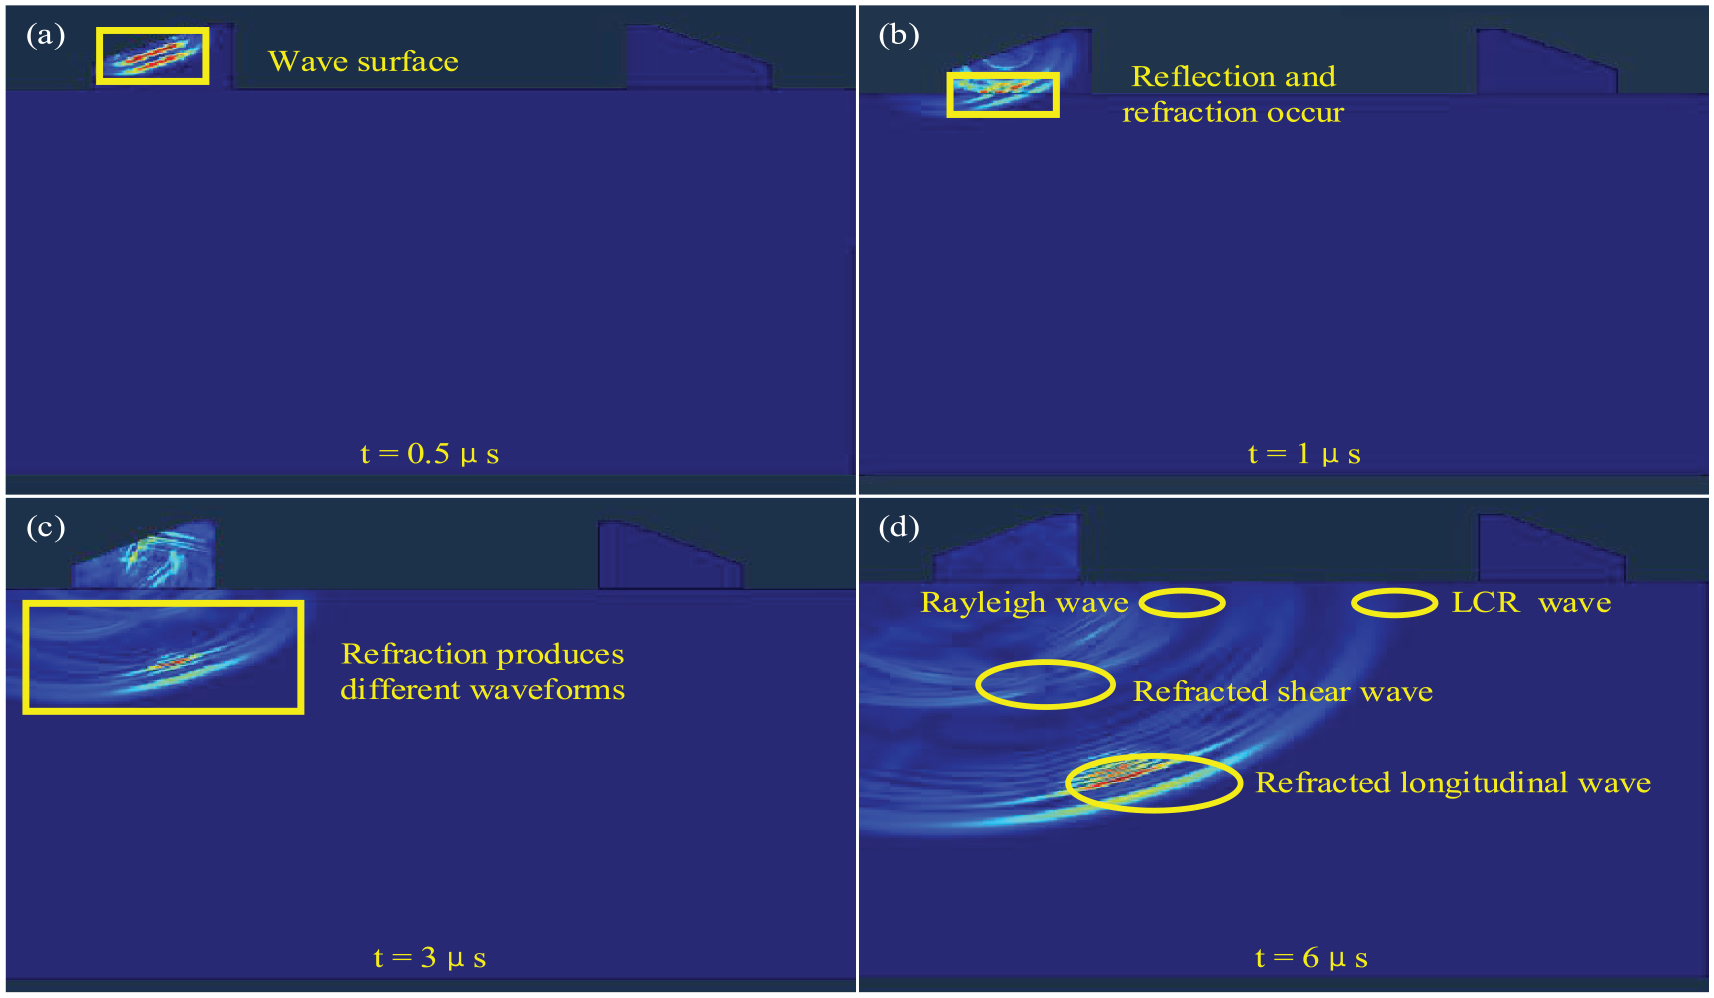
Ultrasonic propagation diagram of rail cross-section at different times: (a) 0.5μs, (b)1μs, (c) 3μs and (d) 6μs.
The critical refraction P-wave received by the receiver at −10°C to 60°C was extracted, as shown in Figure 8(a). The critical refraction P-wave packet moves backward with the increasing temperature. To visualize the relationship between acoustic time and temperature, 0°C was taken as the benchmark, the peak was taken as the characteristic value, and the relationship between acoustic time and acoustic pressure amplitude and the temperature was drawn, as shown in Figure 8(b). The critical refraction time increased with the increase of temperature.

Temperature-acoustic time relationship diagram: (a) time-domain signal diagram and (b) temperature-acoustic time difference diagram.
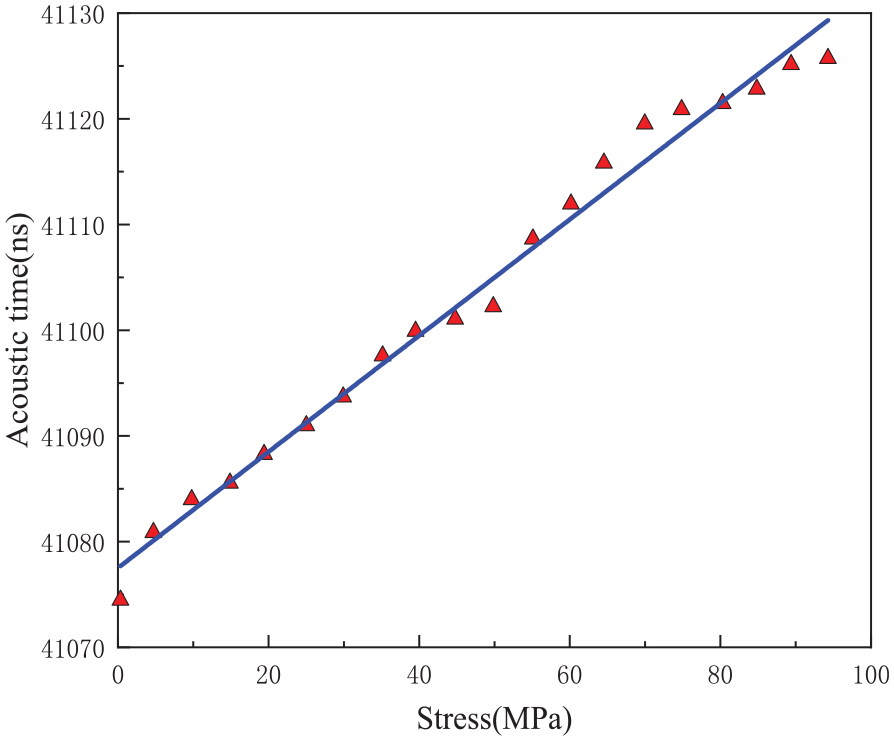
The relationship between temperature stress and acoustic time can be obtained by the one-to-one correspondence between rail temperature stress value and acoustic time result. Figure 9 shows a linear relationship between temperature stress and acoustic time, consistent with the analysis of the theoretical model.

Correspondence between temperature stress and acoustic time.
Analysis of key influencing factors
The influence of the incident frequency of acoustic waves
The diameter and frequency of the ultrasonic transducer can influence the acoustic resolution. When the transducer diameter is constant, the wavelength of the sound wave decreases, the acoustic beam energy becomes more concentrated, the half-diffusion angle decreases, and the acoustic wave resolution increases with frequency. However, the high-frequency pulse often decays rapidly in material propagation, reducing its scanning range. The appropriate incident frequency of the acoustic wave can be simply characterized by the half-diffusion angle of the acoustic wave for a transducer of the same diameter. The half-diffusion angle can be described as:

where D and C are the diameter of the ultrasonic transducer (m) and the propagation velocity of the critically refracted longitudinal wave in the rail (m/s), respectively; f is the ultrasonic incident frequency (Hz); and
When the center frequency is 1, 2.5, 5 MHz excitation signal, the received critical refraction longitudinal wave signal amplitude increases with the increased excitation signal center frequency, as shown in Figure 10. Therefore, a better critically refracted longitudinal wave signal can be obtained using an excitation source with a center frequency of 5 MHz.

Comparison of received signals at different frequencies.
The influence of longitudinal wave incident angle
The measurement accuracy increases with improved acoustic wave directivity. The acoustic pressure distribution in the 90° arc surface of the critically refracted longitudinal wave with different longitudinal wave incident angles at the rail-waist contact surface was measured. The distribution law of the critically refracted longitudinal wave directivity was then analyzed, as shown in Figure 11.
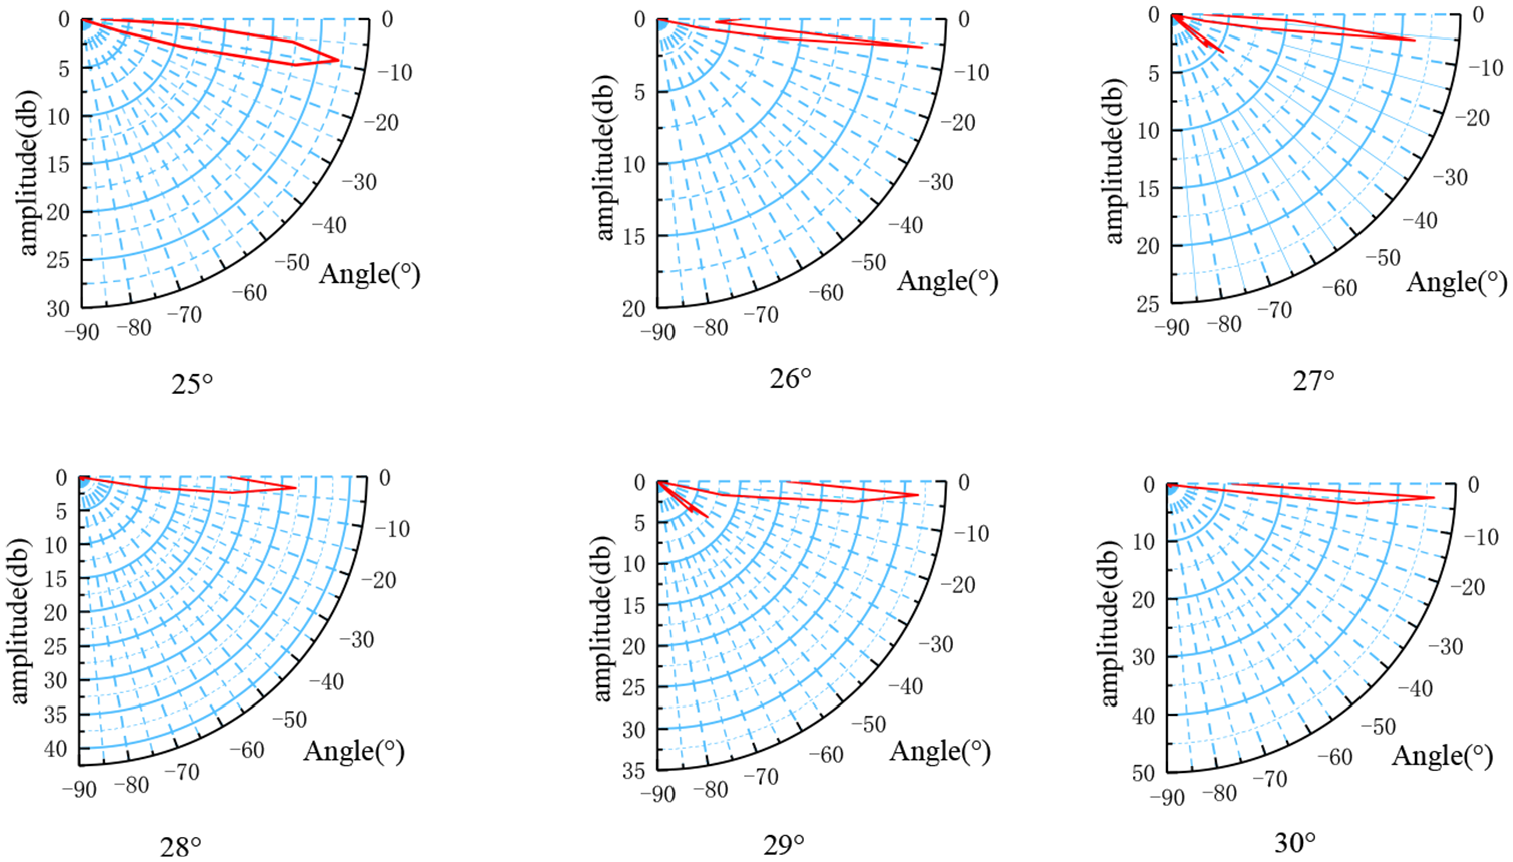
Measurement results of acoustic field directivity.
The acoustic wave incident angle, the angle between the main lobe of the acoustic wave and the orbit waist, and the acoustic pressure of the received signal are plotted in Figure 12(a) to quantitatively analyze the impact of the acoustic wave incident angle on the measurement results. When the longitudinal wave incident angle is 28°, the angle between the minimum acoustic pressure of the main lobe and the rail waist and the maximum acoustic pressure amplitude can be obtained. The critically refracted longitudinal wave signal received by the receiving transducer is collected when the longitudinal wave incident angle is 25°–30° and is represented by the red curve in Figure 12(b). When the longitudinal wave incident angle is 28°, the critically refracted longitudinal wave signal waveform is the clearest with the highest degree of recognition, which reduces the error of the calculation result. This conclusion is consistent with the critical refracted longitudinal wave excitation angle calculated by Snell’s Theorem.

Comparison of received signals from various angles: (a) LCR wave sound pressure amplitude and angle between main lobe and rail waist, (b) LCR wave received signal.
The influence of transducer distance
As shown in Figure 13, the acoustic wave enters the rail through refraction and produces refracted longitudinal wave and refracted shear wave. The refracted shear wave is formed after the acoustic wave reflecting onto the lower surface of the rail. The reflected shear wave interacts with the upper rail surface. Some reflected shear waves are converted into longitudinal waves propagating along the upper surface of the rail, while others continue to reflect into the interior of the rail. The refracted S-wave is converted into the reflected S-wave front is called the first acoustic path. The distance of the propagation of the reflected S-wave to the upper rail surface is called the second acoustic path. Therefore, the longitudinal wave is transformed by the refracted shear wave along the upper rail surface at the end of the even multiple acoustic paths, becoming an important factor affecting the critically refracted longitudinal wave receiving signals.

Schematic diagram of the acoustic paths.
According to Snell’s theorem,
Figure 14 shows that the critical refraction P-wave signals with transducer distances of 0.5, 1, and 1.5 HD are measured to analyze the influence of the harmonic generated by the reflection S-wave on the received signal of critical refraction. When the distance between transducers is an integer multiple, the critical refraction P-wave signal received in the box is weak and irregular. The surface harmonic on the rail waist increases abnormally with the increase of the transducer spacing of the subsequent wave, affecting the accuracy of the received signal. When the temperature stress is detected by the critical refraction P-wave, the transducer spacing should avoid the integral times of echo distance to improve the accuracy of critical refraction longitudinal wave.

The comparison of received signals of different acoustic paths.
Experimental verification
The experimental system
An online monitoring system of rail temperature stress is designed to study the measurement accuracy of rail temperature stress, as shown in Figure 15. The system consists of multiple ultrasonic transmitters/receivers (French M2M Co., Ltd., France), transducers (French M2M Co., Ltd., France), temperature sensors (Hangzhou Jianwei Electromechanical Technology Co., Ltd., China), mobile communication modules (Hangzhou Jianwei Electromechanical Technology Co., Ltd., China), solar power supply units (Wuxi Suntech solar energy Co., Ltd., China), and batteries (Wuxi Suntech solar energy Co., Ltd., China). The ultrasonic transmitting/receiving instrument emits electric pulses, which stimulate the ultrasonic transmitting transducer to emit the longitudinal wave and enter the rail at the first critical angle. The receiving transducer captures the critical refracted longitudinal wave signal propagating on the rail subsurface. The host computer filters the ultrasonic signal. Eigenvalues are extracted. The temperature sensor is close to the rail waist to obtain the real-time rail temperature collected by the collector. The ultrasonic characteristic data and rail temperature data of the sampling node are sent to the Ali cloud server with the 4G communication module.
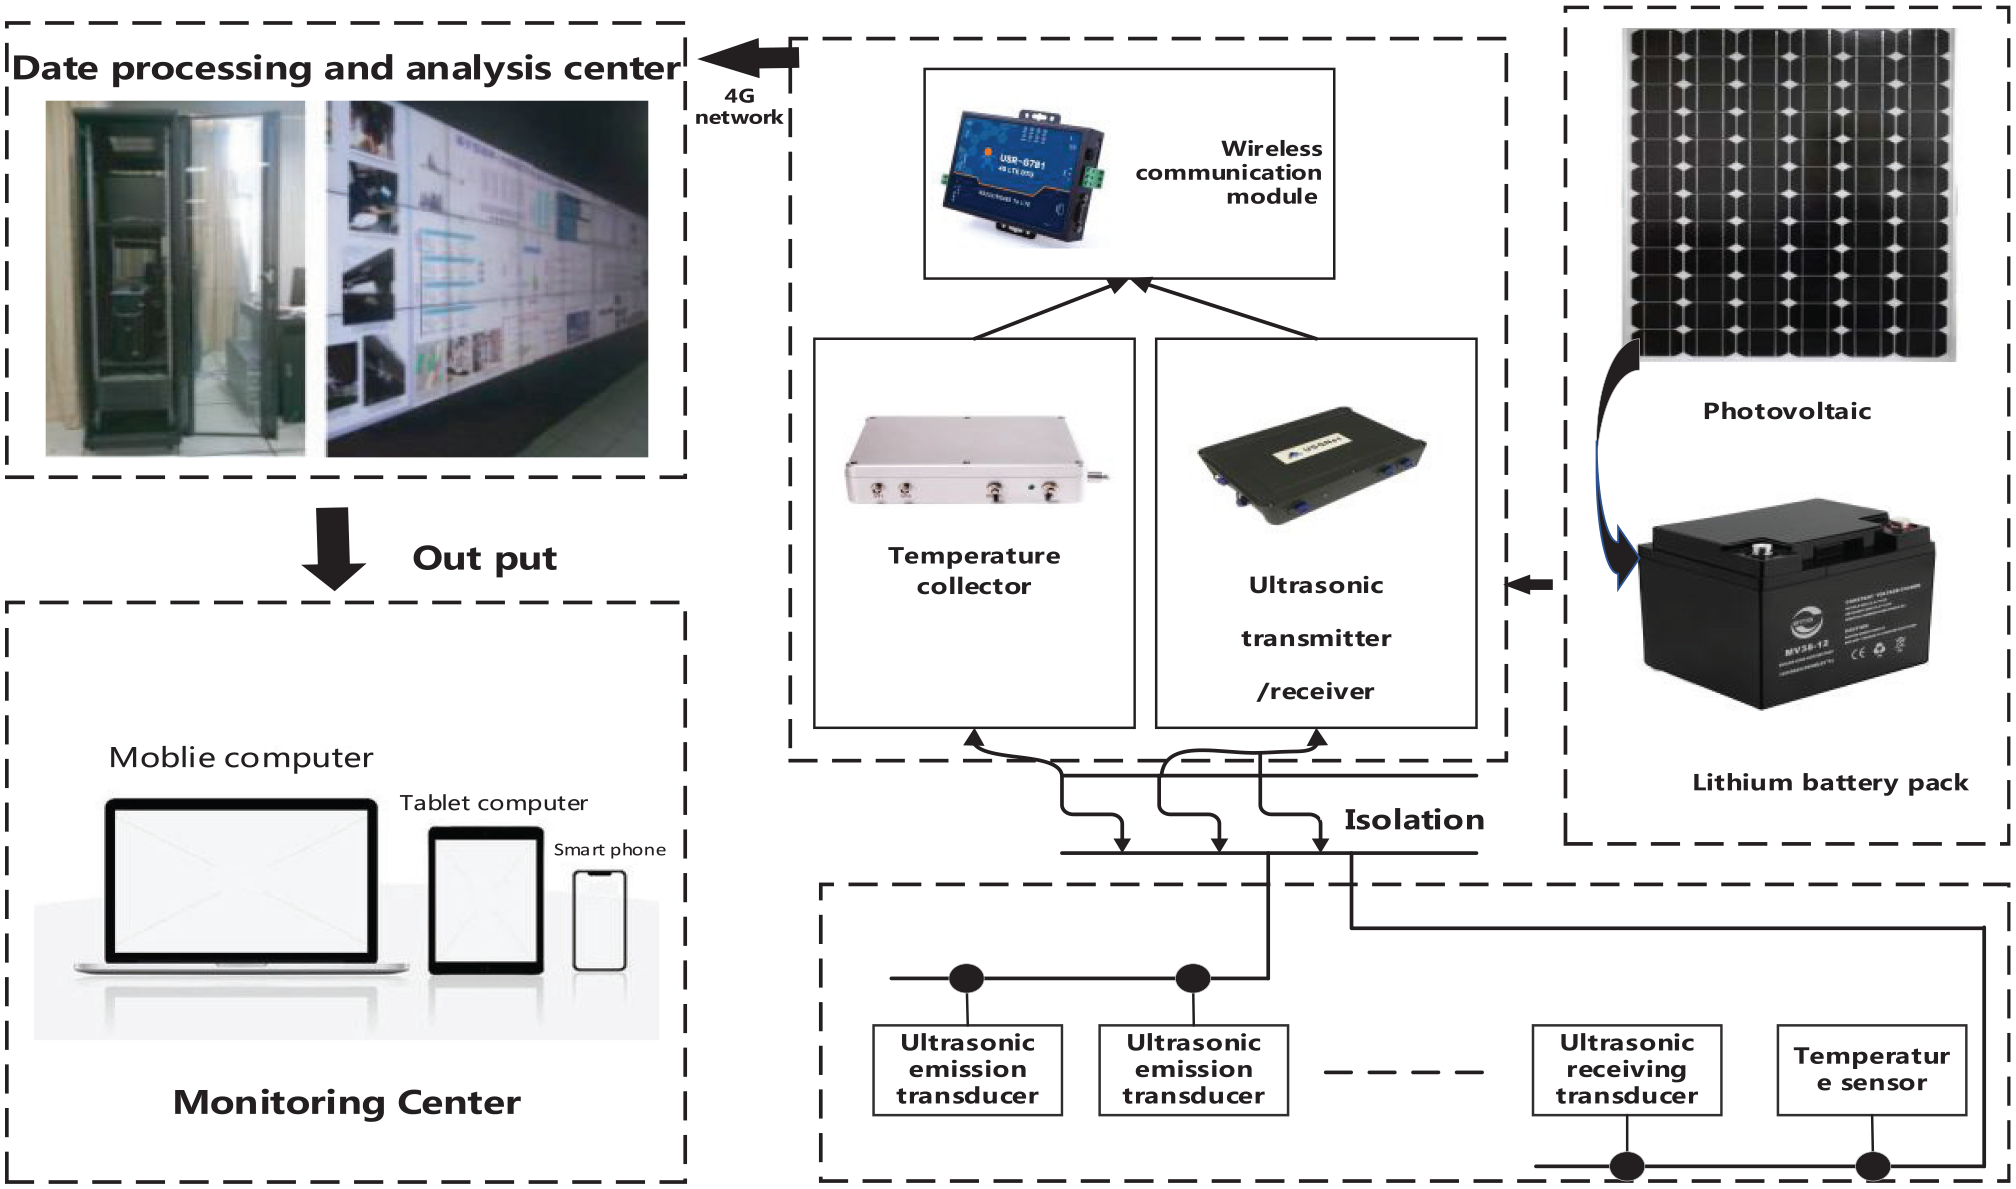
Schematic diagram of system design.
In 2019, an online monitoring system for rail temperature stress was installed on the Changzhou section of the Shanghai-Nanjing high-speed railway in China. The data of rail temperature stress and rail temperature for the whole year of 2019 were obtained. Figure 16 shows that the ultrasonic transducer and temperature sensor are respectively installed on the polished rail waist, the ultrasonic transmitter/receiver, temperature collector, 4G communication module. The battery is installed in the main control box.

The diagram of the experimental site.
Data analysis
The critically refracted longitudinal wave signal is collected, as shown in Figure 17. The signal-to-noise ratio of the collected signal is relatively high.

Time-domain and frequency-domain diagram of the excitation signal and received signal.
The temperature-acoustic time diagram is drawn using the monitoring data collected on November 24–26, 2019, as shown in Figure 18(a) to (c). Figure 18 shows that the rail temperatures on November 24 and November 26 reach the maximum value from 13:00 to 14:00 and slowly decrease. On November 25, a rainy day, the track temperature keeps falling. In light of these three monitoring data, the critical refraction longitudinal wave in the rail is linearly changed with the rail temperatures.

The relationship between temperature and acoustic time on November 24–26, 2019: (a) data from November 24, (b) data from November 25, (c) data from November 26.
Figure 19 shows the temperature stress and the acoustic time of 60 steel. The influence of residual stress is eliminated from the calibration experiment of 60 rails, and the accuracy of the temperature stress results is guaranteed to the greatest extent. The relationship between fitting curve temperature and stress is obtained, as shown in Figure 20(a) to (c) through the acoustic time-temperature stress relationship, making the internal stress of the rail in the current state intuitive.
The stress-acoustic time diagram of the calibration experiment.

The relationship between temperature and temperature stress on November 24–26, 2019: (a) data from November 24, (b) data from November 25, (c) data from November 26.
The temperature and temperature stress curves on November 24 and 26, 2019, first increased and then decreased, indicating that the temperature stress in the rail has a cyclic tensile stress-compressive stress-tensile stress conversion. The rail temperature continues to drop on November 25, a cloudy day, and the compressive stress of the rail also decreases. The results show that the internal temperature stress of the rail changes linearly with the temperature.
Conclusion
The real-time monitoring of thermal stress of CWR is crucial to prevent rail expansion, rail breaking, and other problems. In this paper, the stress detection model of ultrasonic rail is established, and the corresponding relationship between stress and ultrasonic acoustic velocity is studied. The 3D finite element model of rail temperature stress detection is established. The effects of key factors such as incident angle and frequency of the longitudinal wave and transducer distance on the detection accuracy are analyzed. The corresponding relationship between temperature stress and critical refracted longitudinal wave signal sound velocity is obtained. Finally, an online monitoring system of rail thermal stress is set up in the training base of the Changzhou section of the Shanghai-Nanjing high-speed railway in China for long-term real-time monitoring. The specific conclusions are as follows:
Theoretical analysis shows that ultrasonic longitudinal wave is sensitive to the thermal stress in its propagation direction. The acoustic propagation varies with thermal stress, proving that it is feasible to detect rail thermal stress by critical refraction longitudinal wave.
The numerical simulation analysis shows that the temperature stress of the rail is measured. The transducer with a 4 mm radius is used. The incident frequency of the longitudinal wave is 5 MHz, the incident angle is 28°, and the distance between transducers avoids the integer times of echo distance. The receiving transducer can receive the clearest critical refraction longitudinal wave signal, and the highest detection accuracy can be achieved.
Through the online monitoring system of rail temperature stress, temperature stress monitoring data of the line in 2019 has been accumulated. The accumulation of long-term monitoring data forms the design specification of seamless lines, providing technical support for the construction and maintenance management of public works.
The method for rail temperature stress detection using the critically refracted longitudinal wave can realize the long-term monitoring of the rail temperature stress, and is superior to other ultrasonic detection temperature stress methods. However, the mining of accumulated data has not yet been carried out. Therefore, the early intelligent warning of rail temperature force monitoring is the focus of future research.
Footnotes
Handling Editor: James Baldwin
Author note
Wei Shao is now affiliated to Shanghai Railway Bureau Suzhou Station, Shanghai, China.
Declaration of conflicting interests
The author(s) declared no potential conflicts of interest with respect to the research, authorship, and/or publication of this article.
Funding
The author(s) disclosed receipt of the following financial support for the research, authorship, and/or publication of this article: Supported by Natural Science Foundation of China (Grant No.519783393 and 12004240), Major Science and Technology Project of Gansu Province (Grant No. 19ZD2FA001), and China Postdoctoral Science Foundation (Grant No. 2020M671022).