
Abstract
In this article, the acoustic emission tests of uniaxial cyclic load imposed on or released from the sandstone and mudstone were carried out. The deformation and failure characteristics and the law governing the acoustic emission activity were studied. The results of the study show that (1) the variation of acoustic emission events of sandstone and mudstone is law governed and is in agreement with the tendency of stress and strain curve development. (2) The acoustic emission activity of mudstone is most active before peak stress, while sandstone is at peak stress. For the sandstone, when the number of acoustic emission events is the most active, the corresponding acoustic emission energy is not the largest. However, the peak value of acoustic emission events and the peak energy of the mudstone coincide, and the acoustic emission events get to the most intense due to the peak energy. (3) The acoustic emission activity is more severe when a load is imposed on or released from the rock. Compared to loading, the rock damage caused by unloading is even greater. (4) The acoustic emission event at the splitting point is more concentrated. The line of acoustic emission point is basically consistent with the shape of the split.
Introduction
In the engineering work involved in tunneling, subway excavation, slope leveling, and water conservation project construction, the study of the processes of deformation-induced instability and failure is of great significance. The soft rock is characterized by being soft, weak in strength, and strong theoretically. The extent of the soft rock damage has great impact on the project under construction. In recent years, the acoustic emission (AE) technology has been widely applied to solve rock mechanic problems. AE refers to a phenomenon which appears when the rock is under loading, the internal intrinsic micro-cracks will expand, resulting in new cracks, their expansion, and the rupture of the rock. During the process of rock deformation, the local accumulated energy will rapidly emit elastic waves. AE is a transient elastic wave generated by the rapid release of energy within a material, and it can be used to monitor the development of micro-cracks and the failure process in rock samples both continuously and in real time, which makes it better than other methods. 1 Obert of the American Mine Bureau was the first to discover this phenomenon in 1930s. 2 Since then, AE technology has been widely applied to civil engineering and safety assessment and monitoring.
Rock can be broken by both loading and unloading stresses, and the strength and deformation properties of broken rock depend on the rock block and its discontinuity. 3 Acoustic wave monitoring and meso-mechanical simulation methods can be used to study the damage and failure of rocks. Moreover, their greatest limitation is difficult to reflect the dynamic damage in real time. For meso-mechanical simulation method, it is difficult to calibrate the meso-parameters of rocks. On the contrary, AE monitoring can investigate crack initiation and propagation in time due to its sensitivity to rock cracking and damage, and it can reflect dynamic failure in real time. It is a powerful method for examining the behavior of material deformation under stress. 4 AE monitoring has been widely used in studies of rock mechanics and engineering applications. 5 AE signal parameters (AE events and amplitude) were used to infer the relationship between variations of AE event amplitudes and failure processes of rocks, 6 monitor the stress-induced fracturing, initiation and propagation of the main fractures, 7 and detect cracking levels of rock materials under loading conditions. Many experimental studies investigated the development of high-angle shear bands, 8 crack growth during the conventional laboratory hydraulic fracture testing, 9 structure failure, 10 crack initiation stress of crystalline rocks, 11 and damage variable of samples 12 using the continuous accumulation of AE waves.
The rock samples deform under the brittle-ductile transition in the stress state, and the AE parameters are used for characterizing the evolution of porosity, AE activity, as well as micro-crack density and its anisotropy in the failed samples. 8 Direct observation is useful for characterizing both brittle and ductile deformation, but it has limitation that only the surface of the test specimen can be observed. 13 The recent development of high-speed, multi-channel waveform recording technology14,15 has made it possible to monitor the hypocenters of AEs associated with spontaneously fracturing processes in stressed rock samples with high precision. This technique is applied to the analysis of hornblende schist 16 and granitic rocks, 17 and also to the study of the fracture of mudstone containing quartz veins, which play a role as strong asperities. 18 Damage processes involved in grain crushing and pore collapse are manifested by intense AE activity, 19 while the development of localization is associated with spatial clustering of AE events. 20
Many researchers have conducted researches on AE and gained great achievements. SH Chang and CI Lee, 21 for example, conducted three-axial compression acoustic experiments and by turning to data moving point regression technology, determined the damage threshold before the strength reached its peak with the rock under a three-axial compression. Through three-axial compression AE experiments with anthracite, VL Shkuratnik and SV Kuchurin 22 analyzed the acoustic signals of AE and determined the physical properties of the coal. Through experiments with AE before the damage of the rock under uniaxial compression, V Rudajev et al. 23 analyzed the statistic distribution of AE parameters in relation to the compression-to-cracking process and determined the probability of complete breakage of the rock.
Although AE technique is mature based on previous work, researches on AE of the soft rock in deep underground mines are rare. In this work, we conduct AE experiments in sandstone and mudstone with specimens under uniaxial cyclic loading and unloading. sandstone and mudstone are two common materials in deep underground mines. There are typically two kinds of rocks, which are often subjected to cyclic loading and unloading in deep-well mining conditions. In the experiments, the mechanical behaviors and the AE signals of the two rocks are real-time monitored, the rock failure process was clarified, and the AE variation law was obtained.
Uniaxial compressed AE experiments
Experimental principles and facilities
AE is used in fixing the rock failure location thanks to the ability to fix the location of the acoustic source. Under an imposed load, the intrinsic cracks in the rock will expand and emit sound waves to be collected by the sensors attached to various locations of the rock. By turning to the time differences for sound waves collected and the differences for sound sources reaching the locations of various sensors, through Geiger inverse calculation, the emission location can be determined and then the location of the cracking sound could be determined 24 as follows

where x, y, and z are the coordinates for the experimental points set by the experimenters;
The experiment facilities are mainly composed of a loading system and an AE monitoring system. The loading system was the MTS-816 (MTS Systems Corporation) electro-hydraulic servo rock mechanical experiment machine, which can keep real-time records of data such as stress, strain, and time. The DS-2 acoustic emitter produced by Beijing Soft Island Company was used as the emitter for the experiment, which can record data such as AE events, energy, and arrival time. In the experiment, eight channels were used, each channel was connected to an amplifier and a sensor probe, and all the sensor probes were attached symmetrically to the peripheries of the specimen. The experiment systems are shown in Figure 1.

Rock AE test system.
The rock AE test system consists of the loading system, AE monitoring system, compression head, probe, rock specimen, loading compressor, controlling platform, controlling computer, amplifier, AE signal collector, and computer.
Rock specimen preparation
The materials used for the experiment were sandstone and mudstone obtained from No.1 Mine of Xiejiaji. Strictly in accordance with the standards recommended by ISRM 25 (International Society for Rock Mechanics), the rocks were processed into standard cylindrical specimens of 50 mm in diameter and 100 mm in height in the lab. To ensure that the two end surfaces of each specimen are parallel with the tolerance limited to 0.02 mm, abrasive papers with different-sized abrasives were used to polish the surfaces, as shown in Figure 2. The specimens so prepared are reaching to the precision standards. Two groups of sandstone and mudstone specimens were prepared, each consisting of six specimens. Through elementary mechanical experiments, the physico-mechanical parameters for sandstone and mudstone were obtained and listed in Table 1.

Rock specimens: (a) sandstone specimens and (b) mudstone specimens.
Physico-mechanical parameters of rock specimens.

Experiment specifics and methods
The periodic pressure and stress increase of the main roof during the stopping process of underground coal mines are simulated. As shown in Figure 3, in the experiment, cyclic loading and unloading were turned on. During the process, stress was used to control loading and unloading. The stress loading speed was fixed at 0.05 KN/s, and the cyclic loading and unloading went on continuously until the specimen was damaged. In order to collect the deformation of the rock and the acoustically emitted signals in step, the MTS-816 rigid experiment machine and the acoustically emitted signal collection instrument were used. And the sample collection interval was set to 50 µs. In the experiment, the AE sensor probes were attached to the eight points symmetrically distributed on the upper, lower, left, and right sides of the specimen. To guarantee the coupling effect, the contacting points of the probe and the rock were painted with grease and glue was then used to fix the contacting points together. To eliminate the friction between the end of the probe and the cross section of the specimen, both ends of the specimen were wrapped with a thin smooth plastic sheet. 25 To prepare quality specimens, the WSD-3 (Chongqing Pentium CNC Technology Research Institute) digital sonic instrument was used to measure the wave speed. The facilities used in the experiment are shown in Figure 4. The specimen was placed under the experiment machine, and a uniaxial load was imposed on the specimen for the AE test.

Cyclic loading and unloading.

Rock test system.
To obtain accurate experimental results, before the experiment, the precision for testing the AE location instrument was tested, mainly by a pencil-lead breakage test. Its principle is illustrated in Figure 5. Specifically, an AE probe was located at the place in the pre-set coordinates to collect the emitted signals. A pencil was placed in the place where specimen was, and a load was imposed to break the lead core of the pencil. Then, a sound source appeared in a place. Space location was achieved by different distance and time from the lead-breakage point to the two probes. Then, the acoustic source point was compared with the experimental coordinates. If the difference was greater than 2 mm, the parameters of the experiment system should be adjusted until the tolerance was less than 2 mm. At the same time, according to the lead-breakage test, the monitoring threshold of the AE signal is determined (20 mv), which should be larger than the amplitude of the noise in the waveform of the lead-breakage test.
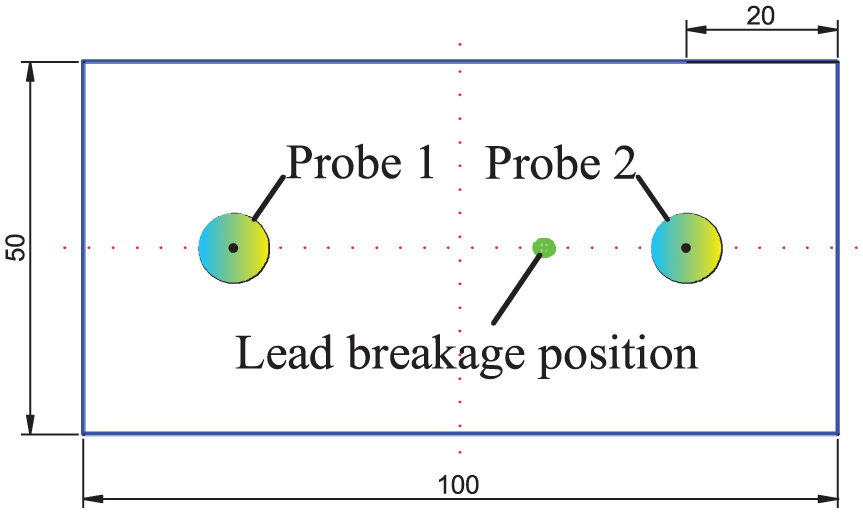
Principle of pencil-lead breakage test.
Analysis of the test results
By turning to the location function of the AE experiment and the Geiger calculation, the acoustic source could be located. With the location of the sound source, under the impacts of uniaxial cyclic loading and unloading, the failure processes of sandstone and mudstone were studied by analyzing AE parameters. In this way, the AE characteristics were obtained. Simultaneously, the spatial evolution of the rock crack damage was also studied.
Deformation characteristics of the rock under cyclic loading and unloading
The experiments with specimens under cyclic loading and unloading reveal that the rock deformation can be divided into four stages: compaction stage, elastic stage, plastic stage, and post-peak failure stage. As the sandstone is relatively hard, the strain appears to be partial rebound after breaking. So, it seems that the third stage includes fourth stage from the stress–strain curve. The stress–strain curves for sandstone and mudstone are shown in Figures 6 and 7, respectively.
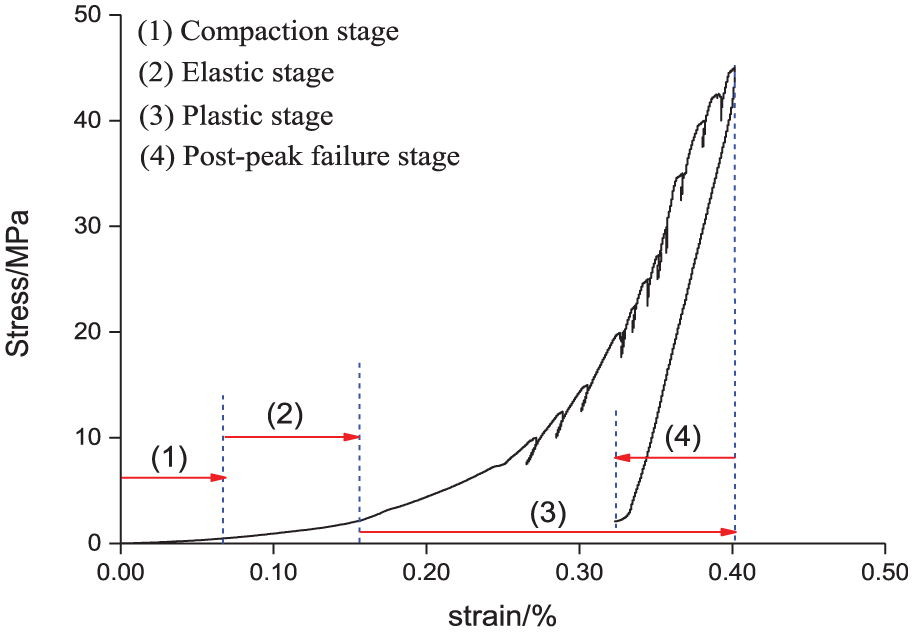
Stress–strain curves of sandstone.
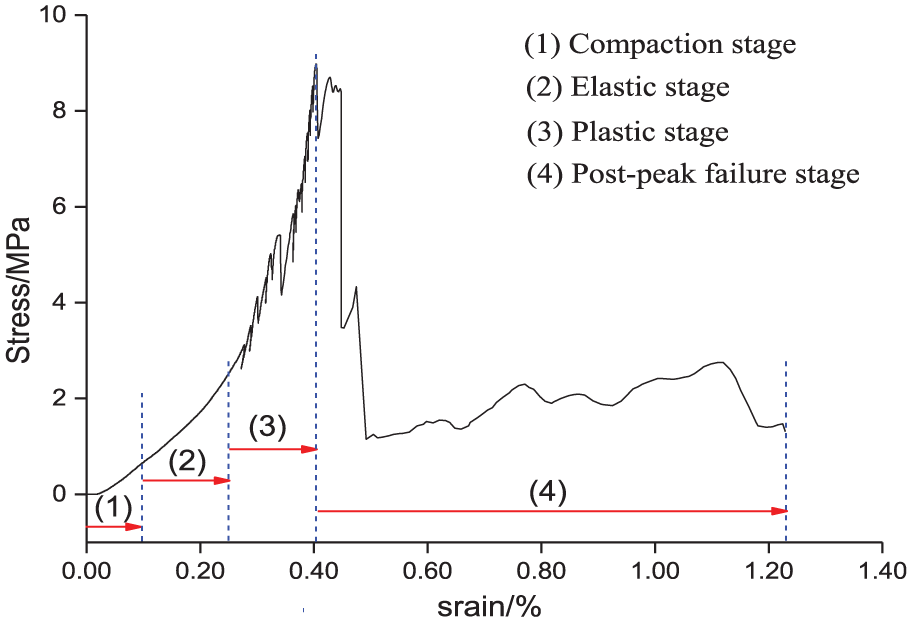
Stress–strain curves of mudstone.
Figures 6 and 7 show that under cyclic loading, the stress reached 0%–20% of its peak, and the strain of the rock was rather weak. When the stress reached 20%–45% of the peak, the axial loading was approximately linearly related to the axial displacement, and the deformation entered its elastic stage. When the stress reached 45%–65% of the peak, with the increase in the stress, the internal damage accumulated, the crack began to expand, and the process entered its plastic stage. When the stress reached 65%–85% of the peak, the failure became more serious and the internal cracks began to accelerate their expansion. At this moment, the unit incremental displacement corresponding to the incremental axial load decreased. When the stress exceeded its peak, the rock was broken. As a result, the axial displacement of the sandstone decreased with the decrease in stress and the tendency of rebounding appeared. Dissimilar to the sandstone, the mudstone continued its increasing displacement with the decrease in stress due to the soft quality of the rock.
Law governing the activity of AE in the process of rock failure
The AE activities of sandstone and mudstone are closely related to the stage of the stress–strain curve. Figures 8 and 9 show the monitored results of the case that under uniaxial cyclic loading and unloading, how the behaviors of the stress, AE event number, and AE energy are related to strain.
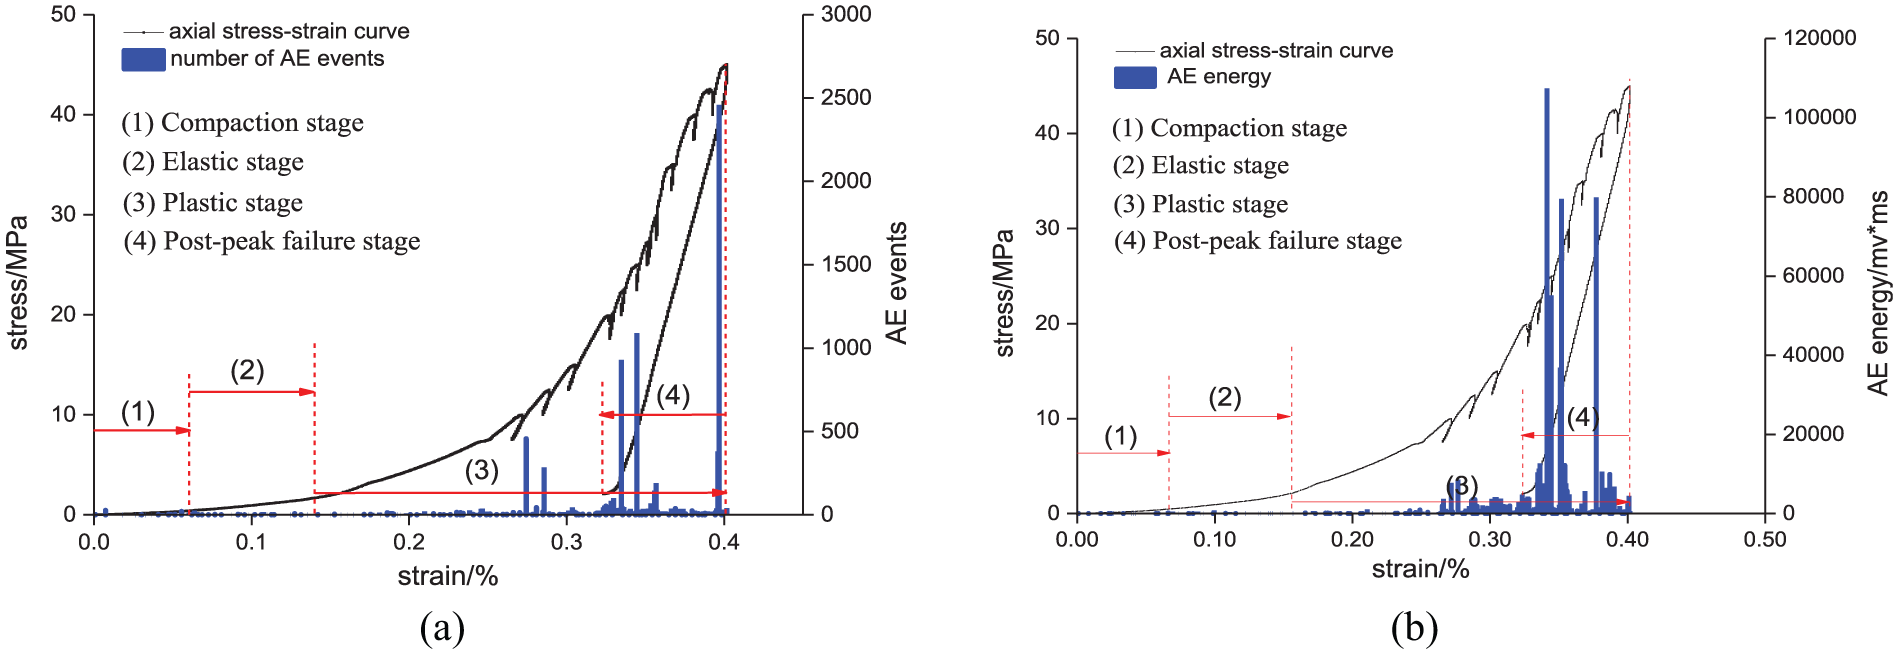
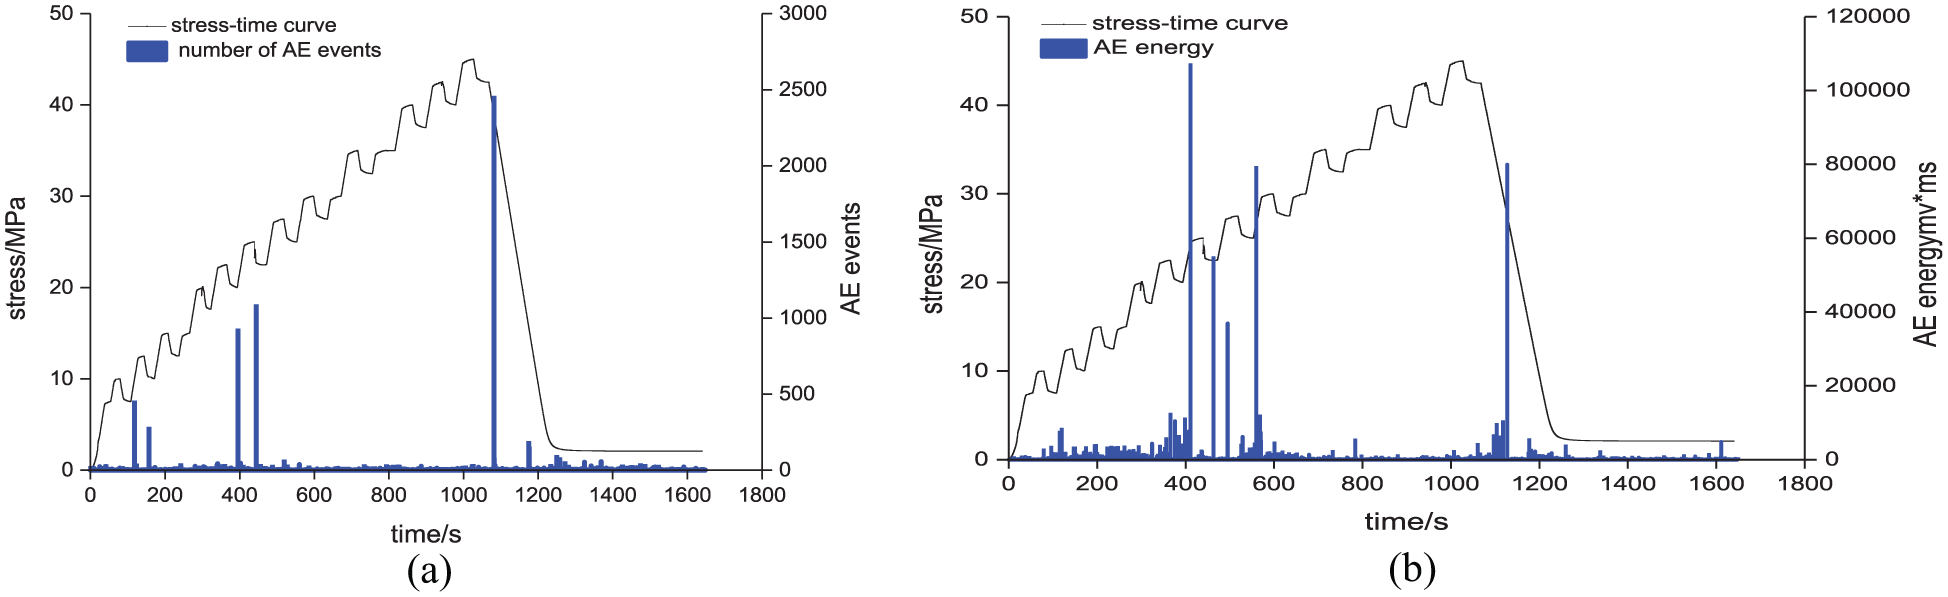
Curves of stress, AE events, and AE energy with strain for sandstone: (a) curves of stress and AE events with strain and (b) curves of stress and AE energy with strain.

Curves of stress, AE events, and AE energy with strain for mudstone: (a) curves of stress and AE events with strain and (b) curves of stress and AE energy with strain.
Under uniaxial cyclic loading and unloading, the variation of AE events of sandstone and mudstone generally coincides with their stress–strain curves. (1) In the compaction stage, as known from Figures 8(a) and 9(a), there were few AE events monitored from sandstone. As for mudstone, in the very initial stage, a few AE events were monitored. As known from Figures 8(b) and 9(b), in the compaction stage, the AE energy for sandstone was approaching zero while that for mudstone fluctuated fairly greatly. The phenomenon can be accounted for by the fact that compared to mudstone, sandstone is more compact in structure with less internal pores, as can be observed when monitoring the acoustic speeds of the two stones. Under initial loading, the original internal pores in the mudstone were closed, and in closing, friction occurred between particles, giving rise to a few AE events. (2) In the elastic stage, for sandstone, there was no AE event. For mudstone, in a split second, there was no AE event. However, shortly after that, AE events increased instantly. The difference can be accounted for by the fact that sandstone has much more elastic modulus than mudstone. When the stress increased, the elastic stage for sandstone lasted much longer than that for mudstone. Instantly after entering the elastic stage, mudstone would soon enter the plastic stage, leading to the increase in AE events. In the later period of the elastic stage, AE events for both stones would increase apparently. (3) In the plastic stage, when the two stones entered the plastic stage, the internal cracks would gradually increase, leading to the worsening of failure, apparent increase in AE events, and continuous increase in AE energy. When the stress reached its peak, new cracks increased in great number, leading to the great increase in AE points. As can be seen from Figure 9, with mudstone, the peak values for AE events and AE energy did not overlap when the stress reached its peak. Instead, they both appeared before the stress peak. In other words, AE was most active shortly before the stress peak. In case of sandstone, the peak value for AE events overlapped with the peak value of the stress. In other words, in case of sandstone, the AE was most active when stress reached its peak. As can be seen from Figures 8(b) and 9(b), in case of sandstone, the AE energy reached its peak before the AE event did, indicating that when the AE of sandstone was most active, the energy was not of its peak value. In case of mudstone, the AE event and energy reached their peak when the stress also reached its peak. In other words, the AE was the most active when the energy reached its peak. (4) In the post-peak failure stage, after stress peak, with the breakage of sandstone, the AE experiment finished. In the process of unloading, the strain tended to rebound and the AE event approached zero. At the same time, the AE energy decreased rapidly and gradually approached zero. Due to the soft weak property, in the process of unloading after breakage, mudstone still experienced large deformation. The AE event decreased in a split second and then reached its peak again. When the stress unloading reached 20% (1190 s in sandstone, 680 s in mudstone) of the peak strength, the AE event and energy apparently decreased and then remained at a rather low level.
As shown in Figure 8(a), in the first cycle, the load on sandstone increased from 5 MPa to the peak of 10 MPa and then decreased to 5 MPa. In the second cycle, the stress on the stone increased from 5 to 15 MPa. When the stress ranged from 5 MPa to less than 10 MPa, there was no AE event observed until the stress reached the peak value of the first cycle, that is, 10 MPa. Since then, AE events increased rapidly and Kaiser effect feature points 26 were observed. And it was in the first cycle that sandstone began to enter its elastic stage. In other words, the point at which Kaiser effects occurred appeared at the initial stage of the elastic stage. And this is in agreement with the idea that the Kaiser effect point usually appears in the later period of the compaction stage or in the initial period of the elastic stage. 8 As can be seen from Figure 9(a), before stress peak, when stress unloading came to completion and reloading began, before the reloading reached the peak for the previous cycle, AE events were monitored and the events remained rather great in number, showing an apparent Felicity effect. In the post-peak stress-decreasing process, two rises were monitored. In the decreasing process, no AE event was monitored. However, when the stress went up to the previous peak, AE events were monitored or the Kaiser effect was observed. This indicates that the Kaiser effect feature point appeared after stress peak.
Time effects of AE in damage processes of the two stones
If researches were purely conducted with parameters such as stress, strain, AE energy, and AE event, time effects in the processes of damage of the two stones could not be revealed. This can be attributed to the fact that the stones are naturally formed in heterogeneous bodies, and in the process of deformation under a force, they will behave non-linearly. Therefore, in AE experiment, time effects should be taken into account.
As can be seen from Figure 10, when time was regarded as a variable, AE events increased greatly at the time of 100 and 400 s. The corresponding stages were the linear elastic stage and the initial period of the elasto-plastic stage. However, shortly before 1000 s or when the stress was approaching its peak, AE event was nearly zero. And AE energy also went down and there appeared a period in which AE was not active. This points out the fact that the analysis of great increase in AE events before stress peak by taking stress and strain into account only without taking time into account is different from the analysis of stress–strain as a function of AT event by taking time into account. As shown in Figure 11, before stress peak, the AE for mudstone kept active. When stress was approaching its peak, that is, when time ranged from 620 to 650 s, AE event was zero. However, it took much shorter time for mudstone to cease to be AE active and become tranquil than it did for sandstone. For the two stones, before stress peak, AE was unusually active. The period was immediately followed by the post-peak damage. For this reason, the AE tranquil period can serve as the portent for rock damage and be applied in rock stability monitoring.
Curves of stress, AE events, and AE energy with time for sandstone: (a) curves of stress and AE events with time and (b) curves of stress and AE energy with time.
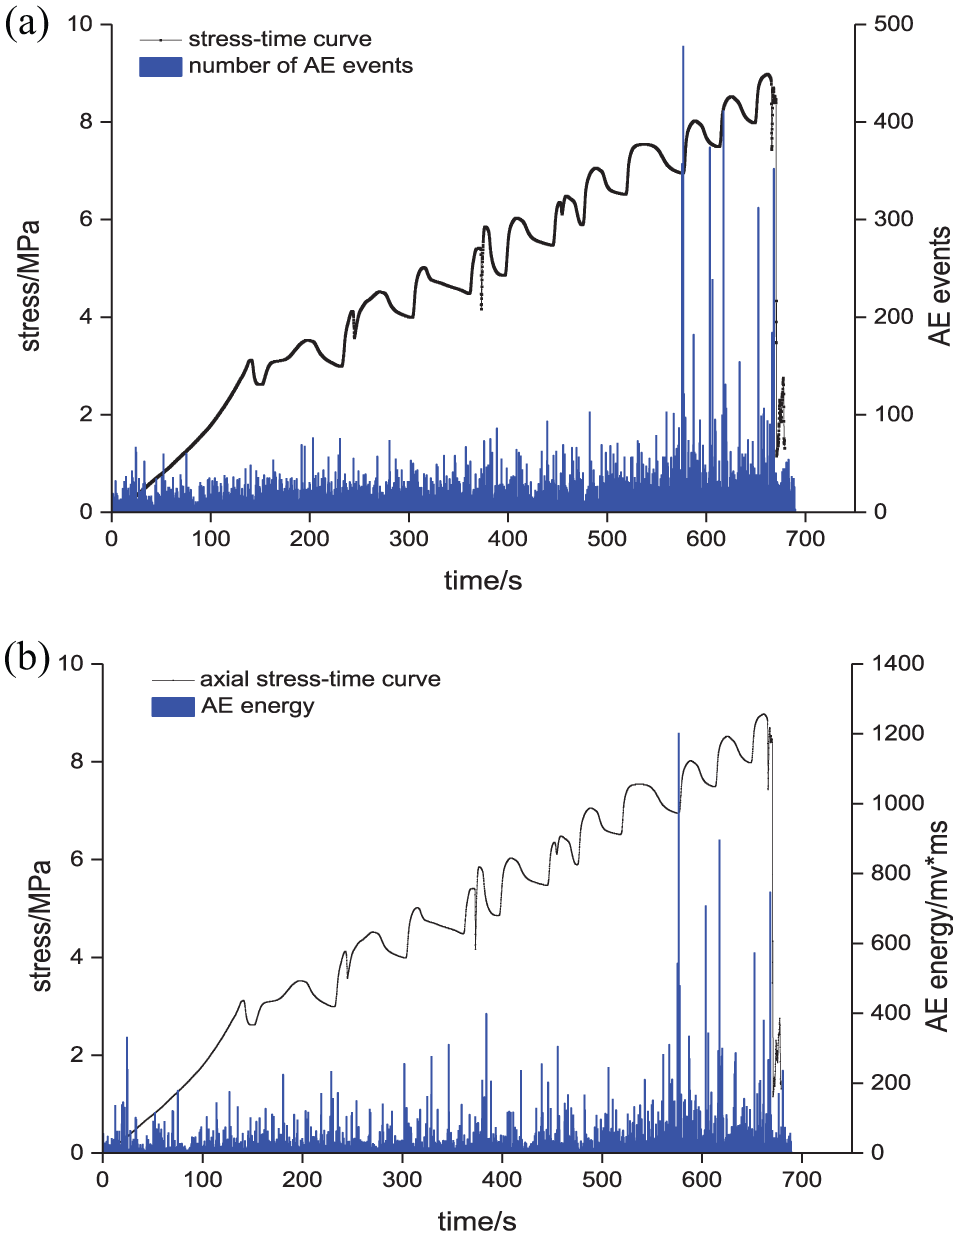
Curves of stress, AE events, and AE energy with time for mudstone: (a) curves of stress and AE events with time and (b) curves of stress and AE energy with time.
AEs compared in loading and unloading
Among AE parameters, amplitude is of great importance, which is calculated by counting AE events against various ranges of AE signal strengths. In loading and unloading, stones will be damaged and AE amplitude can be used to analyze loading and unloading effects and compare the degrees to which the two stones are damaged. Figure 12 shows that in cases of sandstone and mudstone, how time serves as a function of stress–amplitude in the process of loading and unloading. As can be seen from the figure, the cyclic loading and unloading amplitude variation for sandstone is in agreement with that for mudstone. In case of sandstone, in the first cycle of loading, the amplitude increased from 2031 to 2077 mv, while in the first cycle of unloading, the amplitude increased from 2077 to 3203 mv. However, in the second cycle, the amplitude decreased to 2656 mv, showing that the amplitude with loading is always smaller than that with unloading. This points out the fact that the unloading process will result in more active AE and do more serious damage to the stone. And similar method was used to analyze mudstone with similar conclusions drawn.

AE amplitude as a function of loading and unloading: (a) AE amplitude of sandstone in loading and unloading; (b) AE amplitude of mudstone in loading and unloading.
AE location and spatial evolution in the process of rock failure
The eight-sensor probes attached to the specimen were used in the location of AE events. In this way, the damage effects of the rock in various stages of the process could be observed intuitively and the tendency for the crack development could be predicted.
Through monitoring, the locations of AE points reflecting different degrees of damage for sandstone and mudstone are shown in Figures 13 and 14, respectively. Figures 15 and 16 show the photographs taken after the breakage of the two stones to be compared with the AE locations monitored.

Acoustic emission locations of sandstone in different stages: (a) the compaction stage, (b) the elastic stage, (c) the plastic stage, and (d) the post-peak damage stage.

Acoustic emission locations of mudstone in different stages: (a) the compaction stage, (b) the elastic stage, (c) the plastic stage, and (d) the post-peak damage stage.

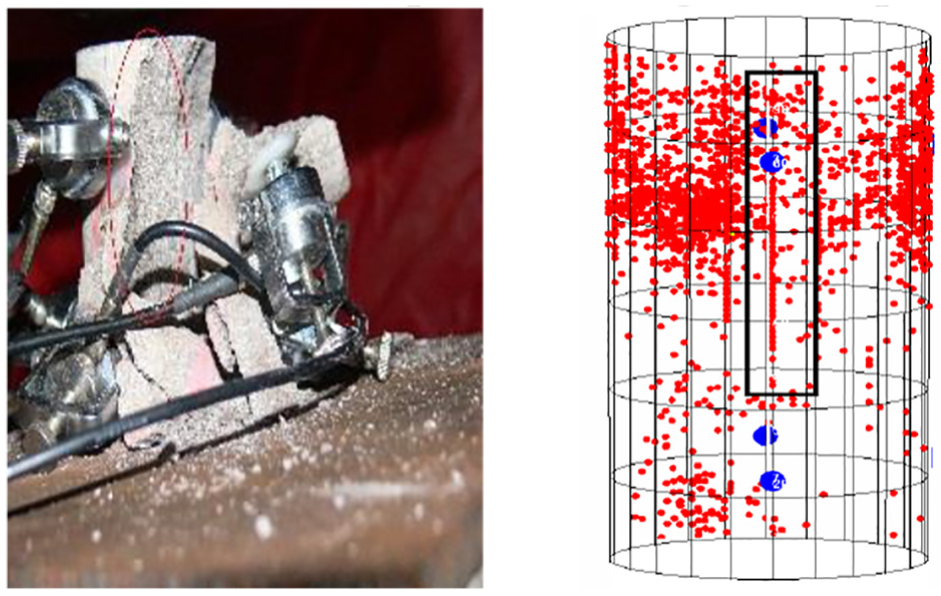
Fracture and acoustic emission locations in sandstone: photograph and figure compared.
Fracture and acoustic emission locations in mudstone: photograph and figure compared.
As can be seen from Figures 13 and 14, in the compaction and early elastic periods, the AE events were fewer in number and evenly distributed, amounting to about 15% of the total. As against sandstone, in the compaction stage, AE events for mudstone occurred in a rather concentrated way. This can be attributed to the uneven distribution of the pores and this part of the stone might have more pores than another part. In the late period of the elastic stage, AE events increased at an accelerating speed and then AE entered its plastic stage. At that time, AE activity frequency increased rapidly, especially when the stress was approaching its peak. As a result, the AE events accounted to 70% of the total and the area with continuously concentrated AE events was witnessed. This shows that the crack development was in process. During the post-peak stress period, AE activity was apparently weakening, with AE events amounting to 10% of the total. As can be seen from the location figures and the damaged rock photographs in Figures 15 and 16, after the uniaxial unloading, longitudinal splitting cracks appeared in the rock body and AE events were concentrated around the splitting points. And the line formed by AE points was basically in agreement with the shape of splitting cracks.
Conclusion
AE experiments were conducted with sandstone and mudstone by uniaxial cyclic loading and unloading and analyzed the AE feature differences monitored in the process of sandstone and mudstone damage. The major conclusions are drawn as follows:
In case of mudstone, the peak value of AE events does not coincide with the peak value of stress. In case of sandstone, the peak value of AE events coincides with the peak value of stress.
In case of sandstone, the AE energy peak appeared before the AE event peak. In case of mudstone, the AE event peak coincides with the AE energy peak.
In case of sandstone, the Kaiser features appeared at the beginning of the elastic stage. In case of mudstone, the Kaiser features appeared after stress peak.
In cyclic loading and unloading, the experiment with AE amplitude reveals that the process of loading resulted in smaller amplitude than the process of unloading, indicating that after the process of loading, unloading would result in more acute AE activity. As against loading, unloading would result in more serious damage to the rock.
A comparison of the damaged rock photographs with the corresponding figures in terms of AE location of rock failure reveals that after uniaxial cyclic loading and unloading, the longitudinal splitting cracks appeared in the rock. AE events were concentrated at the splitting point and the line consisting of AE points basically coincided with the splitting shape.
Application of distributed sensor in engineering technology is feasible, and we can take the sensor technology as the center and strengthen the research in rock mechanical experiments. So, more efficient and precise sensors can be used in engineering science.
Footnotes
Handling Editor: Longjun Dong
Declaration of conflicting interests
The author(s) declared no potential conflicts of interest with respect to the research, authorship, and/or publication of this article.
Funding
The author(s) disclosed receipt of the following financial support for the research, authorship, and/or publication of this article: This work was supported by the National Key R&D Program of China (no. 2017YFC0603000), the National Natural Science Foundation of China (no. 51674008 and no. 51374013), the Key Task Project in Scientific and Technological Research in Anhui Province (no. 1604a0802107), and the Outstanding Top-notch Talent Cultivation Project in Anhui Province (no. gxbjZD2016051).